Quantum computing is rapidly transforming the technology landscape, and two key players leading this innovation are IonQ, Inc. and Rigetti Computing, Inc. Both companies develop advanced quantum hardware and provide cloud-based access to their systems, targeting overlapping markets in the quantum computing sector. This comparison will explore their strategies, market positions, and growth prospects to help you decide which company holds the most promise for your investment portfolio. Let’s dive into the details to uncover the more compelling opportunity.
Table of contents
Companies Overview
I will begin the comparison between IonQ and Rigetti by providing an overview of these two companies and their main differences.
IonQ Overview
IonQ, Inc. develops general-purpose quantum computing systems, offering access to quantum computers with 20 qubits mainly via cloud platforms including Amazon Braket, Microsoft Azure Quantum, and Google Cloud Marketplace. Founded in 2015 and headquartered in College Park, Maryland, IonQ positions itself as a leader in quantum computing hardware within the technology sector, employing 407 full-time staff and trading on the NYSE with a market cap of about 16.6B USD.
Rigetti Overview
Rigetti Computing, Inc. operates as an integrated systems company focused on building quantum computers and the superconducting processors that power them. It delivers its quantum machines through its Quantum Cloud Services platform, integrating with public, private, and hybrid clouds. Headquartered in Berkeley, California, and founded in 2013, Rigetti trades on NASDAQ with a market cap near 7.8B USD and employs 137 people in the technology industry.
Key similarities and differences
Both IonQ and Rigetti are US-based technology companies specializing in quantum computing hardware and cloud access to quantum systems. IonQ emphasizes general-purpose quantum computing with a higher employee count and market cap, while Rigetti integrates systems with a focus on superconducting processors and offers a proprietary cloud service. They share a similar industry focus but differ in scale, technology approach, and exchange listing.
Income Statement Comparison
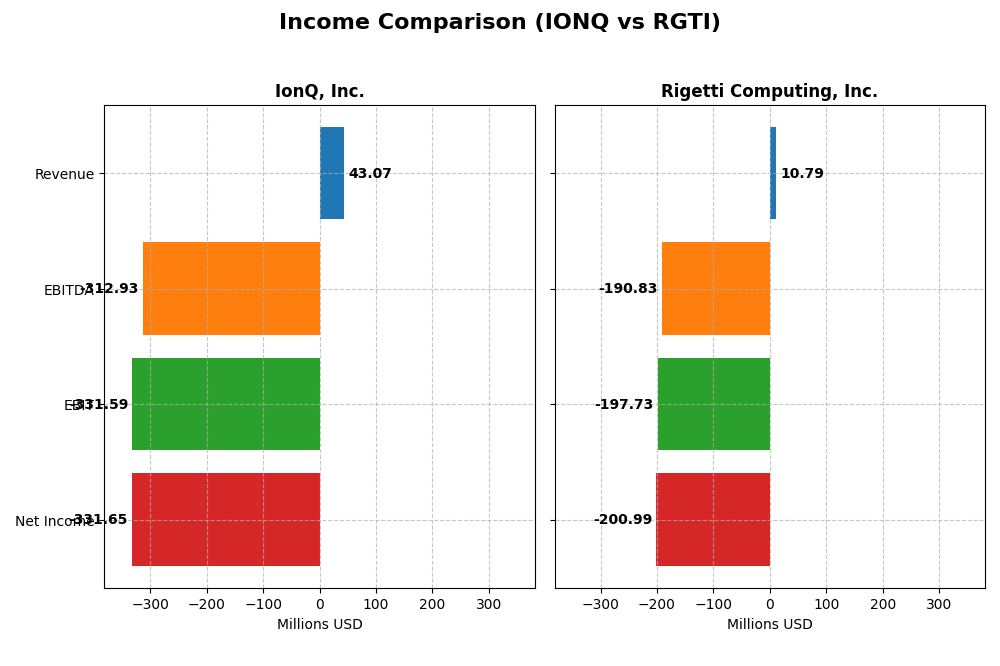
The following table compares the most recent fiscal year income statement figures for IonQ, Inc. and Rigetti Computing, Inc., providing a clear snapshot of their financial performance.
| Metric | IonQ, Inc. (IONQ) | Rigetti Computing, Inc. (RGTI) |
|---|---|---|
| Market Cap | 16.6B | 7.8B |
| Revenue | 43.1M | 10.8M |
| EBITDA | -313.0M | -190.8M |
| EBIT | -331.6M | -197.7M |
| Net Income | -331.6M | -201.0M |
| EPS | -1.56 | -1.09 |
| Fiscal Year | 2024 | 2024 |
Income Statement Interpretations
IonQ, Inc.
IonQ’s revenue showed significant growth from 2020 to 2024, rising from zero to $43M in 2024, nearly doubling from 2023. However, net income deteriorated sharply, with losses increasing to -$332M in 2024. Gross margin remained low at 8.87%, while operating margins worsened. The latest year saw strong revenue growth but declining profitability, reflecting high R&D and operating expenses.
Rigetti Computing, Inc.
Rigetti’s revenue peaked in 2022 at $13M but declined to $10.8M in 2024, with net losses deepening to -$201M. Despite a strong gross margin of 52.8%, the company posted unfavorable operating and net margins, heavily impacted by interest expenses. The most recent year marked a decrease in revenue and worsening earnings, with notable margin contractions and elevated costs.
Which one has the stronger fundamentals?
Both companies exhibit unfavorable income statement fundamentals, but IonQ shows more favorable revenue growth in the latest year and zero interest expenses compared to Rigetti’s high interest burden. Rigetti maintains a higher gross margin, yet its operating losses and net margin are more severe. Overall, both face significant profitability challenges with distinct cost structure concerns.
Financial Ratios Comparison
The table below presents a side-by-side comparison of key financial ratios for IonQ, Inc. and Rigetti Computing, Inc. based on their most recent fiscal year data ending 2024.
| Ratios | IonQ, Inc. (IONQ) | Rigetti Computing, Inc. (RGTI) |
|---|---|---|
| ROE | -86.40% | -158.77% |
| ROIC | -48.22% | -24.91% |
| P/E | -26.83 | -14.02 |
| P/B | 23.18 | 22.26 |
| Current Ratio | 10.50 | 17.42 |
| Quick Ratio | 9.98 | 17.42 |
| D/E | 0.046 | 0.070 |
| Debt-to-Assets | 3.49% | 3.09% |
| Interest Coverage | 0 | -21.05 |
| Asset Turnover | 0.085 | 0.038 |
| Fixed Asset Turnover | 0.69 | 0.20 |
| Payout ratio | 0% | 0% |
| Dividend yield | 0% | 0% |
Interpretation of the Ratios
IonQ, Inc.
IonQ’s 2024 financial ratios reveal a majority of unfavorable metrics, including a deeply negative net margin (-770%) and return on equity (-86.4%), indicating weak profitability and efficiency. The company benefits from low debt levels (debt-to-assets 3.49%) and a strong quick ratio (9.98), yet suffers from poor asset turnover (0.08). IonQ does not pay dividends, reflecting its negative earnings and reinvestment focus typical of a high-growth tech firm.
Rigetti Computing, Inc.
Rigetti’s ratios also show predominantly unfavorable results, with an extreme negative net margin (-1863%) and return on equity (-159%), signaling substantial losses and inefficiency. Despite a strong current and quick ratio (17.42) and low leverage (debt-to-assets 3.09%), asset turnover remains low (0.04). Rigetti does not distribute dividends, consistent with ongoing investment in growth and technology development amid losses.
Which one has the best ratios?
Both IonQ and Rigetti exhibit largely unfavorable financial ratios in 2024, with weak profitability and asset efficiency. Each maintains low debt and strong liquidity, though IonQ shows slightly better asset turnover and interest coverage. Given the similar proportion of favorable ratios (28.57%) but lower losses, IonQ’s ratios may be marginally less concerning than Rigetti’s overall profile.
Strategic Positioning
This section compares the strategic positioning of IonQ and Rigetti, focusing on market position, key segments, and exposure to technological disruption:
IonQ, Inc.
- Leading NYSE-listed quantum hardware firm with a $16.6B market cap, facing high competitive pressure.
- Focuses on general-purpose quantum computing systems, offering 20-qubit access via major cloud platforms.
- Provides quantum computing access primarily through partnerships with AWS, Microsoft, and Google cloud marketplaces.
Rigetti Computing, Inc.
- Smaller NASDAQ-listed quantum hardware company with $7.8B market cap, moderate competitive pressure.
- Builds integrated quantum computers and processors, revenues driven by quantum system access and research services.
- Offers Quantum Cloud Services platform integrating machines into public, private, and hybrid clouds.
IonQ vs Rigetti Positioning
IonQ pursues a diversified cloud-access strategy through major platforms, leveraging a broader market presence. Rigetti concentrates on integrated systems and collaborative services, offering a more focused business model with lower market capitalization.
Which has the best competitive advantage?
Both companies are currently shedding value, but Rigetti shows improving profitability with a growing ROIC trend, while IonQ’s declining ROIC indicates worsening value destruction, implying Rigetti holds a slightly better competitive advantage.
Stock Comparison
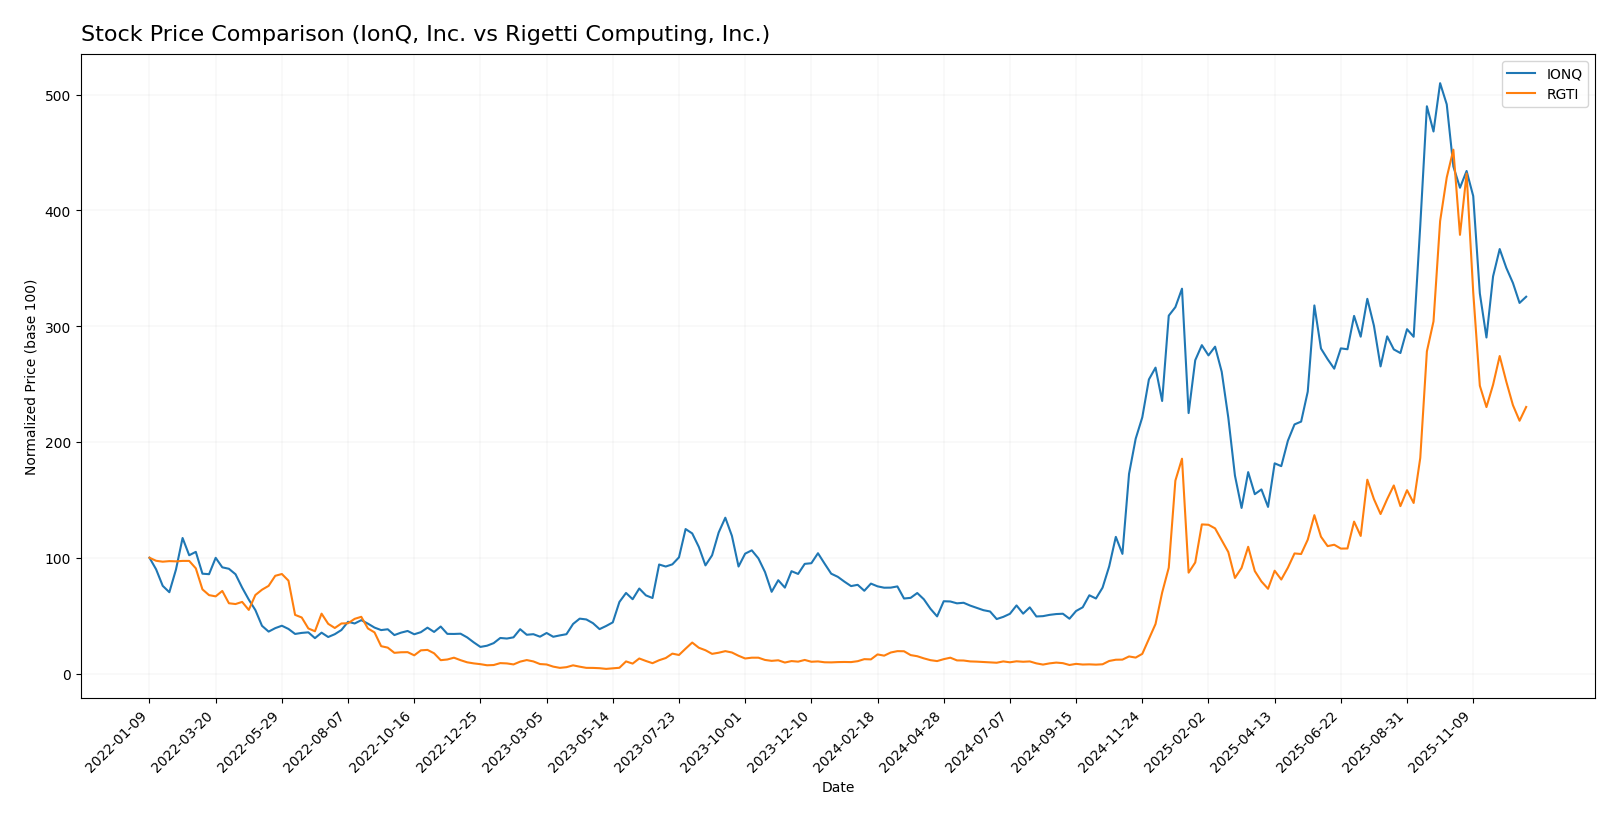
Over the past 12 months, IonQ, Inc. and Rigetti Computing, Inc. have demonstrated significant bullish trends, with notable price gains followed by recent declines in trading activity and price performance.
Trend Analysis
IonQ, Inc. showed a strong bullish trend with a 319.09% price increase over the past year, though recent months indicate a 25.69% decline and decelerating momentum. Volatility remains elevated with an 18.67 standard deviation.
Rigetti Computing, Inc. experienced an even more pronounced bullish trend, rising 1788.0% over the past year, but recent data reveal a sharper 49.12% price drop and decelerating trend with moderate volatility at 11.14 standard deviation.
Comparing both, Rigetti Computing delivered higher overall market performance with a larger annual gain, despite both stocks facing recent downward corrections in early 2026.
Target Prices
The consensus target prices indicate moderate upside potential for both IonQ, Inc. and Rigetti Computing, Inc.
| Company | Target High | Target Low | Consensus |
|---|---|---|---|
| IonQ, Inc. | 100 | 55 | 72.57 |
| Rigetti Computing, Inc. | 50 | 18 | 35.83 |
Analysts expect IonQ’s stock to rise from $46.77 to around $72.57, suggesting a significant upside. Rigetti’s consensus at $35.83 also implies notable growth potential above its current $23.60 price.
Analyst Opinions Comparison
This section compares analysts’ ratings and grades for IonQ, Inc. and Rigetti Computing, Inc.:
Rating Comparison
IONQ Rating
- Rating: C- indicating a very favorable overall assessment.
- Discounted Cash Flow Score: 1, rated very unfavorable.
- ROE Score: 1, very unfavorable return on equity performance.
- ROA Score: 1, very unfavorable return on assets efficiency.
- Debt To Equity Score: 4, favorable balance sheet strength.
- Overall Score: 1, very unfavorable overall financial standing.
RGTI Rating
- Rating: C indicating a very favorable overall assessment.
- Discounted Cash Flow Score: 1, rated very unfavorable.
- ROE Score: 1, very unfavorable return on equity performance.
- ROA Score: 1, very unfavorable return on assets efficiency.
- Debt To Equity Score: 4, favorable balance sheet strength.
- Overall Score: 2, moderate overall financial standing.
Which one is the best rated?
Based strictly on the provided data, Rigetti Computing, Inc. holds a higher overall score of 2 (moderate) compared to IonQ’s 1 (very unfavorable). Both share similar low scores in cash flow, ROE, and ROA, but Rigetti edges IonQ in overall financial standing.
Scores Comparison
Here is a comparison of IonQ and Rigetti Computing scores based on Altman Z-Score and Piotroski Score:
IonQ Scores
- Altman Z-Score: 3.59, indicating a safe financial zone with low bankruptcy risk.
- Piotroski Score: 2, classified as very weak financial strength.
Rigetti Scores
- Altman Z-Score: 101.71, well within the safe zone, indicating very low bankruptcy risk.
- Piotroski Score: 2, classified as very weak financial strength.
Which company has the best scores?
Both IonQ and Rigetti Computing are in the safe zone for Altman Z-Score, but Rigetti’s score is significantly higher. Both companies share the same very weak Piotroski Score of 2, indicating similar financial strength levels by that measure.
Grades Comparison
Here is a summary of the latest grades assigned to IonQ, Inc. and Rigetti Computing, Inc.:
IonQ, Inc. Grades
This table shows recent grades and actions from reputable grading companies for IonQ, Inc.
| Grading Company | Action | New Grade | Date |
|---|---|---|---|
| Benchmark | Maintain | Buy | 2024-08-12 |
| Goldman Sachs | Maintain | Neutral | 2024-08-09 |
| Craig-Hallum | Maintain | Buy | 2024-08-08 |
| Needham | Maintain | Buy | 2024-05-16 |
| Needham | Maintain | Buy | 2024-05-09 |
| Goldman Sachs | Maintain | Neutral | 2024-02-29 |
| Needham | Maintain | Buy | 2024-02-29 |
| Morgan Stanley | Maintain | Equal Weight | 2023-10-30 |
| Needham | Maintain | Buy | 2023-09-20 |
| Needham | Maintain | Buy | 2023-09-19 |
IonQ’s grades predominantly reflect a “Buy” consensus, with some “Neutral” and “Equal Weight” ratings maintained over time.
Rigetti Computing, Inc. Grades
Below are recent grades and actions from recognized grading firms for Rigetti Computing, Inc.
| Grading Company | Action | New Grade | Date |
|---|---|---|---|
| B. Riley Securities | Maintain | Neutral | 2025-11-12 |
| Benchmark | Maintain | Buy | 2025-11-12 |
| B. Riley Securities | Downgrade | Neutral | 2025-11-03 |
| Benchmark | Maintain | Buy | 2025-10-07 |
| B. Riley Securities | Maintain | Buy | 2025-09-22 |
| Benchmark | Maintain | Buy | 2025-08-13 |
| Needham | Maintain | Buy | 2025-08-04 |
| B. Riley Securities | Maintain | Buy | 2025-07-23 |
| Benchmark | Maintain | Buy | 2025-05-15 |
| Needham | Maintain | Buy | 2025-05-14 |
Rigetti Computing’s grades mostly indicate a “Buy” consensus, though there was a recent downgrade to “Neutral” by B. Riley Securities.
Which company has the best grades?
Both companies have garnered mostly “Buy” ratings from reputable graders, but IonQ shows a more consistent “Buy” trend without recent downgrades. This steadiness may influence investor perceptions regarding stability and confidence in IonQ’s outlook compared to Rigetti’s more mixed recent ratings.
Strengths and Weaknesses
Below is a comparison of key strengths and weaknesses for IonQ, Inc. (IONQ) and Rigetti Computing, Inc. (RGTI) based on their recent financial and operational performance.
| Criterion | IonQ, Inc. (IONQ) | Rigetti Computing, Inc. (RGTI) |
|---|---|---|
| Diversification | Limited product lines; focus on quantum hardware | Moderate diversification including quantum access and research services |
| Profitability | Negative net margin (-770%), declining ROIC, value destroying | Negative net margin (-1863%), but improving ROIC trend, still value destroying |
| Innovation | Strong presence in quantum computing innovation, but profitability challenges | Growing innovation with expanding quantum access services |
| Global presence | Primarily US-focused, limited global footprint | US-based with potential for global expansion |
| Market Share | Leading in quantum hardware commercialization | Smaller market share, niche quantum services provider |
Key takeaways: Both companies are currently unprofitable and value destructive, but Rigetti shows improving profitability trends. IonQ leads in hardware innovation while Rigetti offers more diversified quantum services. Investors should weigh innovation potential against financial risks.
Risk Analysis
Below is a table summarizing the key risks facing IonQ, Inc. and Rigetti Computing, Inc. as of 2026, based on recent financial and operational data:
| Metric | IonQ, Inc. | Rigetti Computing, Inc. |
|---|---|---|
| Market Risk | High beta 2.62 implies significant price volatility | Moderate beta 1.69 indicates moderate volatility |
| Debt level | Low debt-to-equity 0.05, low debt-to-assets 3.5% | Low debt-to-equity 0.07, low debt-to-assets 3.1% |
| Regulatory Risk | Moderate, due to emerging quantum tech regulations | Moderate, similar exposure in quantum computing space |
| Operational Risk | High, due to negative margins and low asset turnover | High, with very negative margins and low asset turnover |
| Environmental Risk | Low, limited direct environmental impact | Low, similar profile in tech hardware sector |
| Geopolitical Risk | Moderate, US-based but global cloud partnerships | Moderate, US-based with increasing global cloud reliance |
Both companies face substantial operational risks driven by persistent negative profitability and inefficient asset utilization, which may impact their long-term sustainability. Market risk is elevated for IonQ due to its higher beta, signaling more price fluctuations. Debt levels remain low and manageable for both firms, reducing financial distress risk. Regulatory and geopolitical uncertainties persist in the evolving quantum computing industry, warranting cautious monitoring.
Which Stock to Choose?
IonQ, Inc. shows a strong revenue growth of 95.41% in 2024 but suffers from negative profitability with ROE at -86.4% and ROIC at -48.22%. The company maintains low debt levels (D/E 0.05) and a high current ratio of 10.5, yet its overall financial ratios and income statement are unfavorable. Its rating stands at C- with a very unfavorable overall score.
Rigetti Computing, Inc. experienced a 10.14% revenue decline in 2024 and exhibits even weaker profitability metrics, including ROE at -158.77% and ROIC at -24.91%. Despite moderate debt (D/E 0.07) and a strong current ratio of 17.42, its financial ratios and income statement remain mostly unfavorable. Its rating is C, with a moderate overall score.
For investors, IonQ could appear more favorable for those prioritizing revenue growth despite negative profitability and financial challenges, while Rigetti might be seen as slightly improving in profitability but facing revenue decline and weaker income metrics. Risk-tolerant investors focusing on growth might lean towards IonQ, whereas those monitoring improving profitability trends may consider Rigetti.
Disclaimer: Investment carries a risk of loss of initial capital. The past performance is not a reliable indicator of future results. Be sure to understand risks before making an investment decision.
Go Further
I encourage you to read the complete analyses of IonQ, Inc. and Rigetti Computing, Inc. to enhance your investment decisions: