Quantum computing stands at the forefront of technological innovation, promising to revolutionize industries from cryptography to pharmaceuticals. IonQ, Inc. and Quantum Computing, Inc. are two prominent players in this emerging field, both operating within the computer hardware sector but with distinct approaches—IonQ focuses on developing general-purpose quantum computers, while Quantum Computing emphasizes quantum software and application acceleration. This article will help you determine which company presents the most compelling investment opportunity in 2026.
Table of contents
Companies Overview
I will begin the comparison between IonQ and Quantum Computing by providing an overview of these two companies and their main differences.
IonQ Overview
IonQ, Inc. develops general-purpose quantum computing systems and offers access to 20-qubit quantum computers. The company distributes its technology through major cloud platforms like Amazon Braket, Microsoft Azure Quantum, and Google Cloud Marketplace, alongside its own cloud service. Founded in 2015 and based in College Park, Maryland, IonQ operates in the computer hardware industry with a market cap of about 16.6B USD.
Quantum Computing Overview
Quantum Computing, Inc. provides software tools and applications designed for quantum computers, including Qatalyst, an accelerator for quantum-ready applications on classical and quantum hardware. The company also supplies multiple quantum processing units such as DWave, Rigetti, and IonQ. Established in 2018 and headquartered in Leesburg, Virginia, it serves commercial and government clients with a market cap near 1.5B USD.
Key similarities and differences
Both companies operate within the computer hardware sector focused on quantum computing technologies in the US. IonQ primarily develops and sells quantum computing hardware access, while Quantum Computing emphasizes software tools and multi-platform quantum processing units. IonQ is significantly larger by market cap and employee count, whereas Quantum Computing targets a niche market with specialized software solutions and a smaller workforce.
Income Statement Comparison
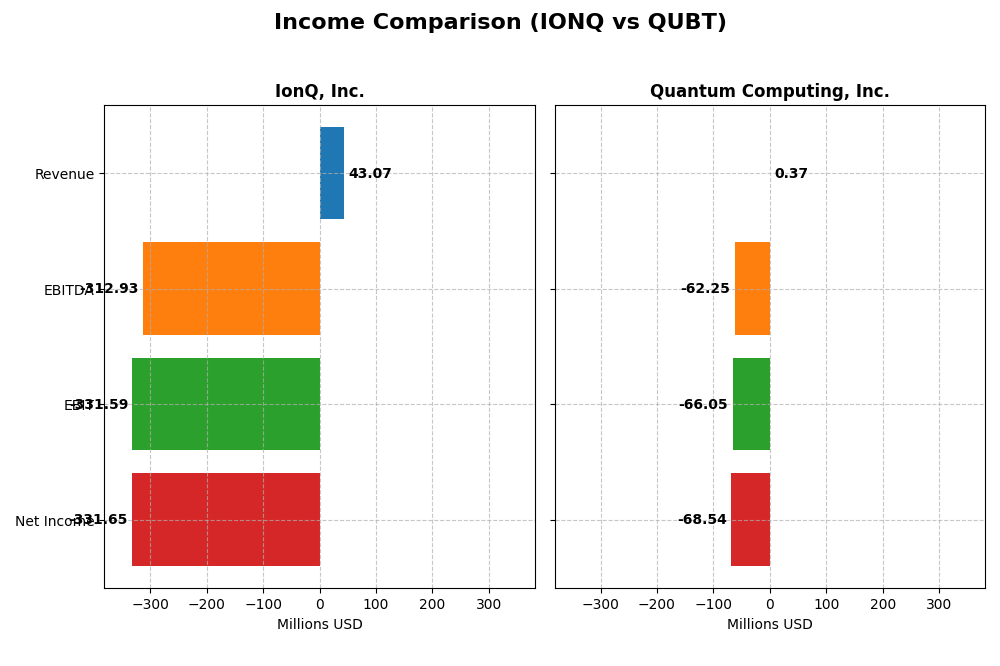
Below is the income statement comparison for IonQ, Inc. and Quantum Computing, Inc. for the fiscal year 2024, showing key financial metrics to help evaluate their recent performance.
| Metric | IonQ, Inc. (IONQ) | Quantum Computing, Inc. (QUBT) |
|---|---|---|
| Market Cap | 16.6B | 1.5B |
| Revenue | 43M | 0.37M |
| EBITDA | -313M | -62M |
| EBIT | -332M | -66M |
| Net Income | -332M | -69M |
| EPS | -1.56 | -0.73 |
| Fiscal Year | 2024 | 2024 |
Income Statement Interpretations
IonQ, Inc.
IonQ’s revenue showed strong growth from 2020 to 2024, nearly doubling in the last year to $43M, yet net income has deteriorated significantly, reaching a loss of $331.6M in 2024. Gross margins remain low but stable around 8.87%, while operating and net margins are deeply negative. The latest year saw revenue growth of 95.41% but worsening profitability and margins.
Quantum Computing, Inc.
Quantum Computing experienced minimal revenue growth, reaching $0.37M in 2024 with persistent net losses totaling $68.5M. Gross margins are negative and declining, and interest expenses have a high unfavorable impact. Despite a modest 4.19% revenue increase in the past year, margins and net income worsened, reflecting ongoing operational challenges and heavy losses.
Which one has the stronger fundamentals?
Both companies demonstrate unfavorable income statements with sustained losses and poor margins. IonQ shows stronger revenue growth and zero interest expense, but suffers from steep net losses and declining profitability. Quantum Computing’s revenue growth is minimal, with unfavorable margins and significant interest costs. Overall, both face fundamental weaknesses, with IonQ displaying somewhat better scale and growth dynamics.
Financial Ratios Comparison
The table below presents a side-by-side comparison of key financial ratios for IonQ, Inc. and Quantum Computing, Inc. based on their latest fiscal year data (2024).
| Ratios | IonQ, Inc. (IONQ) | Quantum Computing, Inc. (QUBT) |
|---|---|---|
| ROE | -86.4% | -63.9% |
| ROIC | -48.2% | -17.4% |
| P/E | -26.8 | -22.7 |
| P/B | 23.2 | 14.5 |
| Current Ratio | 10.5 | 17.4 |
| Quick Ratio | 10.0 | 17.4 |
| D/E (Debt-to-Equity) | 0.046 | 0.011 |
| Debt-to-Assets | 3.5% | 0.8% |
| Interest Coverage | 0 | -10.4 |
| Asset Turnover | 0.085 | 0.0024 |
| Fixed Asset Turnover | 0.69 | 0.038 |
| Payout Ratio | 0 | -0.3% |
| Dividend Yield | 0% | 0.014% |
Interpretation of the Ratios
IonQ, Inc.
IonQ’s financial ratios reveal multiple weaknesses, including a severely negative net margin of -770%, poor return on equity at -86.4%, and unfavorable returns on invested capital. The company has a high current ratio of 10.5 but this is flagged as unfavorable, indicating potential inefficiencies. IonQ does not pay dividends, reflecting its focus on reinvestment and growth rather than shareholder distributions.
Quantum Computing, Inc.
Quantum Computing, Inc. also shows unfavorable financial ratios with an extremely negative net margin of -18,376% and a weak return on equity of -63.9%. The company’s current ratio is high at 17.36 but considered unfavorable, while its quick ratio and low debt levels are favorable. Like IonQ, Quantum Computing does not pay dividends, likely prioritizing reinvestment and development in a high-growth phase.
Which one has the best ratios?
Both IonQ and Quantum Computing exhibit predominantly unfavorable financial ratios with significant negative profitability and return metrics. Each has favorable liquidity and leverage ratios, but these are outweighed by their poor operational performance. Overall, neither company has distinctly superior ratios, as both face substantial financial challenges in 2024.
Strategic Positioning
This section compares the strategic positioning of IonQ and Quantum Computing, Inc., focusing on Market position, Key segments, and Exposure to technological disruption:
IonQ
- Leading provider of general-purpose quantum computing systems with 20 qubits, facing competitive pressure in hardware.
- Key business driver is access to quantum computers via cloud platforms like AWS, Microsoft Azure, and Google Cloud.
- Exposure centered on quantum hardware innovation and cloud integration, dependent on advances in qubit technology.
Quantum Computing, Inc.
- Focused on quantum software tools and applications, serving commercial and government clients with multiple quantum processing units.
- Main segment is software services including Qatalyst accelerator, with limited revenue from services reported at $346K in 2024.
- Exposure to disruption through software enabling quantum-ready applications and multi-platform quantum processing support.
IonQ vs Quantum Computing, Inc. Positioning
IonQ’s approach centers on hardware development and cloud quantum access, representing a more concentrated market focus. Quantum Computing, Inc. offers diversified software solutions and multi-platform support, but with smaller scale and limited revenue visibility.
Which has the best competitive advantage?
Both companies are shedding value with ROIC below WACC; IonQ shows a very unfavorable declining profitability, while Quantum Computing, Inc. has slightly unfavorable valuation but improving ROIC trend, indicating increasing profitability potential.
Stock Comparison
The stock prices of IonQ, Inc. and Quantum Computing, Inc. have shown strong upward trends over the past 12 months, with both experiencing significant gains followed by recent downward corrections.
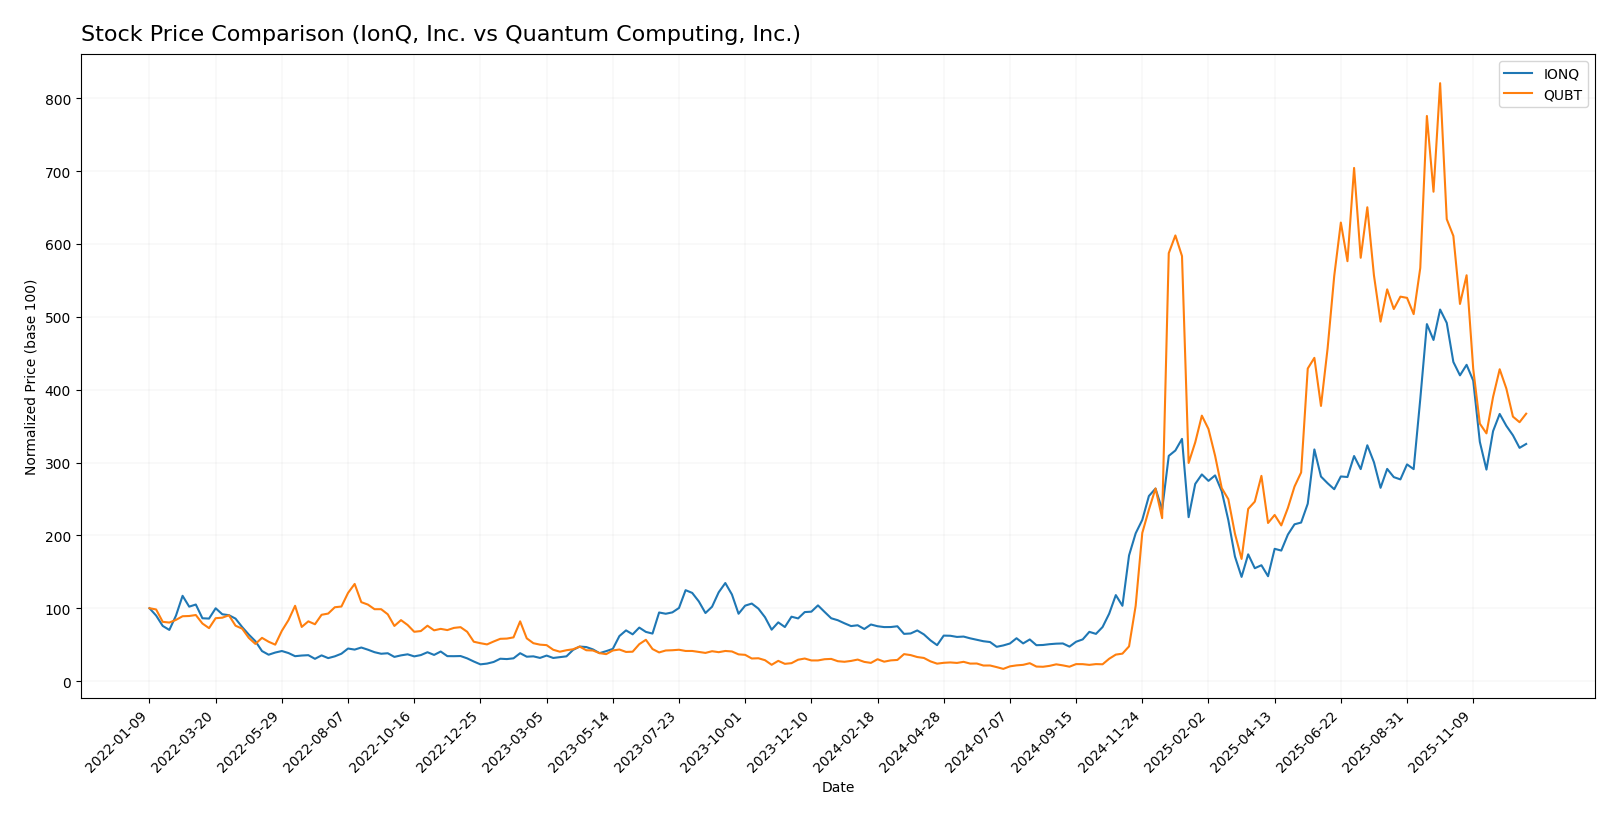
Trend Analysis
IonQ, Inc. exhibited a bullish trend with a 319.09% price increase over the past year, though recent months show a 25.69% decline and deceleration in momentum despite increased trading volume.
Quantum Computing, Inc. posted a more pronounced bullish trend with a 1369.18% rise over the past year, followed by a sharper recent 39.93% drop, alongside decelerating acceleration and moderate volatility.
Comparatively, Quantum Computing, Inc. delivered the highest market performance over the period, outperforming IonQ, Inc. in total price appreciation despite both stocks encountering recent selling pressure.
Target Prices
Here is the consensus target price overview for IonQ, Inc. and Quantum Computing, Inc. based on verified analyst estimates.
| Company | Target High | Target Low | Consensus |
|---|---|---|---|
| IonQ, Inc. | 100 | 55 | 72.57 |
| Quantum Computing, Inc. | 40 | 10 | 19.5 |
Analysts expect IonQ’s price to rise significantly above the current $46.77, with consensus near $72.57, indicating strong growth potential. Quantum Computing shows a moderate upside from $11.01 to a consensus target of $19.5, reflecting cautious optimism.
Analyst Opinions Comparison
This section compares analysts’ ratings and financial scores for IonQ, Inc. and Quantum Computing, Inc.:
Rating Comparison
IONQ Rating
- Rating: C-, considered very favorable overall by analysts.
- Discounted Cash Flow Score: 1, very unfavorable, indicating weak cash flow value.
- ROE Score: 1, very unfavorable, showing low efficiency in generating equity returns.
- ROA Score: 1, very unfavorable, reflecting poor asset utilization.
- Debt To Equity Score: 4, favorable, indicating relatively lower financial risk.
- Overall Score: 1, very unfavorable, reflecting weak overall financial health.
QUBT Rating
- Rating: C+, also very favorable overall but slightly higher than IONQ.
- Discounted Cash Flow Score: 2, moderate, suggesting better valuation than IONQ.
- ROE Score: 1, very unfavorable, same low efficiency as IONQ.
- ROA Score: 1, very unfavorable, similar poor asset use as IONQ.
- Debt To Equity Score: 5, very favorable, showing even stronger balance sheet.
- Overall Score: 2, moderate, better financial health compared to IONQ.
Which one is the best rated?
Based strictly on the provided data, QUBT holds a higher rating (C+) with moderate overall and discounted cash flow scores, plus a very favorable debt to equity score. IONQ rates lower (C-) with mostly very unfavorable scores except for debt to equity.
Scores Comparison
The scores comparison between IonQ and Quantum Computing highlights their financial health and bankruptcy risk:
IonQ Scores
- Altman Z-Score of 3.59 places IonQ in the safe zone, indicating low bankruptcy risk.
- Piotroski Score of 2 reflects very weak financial strength for IonQ.
Quantum Computing Scores
- Altman Z-Score of 50.17 places Quantum Computing in the safe zone, showing very low bankruptcy risk.
- Piotroski Score of 4 indicates average financial strength for Quantum Computing.
Which company has the best scores?
Quantum Computing has a significantly higher Altman Z-Score and a better Piotroski Score compared to IonQ. Based purely on these scores, Quantum Computing demonstrates stronger financial health and lower bankruptcy risk.
Grades Comparison
Here is the comparison of recent reliable grades from recognized grading companies for IonQ, Inc. and Quantum Computing, Inc.:
IonQ, Inc. Grades
The table below summarizes IonQ’s recent grades from established financial firms:
| Grading Company | Action | New Grade | Date |
|---|---|---|---|
| Benchmark | Buy | Buy | 2024-08-12 |
| Goldman Sachs | Hold | Neutral | 2024-08-09 |
| Craig-Hallum | Buy | Buy | 2024-08-08 |
| Needham | Buy | Buy | 2024-05-16 |
| Needham | Buy | Buy | 2024-05-09 |
| Goldman Sachs | Hold | Neutral | 2024-02-29 |
| Needham | Buy | Buy | 2024-02-29 |
| Morgan Stanley | Hold | Equal Weight | 2023-10-30 |
| Needham | Buy | Buy | 2023-09-20 |
| Needham | Buy | Buy | 2023-09-19 |
IonQ’s grades show a consistent pattern of Buy recommendations, with some Hold and Equal Weight ratings from major firms.
Quantum Computing, Inc. Grades
The table below summarizes Quantum Computing’s recent grades from recognized grading companies:
| Grading Company | Action | New Grade | Date |
|---|---|---|---|
| Ascendiant Capital | Buy | Buy | 2025-12-22 |
| Cantor Fitzgerald | Hold | Neutral | 2025-12-18 |
| Lake Street | Buy | Buy | 2025-11-17 |
| Ascendiant Capital | Buy | Buy | 2025-10-03 |
| Ascendiant Capital | Buy | Buy | 2025-06-06 |
| Ascendiant Capital | Buy | Buy | 2025-04-28 |
| Ascendiant Capital | Buy | Buy | 2024-11-13 |
| Ascendiant Capital | Buy | Buy | 2023-11-24 |
Quantum Computing’s ratings predominantly reflect Buy recommendations, with a single Neutral rating from Cantor Fitzgerald.
Which company has the best grades?
Both IonQ, Inc. and Quantum Computing, Inc. receive mostly Buy ratings, indicating positive analyst sentiment. Quantum Computing shows a slightly more uniform Buy trend with fewer Hold or Neutral ratings, which may suggest steadier analyst confidence. Investors may interpret the consistent Buy grades as a sign of favorable outlooks, but should also consider other financial and market factors.
Strengths and Weaknesses
The table below summarizes the key strengths and weaknesses of IonQ, Inc. and Quantum Computing, Inc. based on the most recent financial and operational data.
| Criterion | IonQ, Inc. (IONQ) | Quantum Computing, Inc. (QUBT) |
|---|---|---|
| Diversification | Limited product range, focused on quantum computing hardware | Primarily services segment with limited diversification |
| Profitability | Negative net margin (-770%), declining ROIC, value destroying | Negative net margin (-18,376%), improving ROIC, still value destroying |
| Innovation | High R&D focus but profitability challenges | Growing ROIC indicates increasing innovation effectiveness |
| Global presence | Emerging global footprint, early-stage commercialization | Limited global reach, service-oriented model |
| Market Share | Small share in nascent quantum computing market | Very small market presence, early development stage |
Key takeaways: Both companies operate in the emerging quantum computing sector with significant challenges in profitability and market presence. IonQ shows declining profitability while Quantum Computing, Inc. demonstrates improving ROIC trends, signaling potential growth despite current value destruction. Investors should monitor innovation progress and financial improvements closely.
Risk Analysis
Below is a comparative table summarizing key risks for IonQ, Inc. and Quantum Computing, Inc. based on the most recent data from 2024.
| Metric | IonQ, Inc. (IONQ) | Quantum Computing, Inc. (QUBT) |
|---|---|---|
| Market Risk | High beta 2.62, volatile range $17.88-$84.64 | Very high beta 3.80, volatile range $4.37-$25.84 |
| Debt level | Low debt-to-equity 0.05, favorable leverage | Very low debt-to-equity 0.01, very favorable leverage |
| Regulatory Risk | Moderate, US-based tech with emerging quantum tech regulations | Moderate, similar US tech sector exposure |
| Operational Risk | Medium, 407 employees but negative margins and ROE | High, only 41 employees, very negative margins and ROE |
| Environmental Risk | Low, primarily software/hardware tech company | Low, primarily software solutions |
| Geopolitical Risk | Moderate, US operations with cloud partnerships | Moderate, US focus with government and commercial clients |
Both companies face significant operational risks due to sustained negative profitability and returns on equity, with Quantum Computing, Inc. showing more severe losses and smaller scale. Market risk is elevated for both due to high beta values indicating price volatility. Debt levels are low and well-managed, which reduces financial risk. The most impactful risks are operational inefficiencies and market volatility, which could affect future growth and investment returns.
Which Stock to Choose?
IonQ, Inc. shows a strong revenue growth of 95% in 2024 but suffers from unfavorable profitability and income quality metrics. Its financial ratios reveal a low debt level and a favorable quick ratio, yet overall, its global financial ratios and income statement remain unfavorable. The company’s rating is very favorable in letter grade but poor in detailed financial scores, and its MOAT evaluation indicates significant value destruction with declining profitability.
Quantum Computing, Inc. experienced modest revenue growth of 4% in 2024 with unfavorable profitability and income quality indicators. Its financial ratios present low debt and a favorable quick ratio, but most metrics are unfavorable overall. The rating is slightly better than IonQ’s with a C+ and moderate scores in valuation, while its MOAT shows value destruction as well, though profitability trends are improving.
For risk-tolerant investors seeking exposure to quantum computing growth potential, Quantum Computing’s improving ROIC trend and moderate rating may appear more attractive. Conversely, investors prioritizing strong liquidity and a clearer capital structure might see IonQ’s financial stability and very favorable rating as preferable, despite its value destruction signals.
Disclaimer: Investment carries a risk of loss of initial capital. The past performance is not a reliable indicator of future results. Be sure to understand risks before making an investment decision.
Go Further
I encourage you to read the complete analyses of IonQ, Inc. and Quantum Computing, Inc. to enhance your investment decisions: