NetApp, Inc. and IonQ, Inc. both operate in the computer hardware industry but represent very different technological frontiers. NetApp is a well-established leader in cloud-led data management and storage solutions, while IonQ pioneers the emerging field of quantum computing systems. Comparing these companies reveals contrasting innovation strategies and market positions. In this article, I will help you determine which company holds the most investment potential in 2026.
Table of contents
Companies Overview
I will begin the comparison between NetApp and IonQ by providing an overview of these two companies and their main differences.
NetApp Overview
NetApp, Inc. is a technology company specializing in cloud-led and data-centric services to manage and share data across on-premises and cloud environments. It operates mainly in two segments: Hybrid Cloud and Public Cloud. NetApp offers intelligent data management software and storage infrastructure solutions, serving diverse sectors including finance, healthcare, government, and technology, with a workforce of 11,800 employees headquartered in San Jose, California.
IonQ Overview
IonQ, Inc. focuses on developing general-purpose quantum computing systems and provides cloud-based access to quantum computers with 20 qubits. The company distributes its quantum computing services via platforms such as AWS, Microsoft Azure, and Google Cloud, alongside its proprietary cloud service. Founded in 2015, IonQ has 407 employees and is headquartered in College Park, Maryland, positioning itself as an innovator in the emerging quantum computing industry.
Key similarities and differences
Both NetApp and IonQ operate within the technology sector and focus on advanced computing hardware. However, NetApp emphasizes data management and cloud storage solutions with a broad market presence and established customer base, while IonQ is concentrated on quantum computing technology, a niche and highly specialized field. The companies differ significantly in scale, workforce size, and their respective roles in traditional versus cutting-edge computing technologies.
Income Statement Comparison
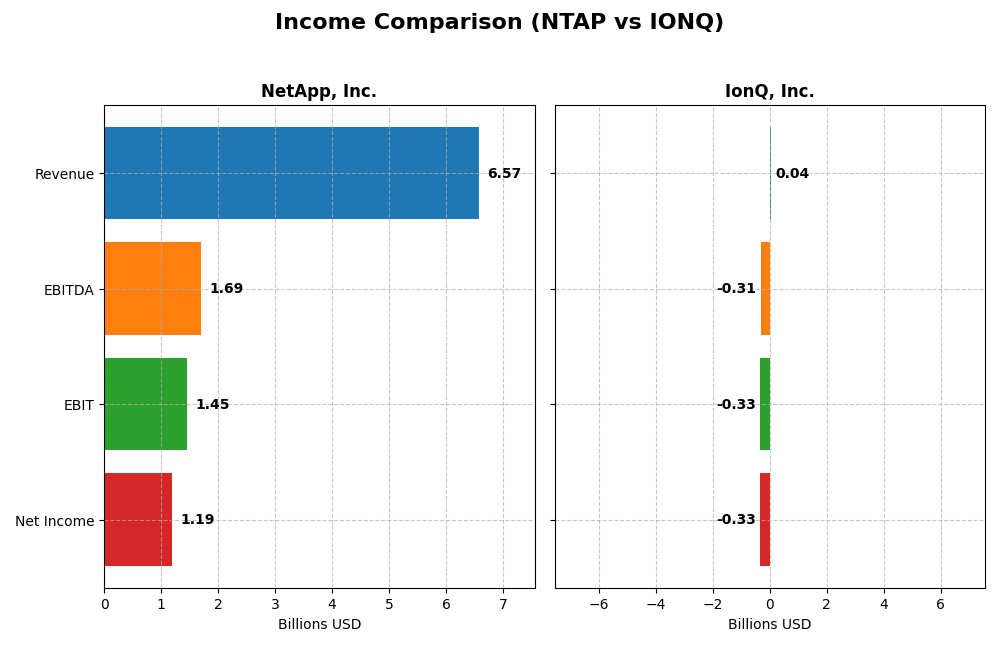
The table below summarizes the key income statement metrics for NetApp, Inc. and IonQ, Inc. based on their most recent fiscal year data, providing a clear snapshot of their financial performance.
| Metric | NetApp, Inc. (NTAP) | IonQ, Inc. (IONQ) |
|---|---|---|
| Market Cap | 21.4B | 17.3B |
| Revenue | 6.57B | 43.1M |
| EBITDA | 1.69B | -313M |
| EBIT | 1.45B | -332M |
| Net Income | 1.19B | -332M |
| EPS | 5.81 | -1.56 |
| Fiscal Year | 2025 | 2024 |
Income Statement Interpretations
NetApp, Inc.
NetApp’s revenue showed steady growth from $5.74B in 2021 to $6.57B in 2025, with net income rising from $730M to $1.19B. Margins were stable and favorable, highlighted by a gross margin of 70.19% and a net margin of 18.05% in 2025. The latest year saw moderate revenue growth of 4.85% and a strong 22.46% EPS increase, signaling improved profitability.
IonQ, Inc.
IonQ’s revenue increased sharply from $2.1M in 2021 to $43.1M in 2024, but net losses widened from -$106M to -$332M. Margins remain unfavorable, with a negative net margin near -770% in 2024, despite a gross margin at 8.87%. The most recent year showed a 95.41% revenue jump but a steep decline in EPS and EBIT, reflecting continued operational challenges.
Which one has the stronger fundamentals?
NetApp exhibits stronger fundamentals with consistent revenue and net income growth, solid margins, and favorable income statement trends. IonQ’s financials reveal rapid revenue expansion but substantial and growing losses, poor margins, and negative profitability indicators. Thus, NetApp’s stable profitability contrasts with IonQ’s ongoing financial deficits.
Financial Ratios Comparison
The following table presents a side-by-side comparison of key financial ratios for NetApp, Inc. (NTAP) and IonQ, Inc. (IONQ) based on their most recent fiscal year data.
| Ratios | NetApp, Inc. (NTAP) 2025 | IonQ, Inc. (IONQ) 2024 |
|---|---|---|
| ROE | 114.0% | -86.4% |
| ROIC | 16.5% | -48.6% |
| P/E | 15.4 | -26.8 |
| P/B | 17.6 | 23.2 |
| Current Ratio | 1.26 | 10.5 |
| Quick Ratio | 1.22 | 10.0 |
| D/E (Debt-to-Equity) | 3.36 | 0.05 |
| Debt-to-Assets | 32.3% | 3.5% |
| Interest Coverage | 20.9 | 0 |
| Asset Turnover | 0.61 | 0.08 |
| Fixed Asset Turnover | 8.17 | 0.69 |
| Payout Ratio | 35.8% | 0% |
| Dividend Yield | 2.32% | 0% |
Interpretation of the Ratios
NetApp, Inc.
NetApp exhibits generally strong financial ratios, with favorable net margin (18.05%), ROE (114.04%), and ROIC (16.49%), indicating efficient profitability and capital use. Some concerns arise from an unfavorable price-to-book ratio (17.6) and debt-to-equity ratio (3.36). The company pays dividends with a 2.32% yield, supported by stable payout coverage, signaling consistent shareholder returns.
IonQ, Inc.
IonQ shows mostly weak ratios; it reports negative net margin (-769.96%), ROE (-86.4%), and ROIC (-48.55%), reflecting ongoing losses and operational challenges. Its current ratio is high but marked unfavorable, likely due to low asset turnover (0.08). IonQ does not pay dividends, focusing on reinvestment and R&D in its growth phase, which explains the absence of shareholder payouts.
Which one has the best ratios?
NetApp clearly presents more favorable financial ratios overall, with half of its key metrics rated positively and a slightly favorable global opinion. IonQ’s ratios are largely unfavorable, reflecting financial stress and early-stage investment priorities. Based on these evaluations, NetApp holds the stronger ratio profile between the two companies.
Strategic Positioning
This section compares the strategic positioning of NetApp, Inc. and IonQ, Inc. regarding Market position, Key segments, and Exposure to technological disruption:
NetApp, Inc.
- Established player in computer hardware, facing moderate competitive pressure.
- Focused on hybrid and public cloud data management services; key revenue driver is hybrid cloud at $5.9B in 2025.
- Operates in mature cloud and storage tech with incremental innovation; moderate disruption risk.
IonQ, Inc.
- Emerging quantum computing developer, facing high competitive pressure.
- Sole focus on quantum computing systems with cloud access platforms; no reported revenue segmentation.
- Operates in nascent quantum tech, highly exposed to technological disruption and innovation shifts.
NetApp, Inc. vs IonQ, Inc. Positioning
NetApp pursues a diversified approach through hybrid and public cloud segments, benefiting from scale and established markets. IonQ concentrates solely on quantum computing, a high-risk, high-innovation area with uncertain revenue streams and smaller scale.
Which has the best competitive advantage?
NetApp demonstrates a very favorable moat with growing ROIC above WACC, indicating durable competitive advantage and value creation. IonQ shows a very unfavorable moat with declining ROIC below WACC, reflecting value destruction and competitive challenges.
Stock Comparison
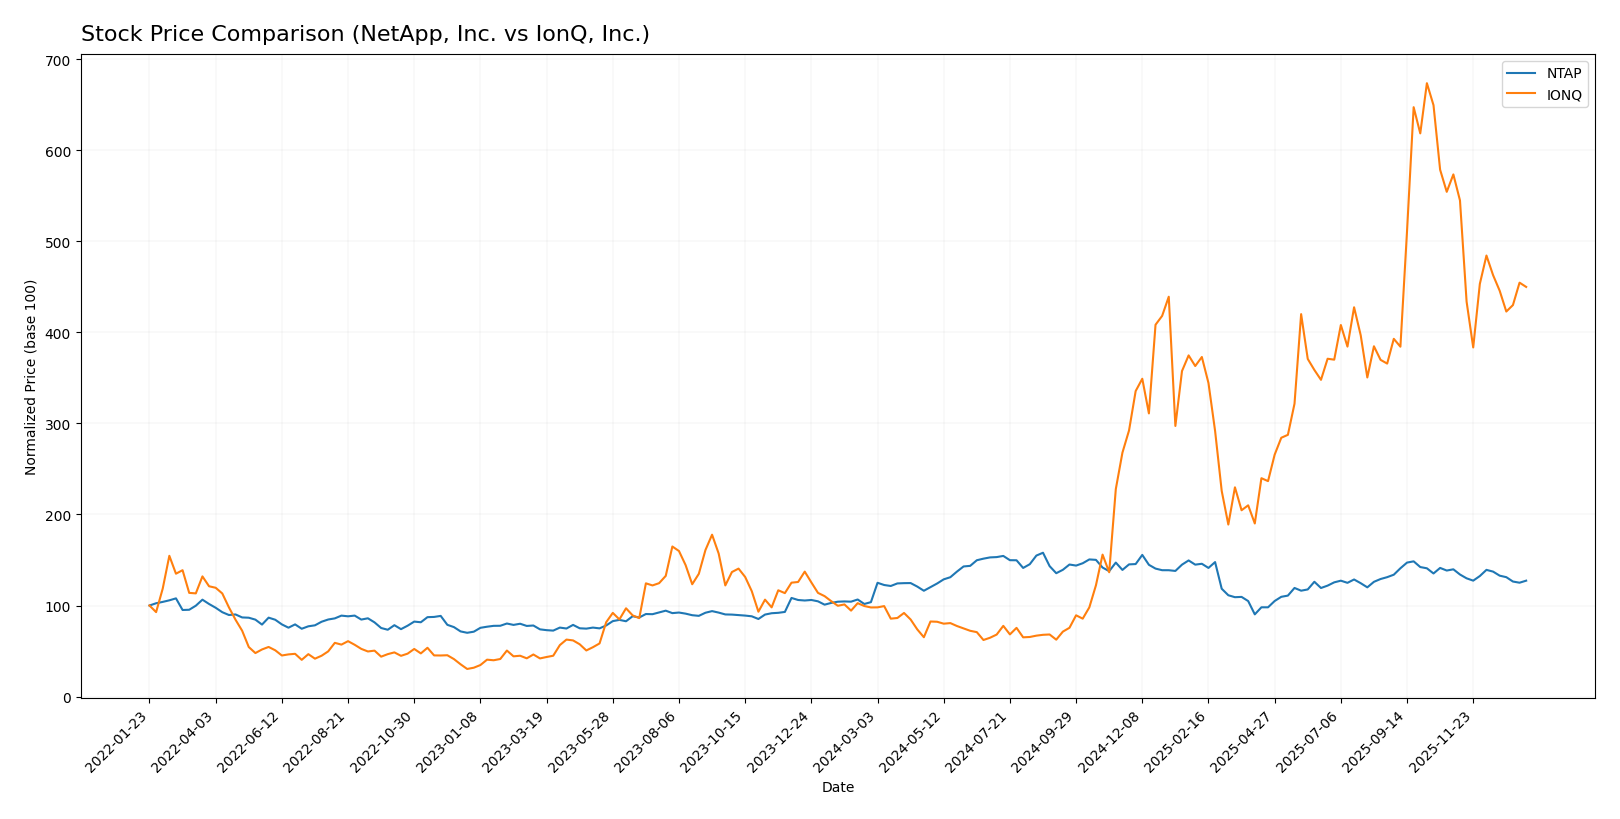
The stock price movements of NetApp, Inc. (NTAP) and IonQ, Inc. (IONQ) over the past 12 months reveal significant bullish trends with notable deceleration phases and recent downward adjustments in both equities.
Trend Analysis
NetApp, Inc. experienced a bullish trend over the past year with a 22.75% price increase. The trend shows deceleration and a high volatility level, with prices ranging from 76.1 to 133.12. However, a recent decline of 8.91% indicates a short-term bearish adjustment.
IonQ, Inc. demonstrated a strong bullish trend with a remarkable 359.53% gain over the same period. Despite high volatility and deceleration in trend acceleration, the stock recently fell by 21.55%, reflecting a pronounced short-term downtrend.
Comparing both stocks, IonQ delivered the highest market performance over the last year, outperforming NetApp significantly despite recent bearish corrections in both companies.
Target Prices
Analysts present a clear consensus on target prices for NetApp, Inc. and IonQ, Inc., reflecting optimistic expectations.
| Company | Target High | Target Low | Consensus |
|---|---|---|---|
| NetApp, Inc. | 137 | 115 | 125.17 |
| IonQ, Inc. | 100 | 55 | 72.57 |
The consensus targets for both companies are above their current prices, suggesting expected upside: NetApp’s target consensus is about 17% higher than its $107.28 price, while IonQ’s consensus target is roughly 48% above its current $48.94 level.
Analyst Opinions Comparison
This section compares analysts’ ratings and grades for NetApp, Inc. and IonQ, Inc.:
Rating Comparison
NetApp, Inc. Rating
- Rating: B+ indicating a very favorable overall rating.
- Discounted Cash Flow Score: 4, assessed as favorable for valuation.
- ROE Score: 5, very favorable, showing strong profit generation.
- ROA Score: 5, very favorable, reflecting effective asset utilization.
- Debt To Equity Score: 1, very unfavorable, implying high financial risk.
- Overall Score: 3, moderate overall performance.
IonQ, Inc. Rating
- Rating: C- indicating a very unfavorable overall rating.
- Discounted Cash Flow Score: 1, considered very unfavorable.
- ROE Score: 1, very unfavorable, indicating weak equity returns.
- ROA Score: 1, very unfavorable, showing poor asset efficiency.
- Debt To Equity Score: 4, favorable, indicating lower financial risk.
- Overall Score: 1, very unfavorable overall performance.
Which one is the best rated?
Based on the provided data, NetApp, Inc. is better rated overall with a B+ rating and favorable scores in DCF, ROE, and ROA, despite a weak debt-to-equity score. IonQ, Inc. shows very unfavorable ratings and scores except for a favorable debt-to-equity score.
Scores Comparison
Here is a comparison of the Altman Z-Score and Piotroski Score for NetApp, Inc. and IonQ, Inc.:
NetApp, Inc. Scores
- Altman Z-Score: 2.86, in the grey zone, indicating moderate bankruptcy risk.
- Piotroski Score: 7, considered strong financial health.
IonQ, Inc. Scores
- Altman Z-Score: 3.67, in the safe zone, indicating low bankruptcy risk.
- Piotroski Score: 2, considered very weak financial health.
Which company has the best scores?
IonQ has a higher Altman Z-Score indicating lower bankruptcy risk, while NetApp has a much stronger Piotroski Score reflecting better financial health. The scores differ significantly depending on the metric considered.
Grades Comparison
The following is a comparison of the latest available grades from recognized grading companies for NetApp, Inc. and IonQ, Inc.:
NetApp, Inc. Grades
This table summarizes recent analyst grades and rating actions for NetApp, Inc.
| Grading Company | Action | New Grade | Date |
|---|---|---|---|
| Barclays | Maintain | Overweight | 2025-11-26 |
| Wells Fargo | Maintain | Equal Weight | 2025-11-26 |
| Northland Capital Markets | Upgrade | Outperform | 2025-11-26 |
| B of A Securities | Maintain | Neutral | 2025-11-26 |
| UBS | Maintain | Neutral | 2025-11-26 |
| Citigroup | Maintain | Neutral | 2025-11-12 |
| Citigroup | Maintain | Neutral | 2025-10-16 |
| Argus Research | Maintain | Buy | 2025-08-29 |
| UBS | Maintain | Neutral | 2025-08-28 |
| Barclays | Maintain | Overweight | 2025-08-28 |
NetApp’s grades show a predominance of neutral to overweight ratings, with a recent upgrade to outperform, reflecting moderate positive sentiment among analysts.
IonQ, Inc. Grades
This table displays recent analyst grades and rating actions for IonQ, Inc.
| Grading Company | Action | New Grade | Date |
|---|---|---|---|
| Benchmark | Maintain | Buy | 2024-08-12 |
| Goldman Sachs | Maintain | Neutral | 2024-08-09 |
| Craig-Hallum | Maintain | Buy | 2024-08-08 |
| Needham | Maintain | Buy | 2024-05-16 |
| Needham | Maintain | Buy | 2024-05-09 |
| Goldman Sachs | Maintain | Neutral | 2024-02-29 |
| Needham | Maintain | Buy | 2024-02-29 |
| Morgan Stanley | Maintain | Equal Weight | 2023-10-30 |
| Needham | Maintain | Buy | 2023-09-20 |
| Needham | Maintain | Buy | 2023-09-19 |
IonQ’s ratings are mostly “Buy” with a few neutral or equal weight assessments, indicating a generally optimistic outlook from analysts.
Which company has the best grades?
IonQ, Inc. has received predominantly “Buy” ratings, whereas NetApp, Inc.’s consensus leans toward “Hold” with some upgrades to “Outperform.” This suggests IonQ currently enjoys more favorable analyst sentiment, which could influence investor confidence and portfolio decisions differently based on risk tolerance and growth expectations.
Strengths and Weaknesses
Below is a comparative summary of key strengths and weaknesses for NetApp, Inc. (NTAP) and IonQ, Inc. (IONQ) based on the most recent financial and operational data.
| Criterion | NetApp, Inc. (NTAP) | IonQ, Inc. (IONQ) |
|---|---|---|
| Diversification | Strong hybrid and public cloud revenue streams (5.9B and 665M in 2025) | Limited diversification; focuses on quantum computing technology only |
| Profitability | High profitability: net margin 18%, ROIC 16.5%, ROE 114% | Negative profitability: net margin -770%, ROIC -48.6%, ROE -86.4% |
| Innovation | Established in cloud storage innovation with solid product and service offerings | Emerging technology leader but still unprofitable with declining returns |
| Global presence | Well-established global footprint in cloud infrastructure | Limited global presence; early-stage market penetration |
| Market Share | Significant market share in hybrid cloud storage | Minimal market share in quantum computing, highly competitive space |
NetApp shows a durable competitive advantage with growing profitability and diversified revenue. IonQ, while innovative, faces high risks due to negative returns and value destruction, highlighting the need for cautious investment consideration.
Risk Analysis
Below is a comparative table of key risks for NetApp, Inc. (NTAP) and IonQ, Inc. (IONQ) based on the most recent data available:
| Metric | NetApp, Inc. (NTAP) | IonQ, Inc. (IONQ) |
|---|---|---|
| Market Risk | Beta 1.37, moderate volatility typical of tech hardware | Beta 2.63, high volatility reflecting early-stage quantum tech |
| Debt Level | Debt-to-Equity 3.36, relatively high leverage (unfavorable) | Debt-to-Equity 0.05, very low financial leverage (favorable) |
| Regulatory Risk | Moderate, subject to data management and cloud regulations | Moderate to high, quantum computing is emerging and evolving regulatory area |
| Operational Risk | Medium, established operations with diverse product lines | High, nascent technology and limited scale with 407 employees |
| Environmental Risk | Moderate, data centers and hardware production impact | Low, less resource-intensive operations |
| Geopolitical Risk | Moderate, global supply chain dependencies | Moderate, reliance on US and global cloud partnerships |
NetApp shows higher financial leverage and moderate market risk but benefits from established operations and favorable profitability metrics. IonQ faces significant operational and market volatility risks due to its early-stage quantum computing focus and poor profitability, despite low debt levels. Investors should weigh IonQ’s high growth potential against these elevated risks.
Which Stock to Choose?
NetApp, Inc. (NTAP) shows steady income growth with favorable profitability metrics, including an 18.05% net margin and strong returns on equity (114%) and invested capital (16.49%). Its debt level is moderate, and its overall rating is very favorable.
IonQ, Inc. (IONQ) exhibits rapid revenue growth but suffers from significant losses, reflected in a negative net margin of -770% and declining returns on equity (-86%) and invested capital (-49%). The company maintains low debt, yet its overall rating is very unfavorable.
Investors prioritizing stability and consistent profitability might find NetApp’s strong financial ratios and positive rating more reassuring, while those with a higher risk tolerance focused on growth potential could view IonQ’s rapid revenue expansion as a speculative opportunity despite its unfavorable financial metrics.
Disclaimer: Investment carries a risk of loss of initial capital. The past performance is not a reliable indicator of future results. Be sure to understand risks before making an investment decision.
Go Further
I encourage you to read the complete analyses of NetApp, Inc. and IonQ, Inc. to enhance your investment decisions: