Quantum computing is rapidly transforming the technology landscape, and two leading players in this field are IonQ, Inc. and D-Wave Quantum Inc. Both companies develop cutting-edge quantum hardware and provide cloud-based access to their systems, targeting overlapping markets in industries like AI, materials science, and finance. This article will dissect their strategies and innovations to reveal which company presents the most compelling investment opportunity for you.
Table of contents
Companies Overview
I will begin the comparison between IonQ and D-Wave Quantum by providing an overview of these two companies and their main differences.
IonQ Overview
IonQ, Inc. focuses on developing general-purpose quantum computing systems and offers access to quantum computers with 20 qubits. It provides cloud-based access through platforms like AWS, Microsoft Azure, and Google Cloud, as well as its own service. Founded in 2015 and based in College Park, Maryland, IonQ operates in the technology sector with a market cap of approximately 16.6B USD.
D-Wave Overview
D-Wave Quantum Inc. develops and delivers quantum computing systems, software, and services globally. Its offerings include the Advantage quantum computer, cloud access via Leap, and professional services like D-Wave Launch. Serving diverse industries such as AI and financial services, D-Wave is headquartered in Burnaby, Canada, employs 216 people, and has a market cap near 9.7B USD.
Key similarities and differences
Both companies operate in the computer hardware industry within the technology sector, focusing on quantum computing systems and cloud-based access. IonQ emphasizes general-purpose quantum computing with 20 qubits, while D-Wave provides specialized quantum annealing systems and a broader suite of software and professional services. IonQ has a larger market capitalization and workforce compared to D-Wave.
Income Statement Comparison
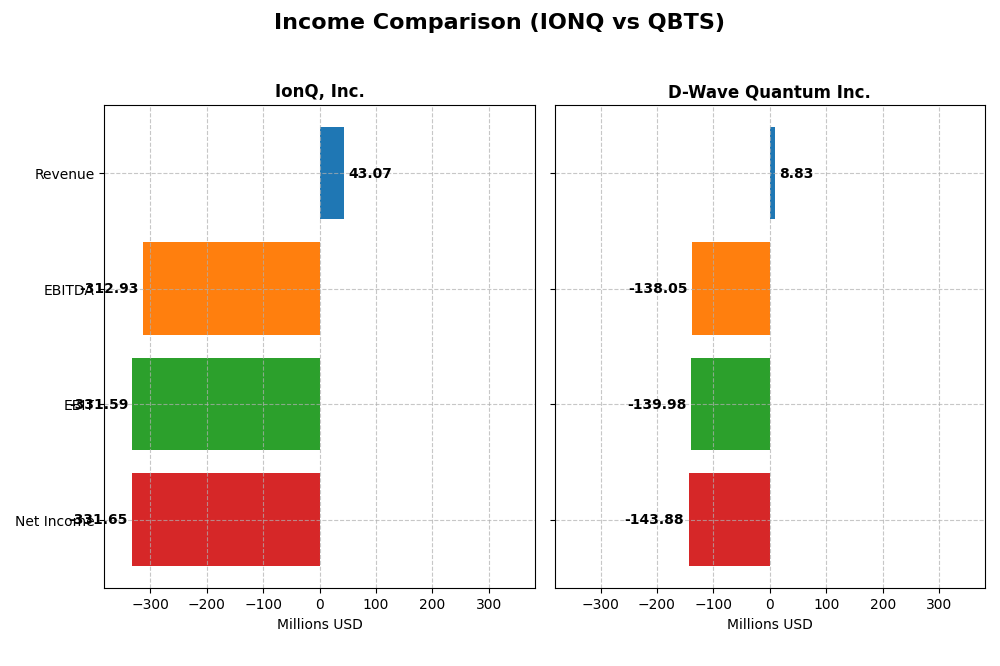
The table below compares the key income statement metrics for IonQ, Inc. and D-Wave Quantum Inc. for the fiscal year 2024, highlighting their financial performance in the quantum computing hardware sector.
| Metric | IonQ, Inc. | D-Wave Quantum Inc. |
|---|---|---|
| Market Cap | 16.6B | 9.7B |
| Revenue | 43.1M | 8.8M |
| EBITDA | -313.0M | -138.1M |
| EBIT | -331.6M | -140.0M |
| Net Income | -331.6M | -143.9M |
| EPS | -1.56 | -0.75 |
| Fiscal Year | 2024 | 2024 |
Income Statement Interpretations
IonQ, Inc.
IonQ’s revenue increased substantially from 2023 to 2024, nearly doubling to $43M, yet gross profit dropped by 73%, indicating margin pressure. Despite favorable revenue growth and stable interest expense, operating and net margins remained deeply negative, with net income loss widening to -$332M in 2024. The company’s profitability deteriorated sharply, reflecting intensified operating expenses.
D-Wave Quantum Inc.
D-Wave Quantum’s revenue showed marginal growth of 0.8% in 2024, reaching $8.8M, while gross profit improved by 20%. However, the company faced significant challenges with very negative EBIT and net margins, and its net income loss increased to -$144M. Although gross margin is favorable at 63%, high interest expense and operating losses weigh heavily on overall profitability.
Which one has the stronger fundamentals?
Both companies exhibit unfavorable overall income statement evaluations, with significant net losses and negative margins. IonQ boasts stronger revenue growth but suffers from steep margin declines and widening net losses. D-Wave maintains a healthier gross margin but faces high interest costs and persistent operating losses. Neither shows sustainable profitability, reflecting considerable fundamental risks.
Financial Ratios Comparison
Below is a comparison of key financial ratios for IonQ, Inc. and D-Wave Quantum Inc. as of fiscal year 2024, providing insights into profitability, liquidity, leverage, and market valuation.
| Ratios | IonQ, Inc. (IONQ) | D-Wave Quantum Inc. (QBTS) |
|---|---|---|
| ROE | -86.4% | -229.7% |
| ROIC | -48.2% | -45.0% |
| P/E | -26.8 | -11.2 |
| P/B | 23.2 | 25.8 |
| Current Ratio | 10.5 | 6.14 |
| Quick Ratio | 10.0 | 6.08 |
| D/E | 0.046 | 0.613 |
| Debt-to-Assets | 3.49% | 19.2% |
| Interest Coverage | 0 | -19.8 |
| Asset Turnover | 0.085 | 0.044 |
| Fixed Asset Turnover | 0.69 | 0.77 |
| Payout ratio | 0 | 0 |
| Dividend yield | 0 | 0 |
Interpretation of the Ratios
IonQ, Inc.
IonQ exhibits mostly unfavorable financial ratios, including a highly negative net margin of -770% and a return on equity at -86.4%, indicating significant profitability challenges. The company’s current ratio is high at 10.5 but marked unfavorable, suggesting excess liquidity that may not be efficiently used. IonQ does not pay dividends, reflecting its reinvestment strategy and growth phase focus in quantum computing.
D-Wave Quantum Inc.
D-Wave Quantum also shows predominantly unfavorable ratios, with an extremely negative net margin of -1630% and a return on equity of -229.7%, revealing deep losses and weak profitability. The current ratio of 6.14, though relatively strong, is still viewed as unfavorable. Like IonQ, D-Wave Quantum does not distribute dividends, prioritizing reinvestment and development in its quantum technologies.
Which one has the best ratios?
Both IonQ and D-Wave Quantum have a majority of unfavorable ratios, indicating profitability and efficiency challenges. IonQ has a slightly higher proportion of favorable ratios at 28.57% compared to D-Wave’s 21.43%, but both companies face considerable financial hurdles. Neither pays dividends, emphasizing their focus on growth and reinvestment over shareholder returns at this stage.
Strategic Positioning
This section compares the strategic positioning of IonQ and D-Wave Quantum Inc. across market position, key segments, and exposure to technological disruption:
IonQ
- Larger market cap at 16.6B USD with higher beta, facing tech sector competition
- Focuses on general-purpose quantum computing systems with 20 qubits via cloud platforms like AWS, Azure, Google
- Provides access to quantum computing primarily through cloud marketplaces and its own cloud service
D-Wave Quantum Inc.
- Smaller market cap at 9.7B USD, moderate beta, competing in quantum computing hardware and services
- Offers quantum hardware, software, professional services, and onboarding, serving diverse industries
- Combines quantum computers with software suites and professional services, supporting AI and financial modeling
IonQ vs D-Wave Quantum Inc. Positioning
IonQ concentrates on cloud-based access to quantum hardware with a singular product focus, while D-Wave pursues a broader approach including software and professional services. IonQ’s positioning emphasizes hardware scale, D-Wave emphasizes diversified offerings but smaller scale.
Which has the best competitive advantage?
Both companies are currently shedding value based on ROIC below WACC. IonQ shows very unfavorable declining profitability, whereas D-Wave has slightly unfavorable status but with improving ROIC, indicating a potentially strengthening competitive position.
Stock Comparison
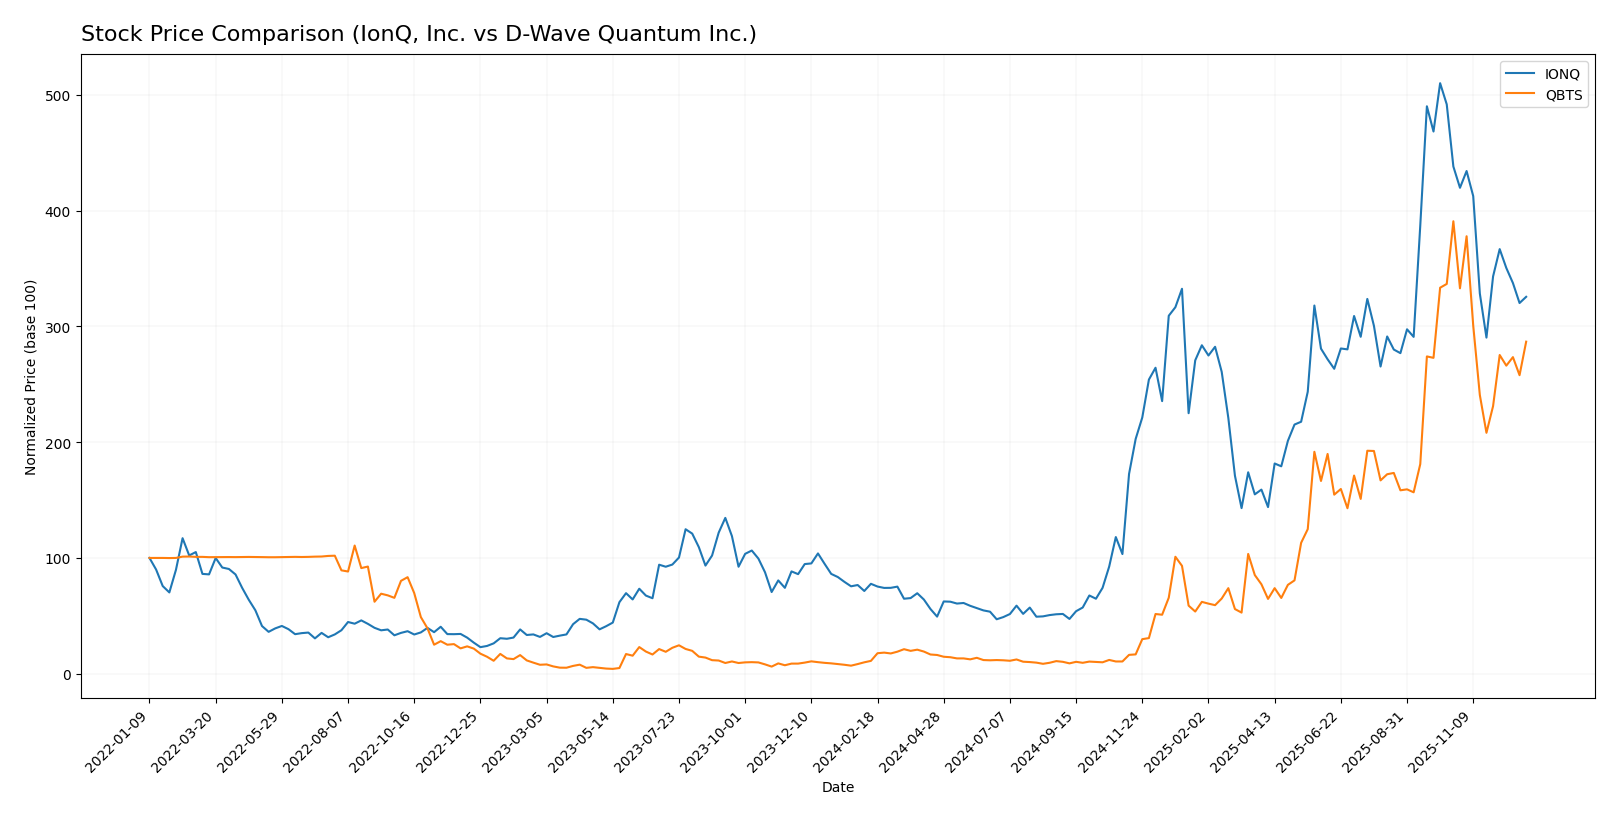
The stock price movements of IonQ, Inc. and D-Wave Quantum Inc. over the past year reveal strong overall gains with recent downward corrections, reflecting dynamic trading patterns and decelerating momentum in both cases.
Trend Analysis
IonQ, Inc. stock shows a bullish trend with a 319.09% increase over the past 12 months, though momentum has decelerated. Recent weeks recorded a 25.69% drop, indicating a short-term bearish correction.
D-Wave Quantum Inc. experienced a robust bullish trend with a 2480.73% gain over the same period, also slowing down recently. The last quarter saw a 26.61% decline, signaling a recent bearish phase.
Comparing both, D-Wave Quantum delivered the highest market performance with a substantially larger overall price increase, despite similar recent downward trends and deceleration in momentum.
Target Prices
The current analyst consensus provides a promising outlook for both IonQ, Inc. and D-Wave Quantum Inc.
| Company | Target High | Target Low | Consensus |
|---|---|---|---|
| IonQ, Inc. | 100 | 55 | 72.57 |
| D-Wave Quantum Inc. | 46 | 26 | 38.88 |
Analysts expect IonQ’s stock to appreciate significantly from the current price of 46.77 USD, while D-Wave’s consensus target is also well above its current 28.12 USD price, indicating positive growth potential in both quantum computing firms.
Analyst Opinions Comparison
This section compares analysts’ ratings and grades for IonQ, Inc. and D-Wave Quantum Inc.:
Rating Comparison
IonQ Rating
- Rating: C- with a very favorable status
- Discounted Cash Flow Score: 1, very unfavorable
- ROE Score: 1, very unfavorable
- ROA Score: 1, very unfavorable
- Debt To Equity Score: 4, favorable
- Overall Score: 1, very unfavorable
D-Wave Quantum Rating
- Rating: C- with a very favorable status
- Discounted Cash Flow Score: 1, very unfavorable
- ROE Score: 1, very unfavorable
- ROA Score: 1, very unfavorable
- Debt To Equity Score: 4, favorable
- Overall Score: 1, very unfavorable
Which one is the best rated?
Both IonQ and D-Wave Quantum share identical ratings and scores across all key financial metrics. Neither company shows a rating or score advantage over the other based on the provided data.
Scores Comparison
The comparison of IonQ and D-Wave Quantum scores is as follows:
IONQ Scores
- Altman Z-Score: 3.59, indicating a safe zone with low bankruptcy risk.
- Piotroski Score: 2, categorized as very weak financial strength.
QBTS Scores
- Altman Z-Score: 28.11, far into the safe zone, indicating very low bankruptcy risk.
- Piotroski Score: 4, considered average financial strength.
Which company has the best scores?
Based on the provided data, QBTS has a substantially higher Altman Z-Score and a better Piotroski Score than IONQ, indicating stronger financial stability and moderate financial strength compared to IONQ’s very weak Piotroski rating.
Grades Comparison
The following presents a comparison of recent grades assigned to IonQ, Inc. and D-Wave Quantum Inc. by recognized grading companies:
IonQ, Inc. Grades
This table displays recent grades from reputable grading companies for IonQ, Inc.:
| Grading Company | Action | New Grade | Date |
|---|---|---|---|
| Benchmark | Maintain | Buy | 2024-08-12 |
| Goldman Sachs | Maintain | Neutral | 2024-08-09 |
| Craig-Hallum | Maintain | Buy | 2024-08-08 |
| Needham | Maintain | Buy | 2024-05-16 |
| Needham | Maintain | Buy | 2024-05-09 |
| Goldman Sachs | Maintain | Neutral | 2024-02-29 |
| Needham | Maintain | Buy | 2024-02-29 |
| Morgan Stanley | Maintain | Equal Weight | 2023-10-30 |
| Needham | Maintain | Buy | 2023-09-20 |
| Needham | Maintain | Buy | 2023-09-19 |
IonQ’s grades predominantly show a “Buy” rating with occasional “Neutral” and “Equal Weight” assessments, indicating overall positive but cautious sentiment.
D-Wave Quantum Inc. Grades
This table displays recent grades from reputable grading companies for D-Wave Quantum Inc.:
| Grading Company | Action | New Grade | Date |
|---|---|---|---|
| Benchmark | Maintain | Buy | 2025-11-10 |
| Rosenblatt | Maintain | Buy | 2025-11-07 |
| Canaccord Genuity | Maintain | Buy | 2025-11-07 |
| Cantor Fitzgerald | Maintain | Overweight | 2025-11-07 |
| B. Riley Securities | Maintain | Buy | 2025-09-22 |
| Piper Sandler | Maintain | Overweight | 2025-08-08 |
| Benchmark | Maintain | Buy | 2025-08-04 |
| B. Riley Securities | Maintain | Buy | 2025-07-23 |
| B. Riley Securities | Maintain | Buy | 2025-06-18 |
| Benchmark | Maintain | Buy | 2025-06-18 |
D-Wave Quantum Inc. consistently receives “Buy” and “Overweight” grades, reflecting strong analyst confidence and a robust positive outlook.
Which company has the best grades?
D-Wave Quantum Inc. holds stronger and more consistent “Buy” and “Overweight” ratings compared to IonQ’s mix of “Buy,” “Neutral,” and “Equal Weight” grades. This suggests D-Wave may be viewed as having a more favorable growth potential by analysts, which can impact investor sentiment and portfolio positioning.
Strengths and Weaknesses
Below is a comparison table highlighting the key strengths and weaknesses of IonQ, Inc. (IONQ) and D-Wave Quantum Inc. (QBTS) based on the most recent financial and strategic data available.
| Criterion | IonQ, Inc. (IONQ) | D-Wave Quantum Inc. (QBTS) |
|---|---|---|
| Diversification | Limited product range; primarily quantum computing hardware | Moderate diversification with professional services and other products |
| Profitability | Very unfavorable; negative margins and declining ROIC; value destroying | Unfavorable; negative margins but improving ROIC trend; slightly unfavorable overall |
| Innovation | Leading in quantum hardware innovation but struggling to monetize effectively | Focus on quantum annealing technology with growing profitability potential |
| Global presence | Smaller international footprint; niche market focus | Expanding presence with increasing service revenues globally |
| Market Share | Early-stage market player with limited share | Slightly larger market share due to service offerings and client base |
Key takeaways: Both companies face significant profitability challenges and are currently value destructive. IonQ shows declining returns and limited diversification, while D-Wave demonstrates improving profitability trends and broader revenue streams, suggesting a cautiously more favorable outlook despite ongoing risks.
Risk Analysis
Below is a comparative risk assessment for IonQ, Inc. (IONQ) and D-Wave Quantum Inc. (QBTS) based on the most recent data from 2024.
| Metric | IonQ, Inc. (IONQ) | D-Wave Quantum Inc. (QBTS) |
|---|---|---|
| Market Risk | High beta (2.617) implies significant price volatility | Moderate beta (1.564), less volatile than IonQ |
| Debt level | Low debt-to-equity (0.05), low debt-to-assets (3.49%) | Moderate debt-to-equity (0.61), debt-to-assets (19.2%) |
| Regulatory Risk | US-based, subject to US tech regulations | Canada-based, exposed to Canadian and US regulations |
| Operational Risk | Negative profitability metrics, low asset turnover | Very negative margins, low asset efficiency |
| Environmental Risk | Minimal direct environmental impact | Minimal direct environmental impact |
| Geopolitical Risk | US-centric operations, stable geopolitical risk | Cross-border exposure between Canada and US markets |
IonQ and D-Wave both face substantial operational and financial risks, reflected in large negative net margins and unfavorable profitability ratios. IonQ’s higher market volatility and D-Wave’s heavier debt load are notable concerns. Both companies remain in a safe zone for bankruptcy risk but show weak financial health scores, emphasizing caution for investors.
Which Stock to Choose?
IonQ, Inc. has shown strong revenue growth of 95.41% in 2024 but suffers from unfavorable profitability with a net margin of -769.96% and declining returns on equity (-86.4%) and invested capital (-48.22%). Its debt level is low, reflected in a favorable debt-to-equity ratio of 0.05, but overall financial ratios and income statement evaluations remain unfavorable with a very unfavorable global rating.
D-Wave Quantum Inc. (QBTS) presents moderate revenue growth of 0.79% in 2024 and a higher gross margin of 63.02%, yet it also struggles with negative net margin (-1629.99%) and poor returns on equity (-229.67%) and invested capital (-45.01%). Debt metrics are mixed, with a neutral debt-to-equity score and a higher debt-to-assets ratio at 19.2%. The global financial ratios and income statement evaluations are similarly unfavorable, despite a slightly improving profitability trend.
Considering their ratings and financial evaluations, IonQ’s low debt and slightly better income growth contrast with QBTS’s improving ROIC trend but higher leverage. Investors focused on growth might see potential in QBTS’s improving profitability, while those prioritizing lower debt and capital preservation could find IonQ’s balance sheet metrics more reassuring. Both companies carry significant financial challenges, suggesting cautious interpretation of their prospects.
Disclaimer: Investment carries a risk of loss of initial capital. The past performance is not a reliable indicator of future results. Be sure to understand risks before making an investment decision.
Go Further
I encourage you to read the complete analyses of IonQ, Inc. and D-Wave Quantum Inc. to enhance your investment decisions: