Home > Comparison > Financial Services > TROW vs IVZ
The strategic rivalry between T. Rowe Price Group, Inc. and Invesco Ltd. shapes the evolution of the asset management sector. T. Rowe Price operates as a fundamental research-driven investment manager with a focus on long-term equity and fixed income funds. Invesco, by contrast, offers a broader product mix, including alternative assets and ETFs using quantitative strategies. This analysis will reveal which firm’s operational model delivers superior risk-adjusted returns for diversified portfolios.
Table of contents
Companies Overview
T. Rowe Price Group and Invesco Ltd. are key players shaping asset management dynamics globally.
T. Rowe Price Group, Inc.: Veteran Investment Manager
T. Rowe Price Group, Inc. stands as a leading investment manager with a strong foothold in mutual funds. Its core revenue derives from managing equity and fixed income portfolios using rigorous fundamental and quantitative analysis. In 2026, the firm’s strategy centers on socially responsible investing and late-stage venture capital, emphasizing environmental, social, and governance factors as competitive advantages.
Invesco Ltd.: Diversified Asset Management Innovator
Invesco Ltd. operates as a diversified asset manager, generating revenue from equity, fixed income, commodity, and multi-asset funds. It employs quantitative strategies across a broad spectrum of public and alternative markets, including long/short and global macro approaches. In 2026, Invesco focuses on client-tailored portfolios and expanding its presence in alternative investments, seeking growth through innovation and multi-asset diversification.
Strategic Collision: Similarities & Divergences
Both firms excel in global asset management but diverge in philosophy and product breadth. T. Rowe Price emphasizes a disciplined, research-driven approach with a sustainable investing focus. Invesco pursues diversification and alternative strategies to capture wider market segments. Their primary battleground is equity and fixed income management, yet their distinct strategic orientations shape unique risk and return profiles for investors.
Income Statement Comparison
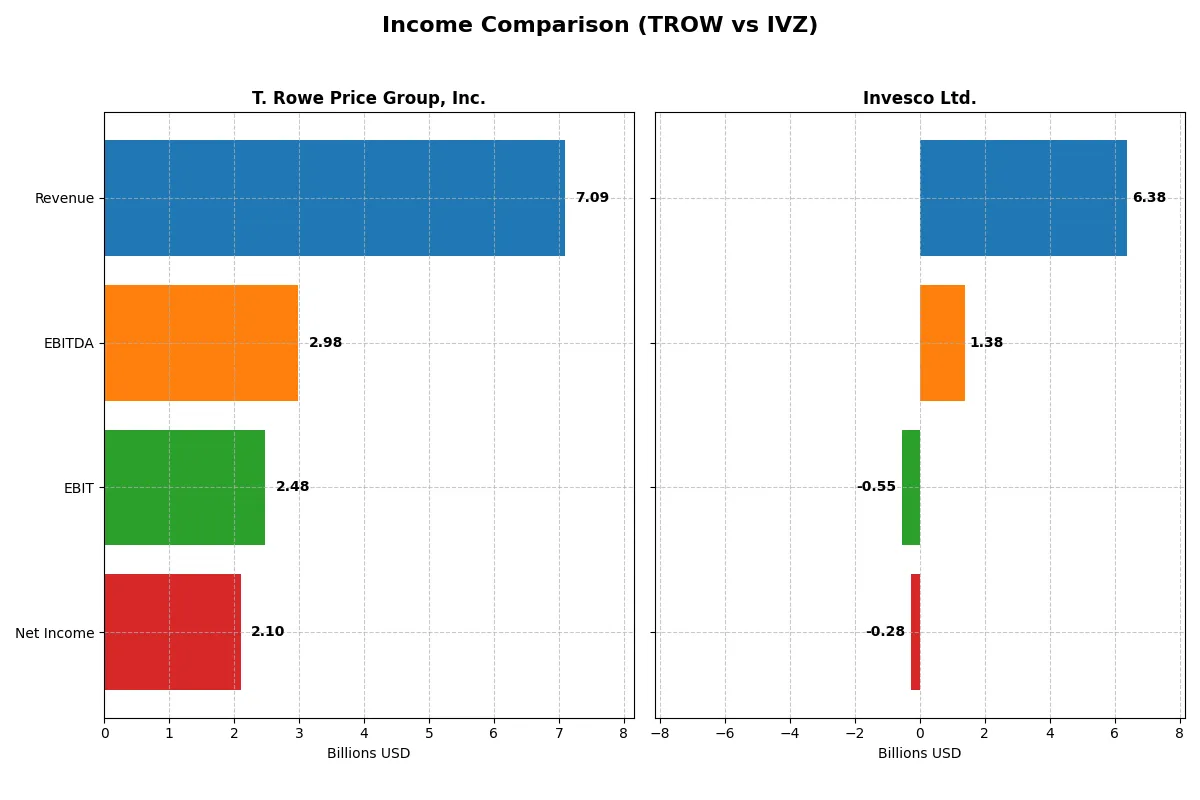
This data dissects the core profitability and scalability of both corporate engines to reveal who dominates the bottom line:
| Metric | T. Rowe Price Group, Inc. (TROW) | Invesco Ltd. (IVZ) |
|---|---|---|
| Revenue | 7.09B | 6.38B |
| Cost of Revenue | 3.41B | 3.62B |
| Operating Expenses | 1.35B | 3.45B |
| Gross Profit | 3.68B | 2.75B |
| EBITDA | 2.98B | 1.38B |
| EBIT | 2.48B | -547M |
| Interest Expense | 0 | 83M |
| Net Income | 2.10B | -282M |
| EPS | 9.18 | -1.61 |
| Fiscal Year | 2024 | 2025 |
Income Statement Analysis: The Bottom-Line Duel
This income statement comparison reveals the true efficiency and profitability of each company’s business model over recent years.
T. Rowe Price Group, Inc. Analysis
T. Rowe Price’s revenue climbed steadily from 6.2B in 2020 to 7.1B in 2024, with net income peaking above 2B in 2024. The firm maintains robust gross (52%) and net margins (30%), signaling strong cost control and pricing power. Its 2024 momentum shows improved efficiency, with EBIT up 22% year-over-year, reflecting operational strength despite rising expenses.
Invesco Ltd. Analysis
Invesco’s revenue showed modest fluctuation, reaching 6.4B in 2025 but with negative net income of -726M that year. Gross margin at 43% is respectable, but EBIT and net margins are negative, indicating operational losses. The 2025 plunge in profitability highlights challenges in expense management and declining earnings, undermining overall income statement health despite a recent gross profit rebound.
Margin Dominance vs. Profitability Struggles
T. Rowe Price outperforms Invesco on every key income metric, boasting solid margin expansion and consistent net income growth. Invesco’s volatile revenue and heavy losses mark a fundamental weakness. For investors prioritizing sustainable profitability and margin resilience, T. Rowe Price’s profile offers a clearer path to value creation.
Financial Ratios Comparison
These vital ratios act as a diagnostic tool to expose the underlying fiscal health, valuation premiums, and capital efficiency of the companies compared below:
| Ratios | T. Rowe Price Group, Inc. (TROW) | Invesco Ltd. (IVZ) |
|---|---|---|
| ROE | 20.3% (2024) | 5.3% (2024) |
| ROIC | 13.6% (2024) | 2.4% (2024) |
| P/E | 12.0x (2024) | 10.3x (2024) |
| P/B | 2.44x (2024) | 0.55x (2024) |
| Current Ratio | 8.01 (2024) | 3.14 (2024) |
| Quick Ratio | 8.01 (2024) | 3.14 (2024) |
| D/E | 2.7% (2024) | 51.8% (2024) |
| Debt-to-Assets | 2.1% (2024) | 27.9% (2024) |
| Interest Coverage | N/A | 14.3x (2024) |
| Asset Turnover | 0.53 (2024) | 0.22 (2024) |
| Fixed Asset Turnover | 5.89 (2024) | 12.7 (2024) |
| Payout Ratio | 54.1% (2024) | 78.5% (2024) |
| Dividend Yield | 4.51% (2024) | 7.61% (2024) |
| Fiscal Year | 2024 | 2024 |
Efficiency & Valuation Duel: The Vital Signs
Financial ratios act as a company’s DNA, revealing hidden risks, operational excellence, and how efficiently it creates shareholder value.
T. Rowe Price Group, Inc.
T. Rowe Price delivers strong profitability with a 20.3% ROE and a robust 29.6% net margin. Its valuation remains attractive at a 12.0 P/E, indicating the stock is reasonably priced. The firm rewards shareholders with a 4.51% dividend yield, reflecting disciplined capital allocation rather than aggressive growth reinvestment.
Invesco Ltd.
Invesco faces profitability challenges, showing zero ROE and negative net margin, signaling operational struggles. Despite a negative P/E, the valuation appears cheap but reflects underlying issues. The company maintains a 3.18% dividend yield, suggesting a focus on shareholder income amid weak reinvestment and efficiency metrics.
Solid Profitability Outshines Discounted Risk
T. Rowe Price balances attractive valuation with strong profitability and shareholder returns, while Invesco’s metrics reveal high risk and operational weakness. Investors prioritizing stability and earnings quality may favor T. Rowe, whereas those seeking income with tolerance for risk might consider Invesco’s profile.
Which one offers the Superior Shareholder Reward?
I see T. Rowe Price Group, Inc. (TROW) delivers a balanced distribution with a 4.5% dividend yield and a moderate 54% payout ratio, supported by strong free cash flow of 5.7/share. It complements dividends with steady buybacks, ensuring sustainable long-term value. Invesco Ltd. (IVZ) offers a higher 7.6% dividend yield but with a payout ratio exceeding 78%, indicating less cushion. IVZ’s recent negative net margins and volatile earnings raise sustainability concerns despite share repurchases. I conclude TROW’s disciplined capital allocation and robust cash flow underpin a superior total return profile for 2026 investors.
Comparative Score Analysis: The Strategic Profile
The radar chart reveals the fundamental DNA and trade-offs of T. Rowe Price Group, Inc. and Invesco Ltd.:
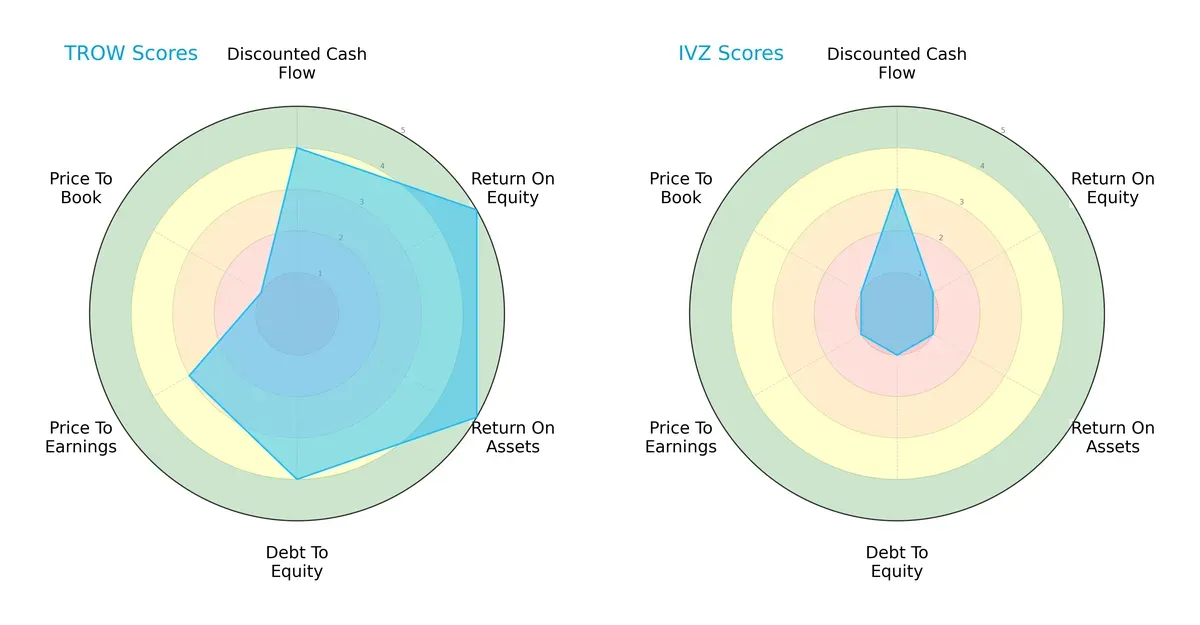
T. Rowe Price dominates in profitability metrics with top ROE (5) and ROA (5) scores, plus a solid DCF score (4). It maintains a balanced leverage profile (Debt/Equity 4), though its Price-to-Book score (1) flags valuation concerns. Invesco, by contrast, lags significantly across profitability and leverage metrics, relying solely on a moderate DCF score (3). T. Rowe Price offers a more balanced and robust financial profile; Invesco depends on a narrow value proposition.
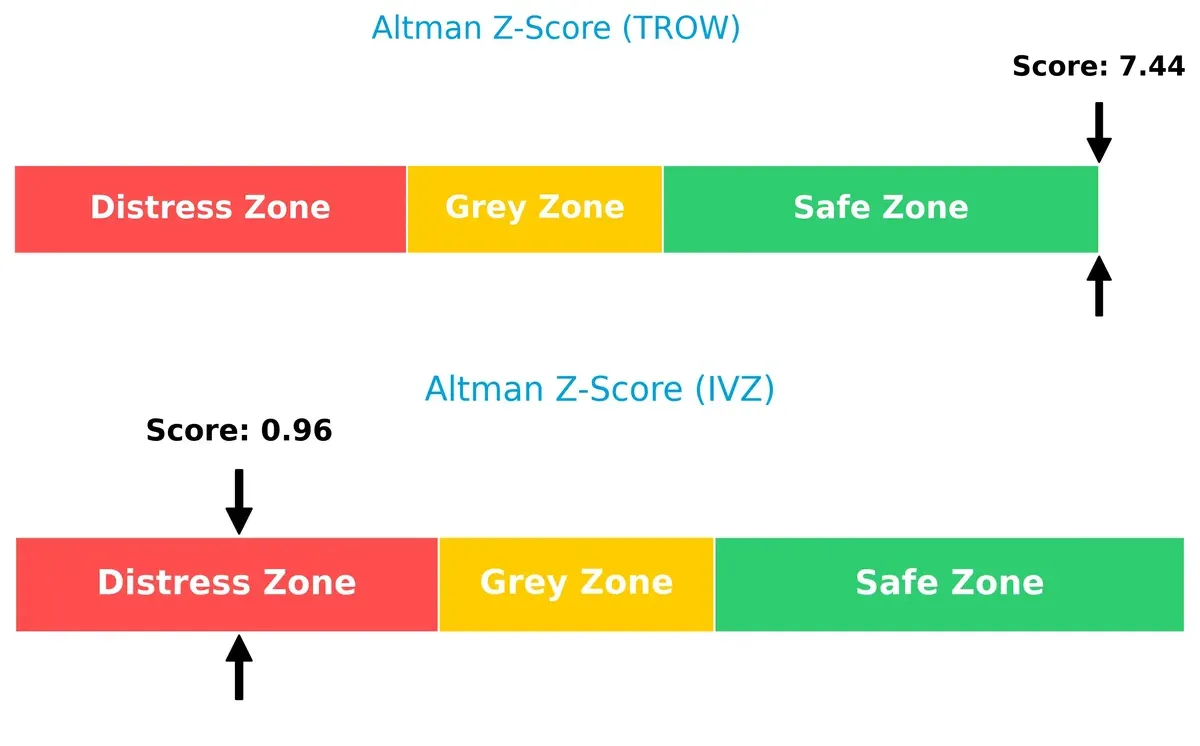
Bankruptcy Risk: Solvency Showdown
T. Rowe Price’s Altman Z-Score at 7.44 places it firmly in the safe zone, signaling strong long-term solvency. Invesco’s 0.96 score signals distress, highlighting a high bankruptcy risk in this cycle:
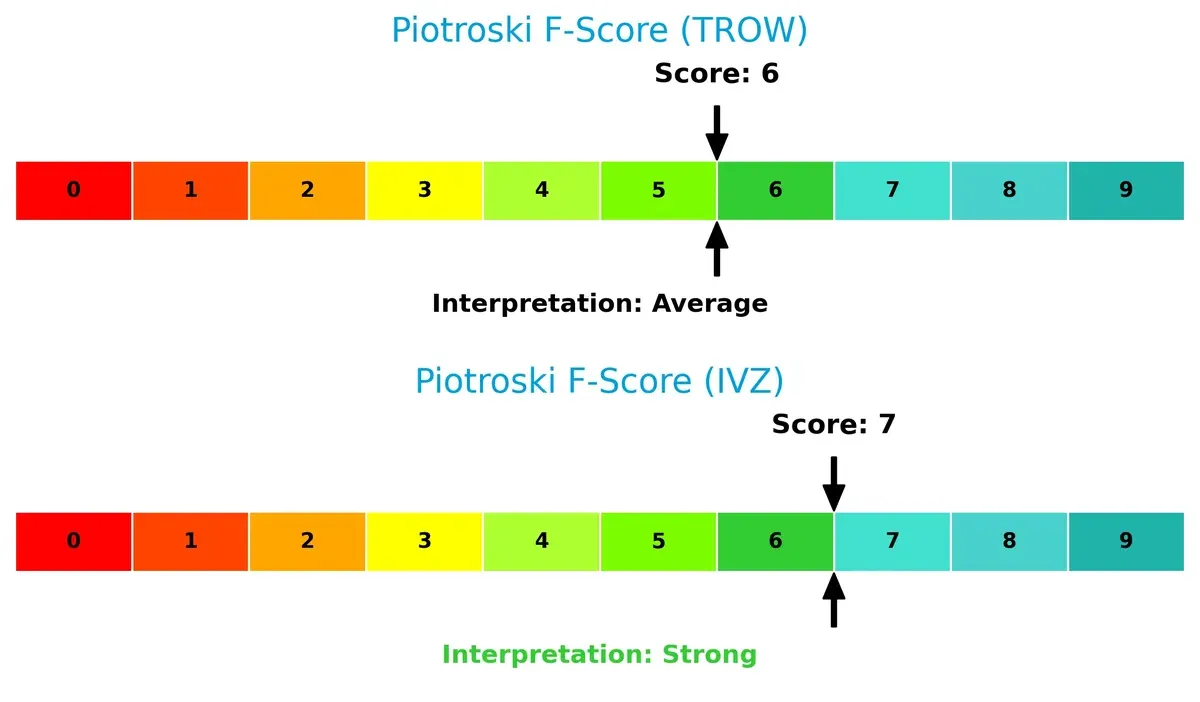
Financial Health: Quality of Operations
Invesco scores a stronger 7 on the Piotroski F-Score, indicating healthier internal financial metrics despite its solvency risk. T. Rowe Price’s 6 reflects average financial health, with no immediate red flags:
How are the two companies positioned?
This section dissects the operational DNA of TROW and IVZ by comparing their revenue distribution and analyzing their strengths and weaknesses. The goal is to confront their economic moats and identify which business model delivers the most resilient competitive advantage today.
Revenue Segmentation: The Strategic Mix
This visual comparison dissects how T. Rowe Price Group, Inc. and Invesco Ltd. diversify their income streams and reveals their primary sector bets:
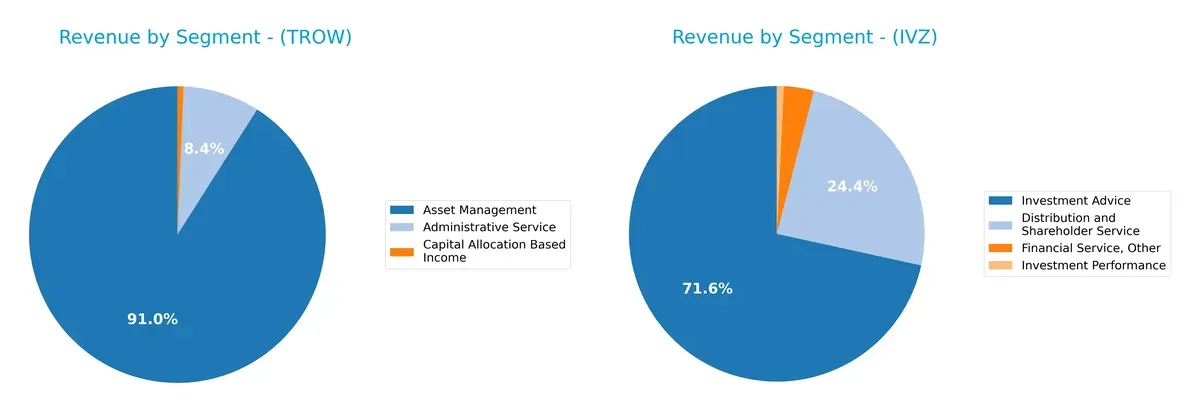
T. Rowe Price anchors its revenue heavily on Asset Management, generating $6.4B in 2024, dwarfing its smaller Administrative Service ($588M) and Capital Allocation income ($47M). Invesco shows a more diversified mix, with Investment Advice ($4.3B) leading but closely followed by Distribution and Shareholder Service ($1.5B). T. Rowe Price’s concentration increases concentration risk, while Invesco pivots on broader service lines, suggesting stronger ecosystem lock-in.
Strengths and Weaknesses Comparison
This table compares the strengths and weaknesses of T. Rowe Price Group, Inc. and Invesco Ltd.:
T. Rowe Price Group, Inc. Strengths
- Strong profitability with 29.61% net margin
- High ROE at 20.3%
- Favorable ROIC exceeding WACC
- Low debt levels with 2.07% debt to assets
- Solid dividend yield of 4.51%
- Consistent asset management revenue above 6B USD
Invesco Ltd. Strengths
- Diverse revenue streams including distribution and investment advice
- Global presence with significant Americas and EMEA exposure
- Favorable price-to-earnings and price-to-book ratios
- Positive dividend yield of 3.18%
- Established market share in multiple service segments
T. Rowe Price Group, Inc. Weaknesses
- Unfavorable current ratio of 8.01 suggests liquidity concerns
- WACC higher than ROIC, indicating capital cost pressure
- Neutral asset turnover at 0.53 limits efficiency insights
Invesco Ltd. Weaknesses
- Negative net margin and zero ROE indicate profitability issues
- Unavailable WACC and poor interest coverage at -6.63
- Zero current and quick ratios raise financial stability flags
- Weak turnover metrics signal operational inefficiencies
T. Rowe Price demonstrates strong profitability and conservative leverage but faces liquidity and capital cost challenges. Invesco’s broad diversification and global reach contrast with significant profitability and liquidity weaknesses, posing strategic risks.
The Moat Duel: Analyzing Competitive Defensibility
A structural moat is the only true shield protecting long-term profits from relentless competitive erosion. Let’s dissect the moats of two asset managers:
T. Rowe Price Group, Inc.: Intangible Assets and Brand Trust
T. Rowe Price leverages strong brand loyalty and deep client relationships as its moat. This translates to a favorable 34.9% EBIT margin and stable net margins near 30%. However, declining ROIC signals margin pressure ahead, though new ESG-focused products could reinforce its edge in 2026.
Invesco Ltd.: Diversified Product Range and Scale
Invesco’s moat stems from its broad global footprint and multi-asset offerings, contrasting T. Rowe’s focused brand moat. Its gross margin of 43.2% suffers from negative EBIT and net margins, reflecting operational challenges. Expansion into alternative investments offers growth potential but risks further margin dilution.
Margin Strength vs. Scale Diversification: The Moat Showdown
T. Rowe Price holds the deeper moat with consistent profitability and value creation, despite ROIC decline. Invesco’s scale and product breadth provide opportunity but lack current profitability. T. Rowe is better positioned to defend market share amid intensifying competition.
Which stock offers better returns?
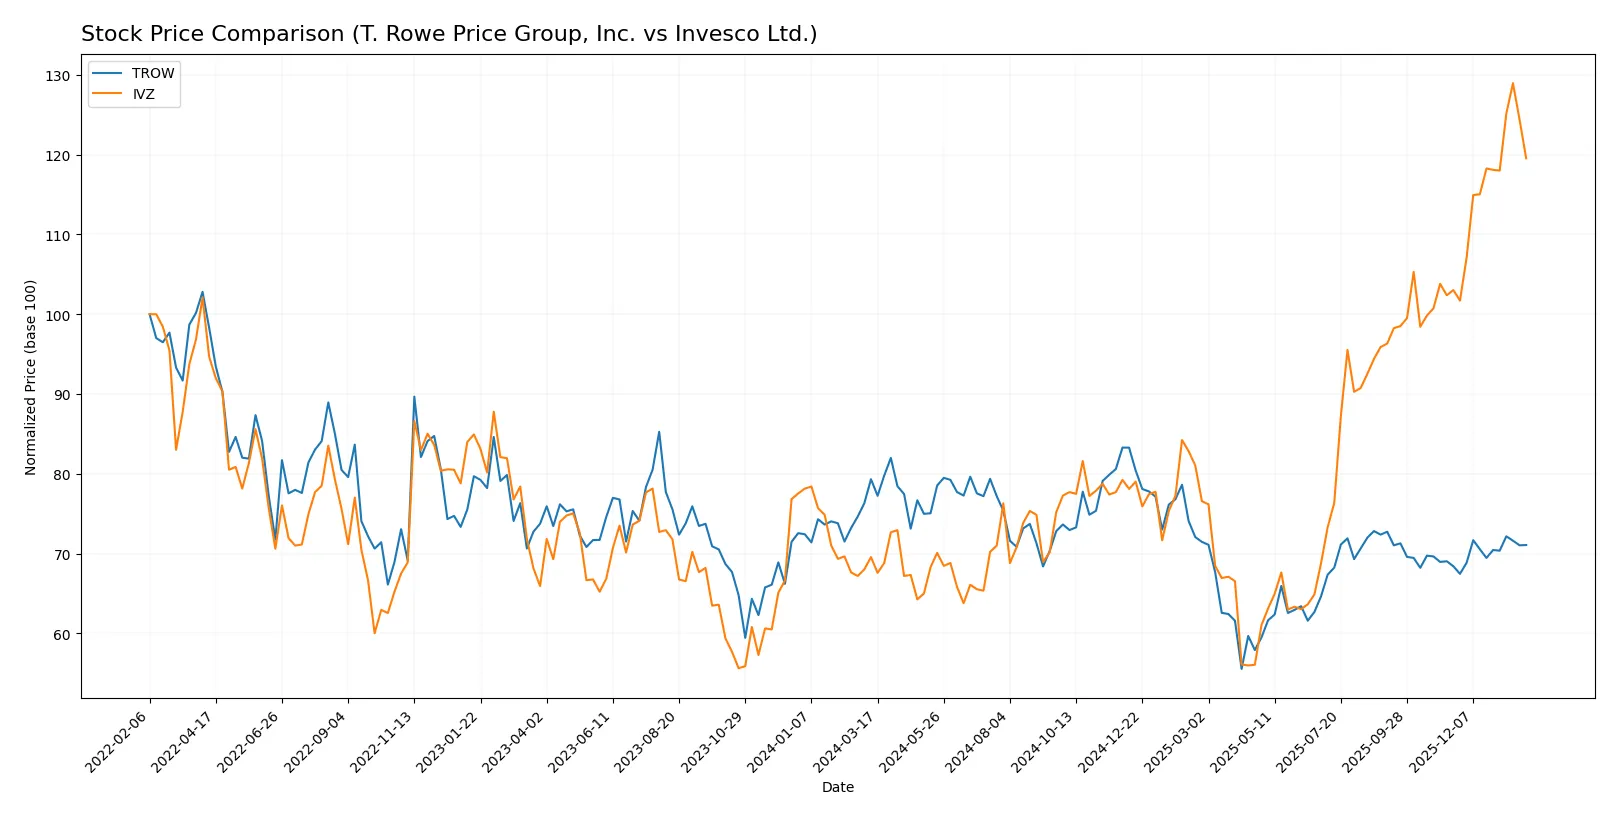
The stock price movements over the past 12 months reveal starkly different trajectories for T. Rowe Price Group, Inc. and Invesco Ltd., with contrasting trends and trading volumes shaping investor sentiment.
Trend Comparison
T. Rowe Price Group, Inc. shows a bearish trend over the past year with a -10.4% price decline, accelerated downtrend, and high volatility (8.84 std dev). A recent slight rebound (+3.89%) suggests tentative recovery.
Invesco Ltd. exhibits a strong bullish trend with a 71.85% price increase and accelerating momentum. Volatility is moderate (3.99 std dev), and recent gains (+16.03%) confirm sustained upward strength.
Invesco’s stock outperformed T. Rowe Price significantly, delivering the highest market return and stronger buying dominance throughout the observed period.
Target Prices
Analysts present a modestly bullish consensus for T. Rowe Price Group and Invesco Ltd. in 2026.
| Company | Target Low | Target High | Consensus |
|---|---|---|---|
| T. Rowe Price Group, Inc. | 102 | 128 | 115 |
| Invesco Ltd. | 24 | 34.5 | 29.8 |
The consensus target for TROW sits about 9% above its current price of 105.68, signaling upside potential. IVZ’s target consensus of 29.8 implies roughly 9% growth from its 27.29 price, reflecting moderate analyst optimism.

Don’t Let Luck Decide Your Entry Point
Optimize your entry points with our advanced ProRealTime indicators. You’ll get efficient buy signals with precise price targets for maximum performance. Start outperforming now!
How do institutions grade them?
The following tables summarize recent institutional grades for T. Rowe Price Group, Inc. and Invesco Ltd.:
T. Rowe Price Group, Inc. Grades
The table below shows T. Rowe Price’s recent grades and analyst actions from major institutions.
| Grading Company | Action | New Grade | Date |
|---|---|---|---|
| JP Morgan | Maintain | Underweight | 2026-01-20 |
| Barclays | Maintain | Underweight | 2026-01-15 |
| TD Cowen | Maintain | Hold | 2026-01-14 |
| Keefe, Bruyette & Woods | Maintain | Market Perform | 2025-12-17 |
| Morgan Stanley | Maintain | Equal Weight | 2025-12-17 |
| Barclays | Maintain | Underweight | 2025-12-12 |
| Evercore ISI Group | Maintain | In Line | 2025-12-05 |
| TD Cowen | Maintain | Hold | 2025-11-03 |
| JP Morgan | Maintain | Underweight | 2025-11-03 |
| Keefe, Bruyette & Woods | Maintain | Market Perform | 2025-11-03 |
Invesco Ltd. Grades
Below is a summary of Invesco’s recent grades and changes by leading grading firms.
| Grading Company | Action | New Grade | Date |
|---|---|---|---|
| Goldman Sachs | Maintain | Neutral | 2026-01-28 |
| Barclays | Maintain | Equal Weight | 2026-01-28 |
| RBC Capital | Maintain | Outperform | 2026-01-28 |
| Argus Research | Maintain | Buy | 2026-01-28 |
| RBC Capital | Upgrade | Outperform | 2026-01-21 |
| JP Morgan | Maintain | Neutral | 2026-01-20 |
| Barclays | Maintain | Equal Weight | 2026-01-15 |
| Deutsche Bank | Upgrade | Buy | 2025-12-17 |
| Morgan Stanley | Maintain | Equal Weight | 2025-12-17 |
| Barclays | Maintain | Equal Weight | 2025-12-12 |
Which company has the best grades?
Invesco Ltd. holds generally stronger grades, including multiple “Buy” and “Outperform” ratings. T. Rowe Price mostly receives “Underweight” and “Hold” grades. This divergence may influence investor sentiment and portfolio positioning.
Risks specific to each company
The following categories identify the critical pressure points and systemic threats facing both firms in the 2026 market environment:
1. Market & Competition
T. Rowe Price Group, Inc.
- Strong brand with global reach and diversified clients; faces intense competition among asset managers.
Invesco Ltd.
- Broader product mix including alternative markets, but struggles with profitability and market differentiation.
2. Capital Structure & Debt
T. Rowe Price Group, Inc.
- Extremely low debt levels (D/E 0.03), strong interest coverage, minimal financial risk.
Invesco Ltd.
- Financial distress signs with negative interest coverage and unclear debt metrics; weak balance sheet.
3. Stock Volatility
T. Rowe Price Group, Inc.
- Beta of 1.53 indicates moderate to high market sensitivity but manageable volatility.
Invesco Ltd.
- Higher beta at 1.63, suggesting more pronounced price swings and investor risk.
4. Regulatory & Legal
T. Rowe Price Group, Inc.
- Operates across multiple jurisdictions with stable compliance track record; regulatory risk moderate.
Invesco Ltd.
- Exposure to complex global regulations, especially in alternative assets, increasing legal risk.
5. Supply Chain & Operations
T. Rowe Price Group, Inc.
- Operations supported by solid infrastructure and strong operational metrics; low operational risk.
Invesco Ltd.
- Greater operational complexity with diverse product offerings, increasing execution risk.
6. ESG & Climate Transition
T. Rowe Price Group, Inc.
- Focuses on socially responsible investing with integrated ESG strategies; well-positioned for climate transition.
Invesco Ltd.
- ESG integration less pronounced, potentially lagging peers on sustainability and climate risks.
7. Geopolitical Exposure
T. Rowe Price Group, Inc.
- Global footprint balanced across developed and emerging markets; geopolitical risk diversified.
Invesco Ltd.
- Similar global exposure but higher sensitivities linked to emerging markets and alternative assets.
Which company shows a better risk-adjusted profile?
T. Rowe Price’s strongest risk is market competition, but its robust capital structure and operational stability mitigate this. Invesco faces severe financial distress risks, highlighted by negative margins and a distress-zone Altman Z-score. T. Rowe Price clearly offers a better risk-adjusted profile, supported by its safer balance sheet and favorable profitability metrics in 2026.
Final Verdict: Which stock to choose?
T. Rowe Price Group, Inc. (TROW) excels as a cash-generating powerhouse with a durable competitive edge. Its hallmark is efficient capital deployment yielding solid returns above cost of capital. A point of vigilance remains its declining ROIC trend, signaling caution on sustaining long-term profitability. TROW suits portfolios seeking steady income and moderate growth.
Invesco Ltd. (IVZ) offers a strategic moat anchored in its cost discipline and recent bullish momentum. Though its income metrics underwhelm, IVZ’s lower valuation multiples and improving free cash flow yield present a value opportunity. Relative to TROW, it carries higher risk but could fit investors focused on turnaround plays and contrarian growth potential.
If you prioritize capital efficiency and income stability, TROW is the compelling choice due to its strong value creation and financial resilience. However, if you seek speculative growth with potential undervaluation, IVZ offers better upside despite operational headwinds. Each scenario frames distinct risk tolerances and investment horizons.
Disclaimer: Investment carries a risk of loss of initial capital. The past performance is not a reliable indicator of future results. Be sure to understand risks before making an investment decision.
Go Further
I encourage you to read the complete analyses of T. Rowe Price Group, Inc. and Invesco Ltd. to enhance your investment decisions: