Home > Comparison > Financial Services > STT vs IVZ
The strategic rivalry between State Street Corporation and Invesco Ltd. shapes the competitive landscape of the financial services sector. State Street operates as a capital-intensive asset management powerhouse, offering comprehensive institutional investment servicing. In contrast, Invesco focuses on diversified investment management with a leaner operational model. This analysis examines their contrasting approaches to asset management and risk, aiming to identify which offers superior risk-adjusted returns for a diversified portfolio in 2026.
Table of contents
Companies Overview
State Street Corporation and Invesco Ltd. stand as pivotal players in the asset management landscape, shaping institutional and retail investment strategies.
State Street Corporation: Institutional Asset Servicing Powerhouse
State Street dominates as a global institutional asset servicer, generating revenue through custody, portfolio management, and risk analytics. In 2026, its strategic focus centers on expanding ESG investing and enhancing data-driven financial services to support institutional clients worldwide.
Invesco Ltd.: Diversified Investment Manager
Invesco operates as a versatile investment manager, earning fees from managing mutual funds, ETFs, and private funds across equity, fixed income, and alternative markets. The firm prioritizes quantitative strategies and broad client segmentation, emphasizing growth in global multi-asset and absolute return solutions in 2026.
Strategic Collision: Similarities & Divergences
Both firms compete in asset management but diverge sharply. State Street builds on a servicing ecosystem for institutions, while Invesco pursues an active management approach targeting diverse client bases. Their primary battleground is market share in multi-asset and alternative strategies. This contrast defines distinct investment profiles: stable servicing revenues versus growth-driven asset management fees.
Income Statement Comparison
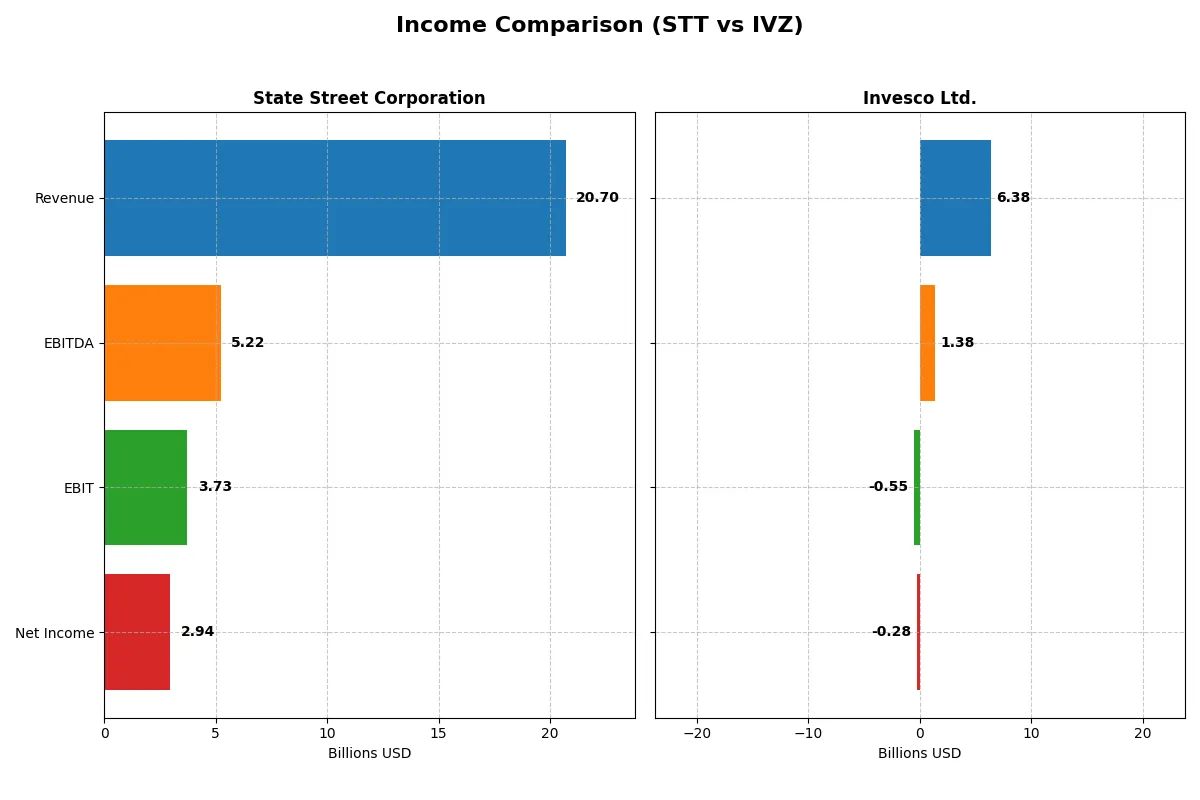
The following data dissects the core profitability and scalability of both corporate engines to reveal who dominates the bottom line:
| Metric | State Street Corporation (STT) | Invesco Ltd. (IVZ) |
|---|---|---|
| Revenue | 20.7B | 6.38B |
| Cost of Revenue | 6.79B | 3.62B |
| Operating Expenses | 10.18B | 3.45B |
| Gross Profit | 13.91B | 2.75B |
| EBITDA | 5.22B | 1.38B |
| EBIT | 3.73B | -547M |
| Interest Expense | 8.68B | 83M |
| Net Income | 2.95B | -282M |
| EPS | 9.56 | -1.61 |
| Fiscal Year | 2025 | 2025 |
Income Statement Analysis: The Bottom-Line Duel
This income statement comparison reveals which company runs a more efficient and profitable corporate engine through recent financial performance.
State Street Corporation Analysis
State Street’s revenue grew 72% over five years, peaking at 20.7B in 2025 but dipped 5.8% from 2024. Its net income expanded steadily, reaching 2.95B in 2025. Gross margin remains strong at 67.2%, with a solid net margin of 14.2%. Efficiency improved notably in 2025, with EBIT rising 9.9% and EPS up 14.6%, signaling robust momentum despite slightly lower sales.
Invesco Ltd. Analysis
Invesco’s revenue declined 7.5% over five years, hitting 6.38B in 2025 but grew 5.1% year-over-year. Net income slid further into the red, posting a loss of 282M in 2025. Gross margin at 43.2% is moderate, but negative EBIT margin (-8.6%) and net margin (-4.4%) highlight profitability challenges. The latest year saw a sharp EBIT drop of 151%, reflecting operational stress and deteriorating earnings quality.
Margin Strength vs. Profitability Struggles
State Street clearly outperforms Invesco with superior revenue growth, healthier margins, and positive net income trends. State Street’s consistent profitability and expanding margins contrast sharply with Invesco’s ongoing losses and shrinking net income. For investors, State Street’s profile offers greater financial stability and earnings momentum, making it the fundamentally stronger choice.
Financial Ratios Comparison
These vital ratios act as a diagnostic tool to expose the underlying fiscal health, valuation premiums, and capital efficiency of the companies compared below:
| Ratios | State Street Corporation (STT) | Invesco Ltd. (IVZ) |
|---|---|---|
| ROE | 10.6% | 5.3% |
| ROIC | 2.7% | 2.4% |
| P/E | 12.3 | 10.3 |
| P/B | 1.30 | 0.55 |
| Current Ratio | 3.59 | 3.14 |
| Quick Ratio | 3.59 | 3.14 |
| D/E (Debt-to-Equity) | 1.07 | 0.52 |
| Debt-to-Assets | 8.1% | 28.0% |
| Interest Coverage | 0.43 | 14.3 |
| Asset Turnover | 0.057 | 0.225 |
| Fixed Asset Turnover | 6.52 | 12.7 |
| Payout ratio | 29.7% | 78.5% |
| Dividend yield | 2.42% | 7.61% |
| Fiscal Year | 2025 | 2025 |
Efficiency & Valuation Duel: The Vital Signs
Financial ratios serve as a company’s DNA, exposing hidden risks and revealing operational strengths and weaknesses.
State Street Corporation
State Street shows a solid 10.58% ROE and favorable 14.23% net margin, signaling decent profitability. Its P/E of 12.27 and P/B of 1.3 indicate the stock trades at a reasonable valuation. The 2.42% dividend yield rewards shareholders, reflecting stable cash returns amid modest growth.
Invesco Ltd.
Invesco posts a troubling negative net margin of -11.39% and zero ROE, pointing to operational challenges. Its P/E is distorted at -16.37 but still marked favorable, likely due to valuation quirks. The 3.18% dividend yield offers income, despite a lack of profitability and unfavorable liquidity ratios.
Profitability Stability vs. Dividend Reliance
State Street balances reasonable valuation with operational strength, managing risks better than Invesco. Invesco’s dividend yield masks profitability issues and liquidity concerns. Investors seeking stability may prefer State Street’s profile, while income-focused investors might consider Invesco’s yield despite higher risks.
Which one offers the Superior Shareholder Reward?
I see State Street Corporation (STT) offers a more balanced and sustainable shareholder reward approach than Invesco Ltd. (IVZ). STT pays a steady dividend yield around 2.4% to 3.9% with payout ratios near 30% to 50%. This indicates strong free cash flow coverage and prudent capital allocation. Its share buybacks are consistent, enhancing total returns without overstretching financial leverage. In contrast, IVZ shows a higher dividend yield near 3.2% to 7.6% but with erratic payout ratios, including negative figures, signaling volatile earnings and riskier distributions. IVZ’s buyback activity is less consistent, and its profitability margins have recently deteriorated. I conclude STT’s disciplined distribution and steady buybacks offer a superior total return profile with lower risk in 2026.
Comparative Score Analysis: The Strategic Profile
The radar chart reveals the fundamental DNA and trade-offs of State Street Corporation and Invesco Ltd., highlighting their distinct financial strengths and weaknesses:
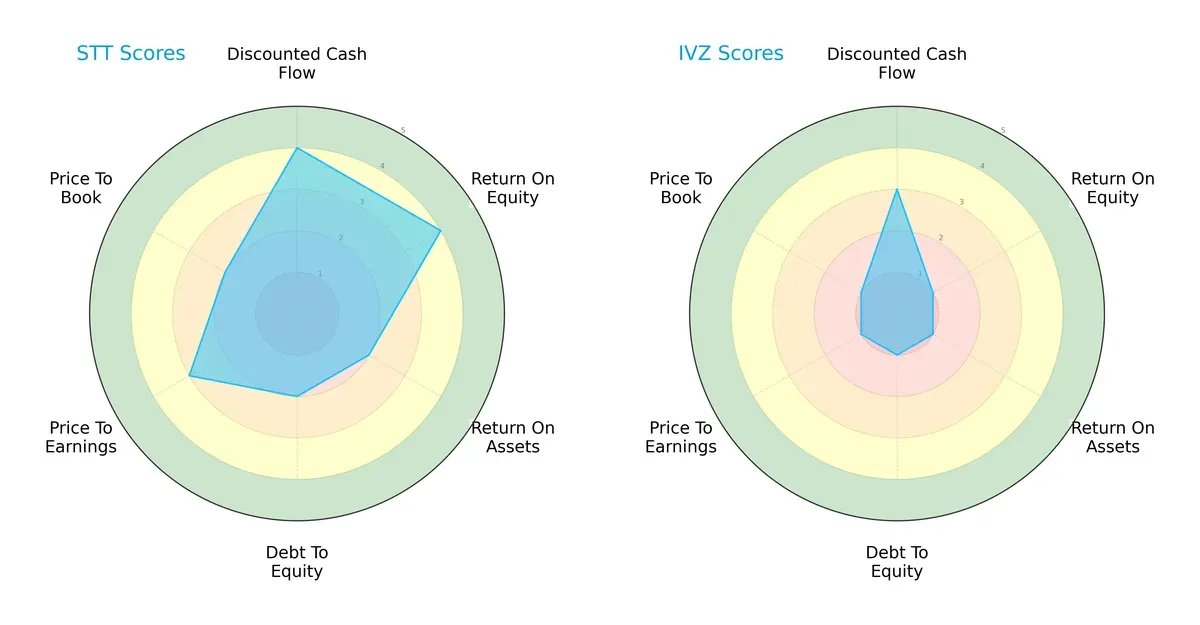
State Street shows strength in discounted cash flow and return on equity, reflecting efficient capital allocation and profitability. Invesco lags with uniformly low scores, signaling broad financial challenges. State Street’s profile is more balanced, while Invesco relies on a weak valuation edge. State Street stands out as the more stable investment in the current market cycle.
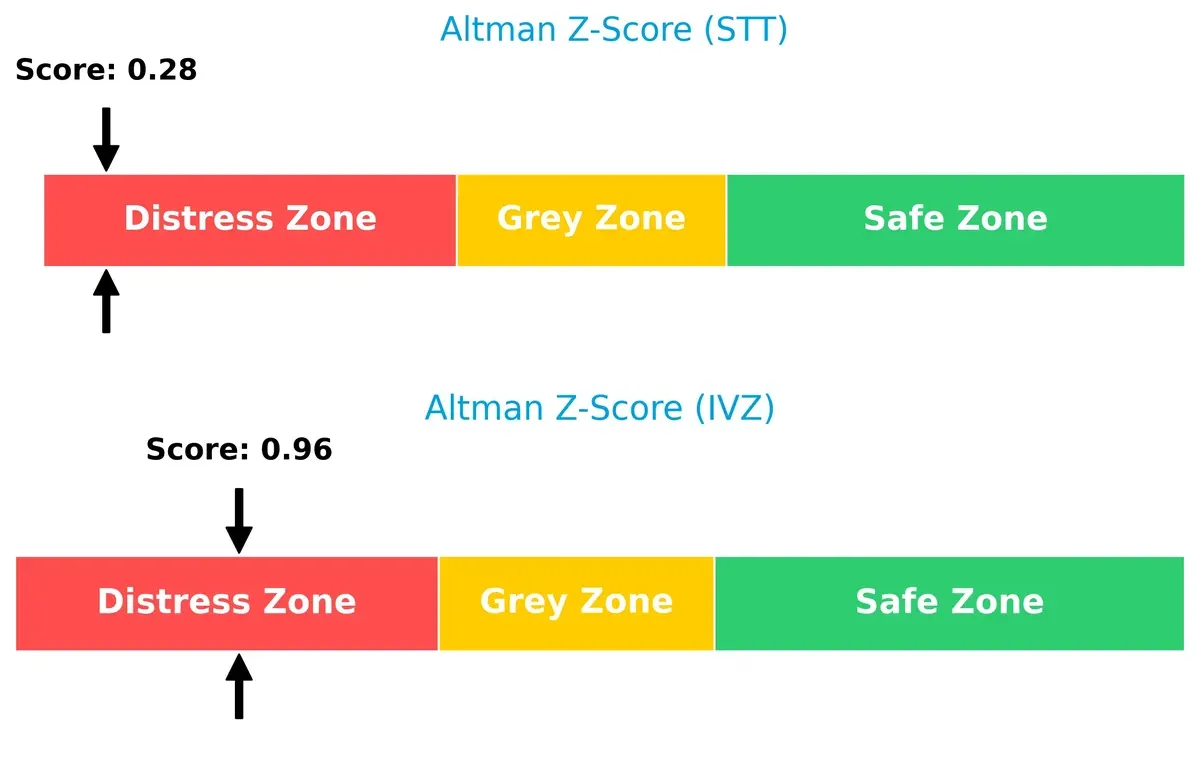
Bankruptcy Risk: Solvency Showdown
The Altman Z-Scores place both companies firmly in the distress zone, indicating elevated bankruptcy risk and financial vulnerability in this cycle:
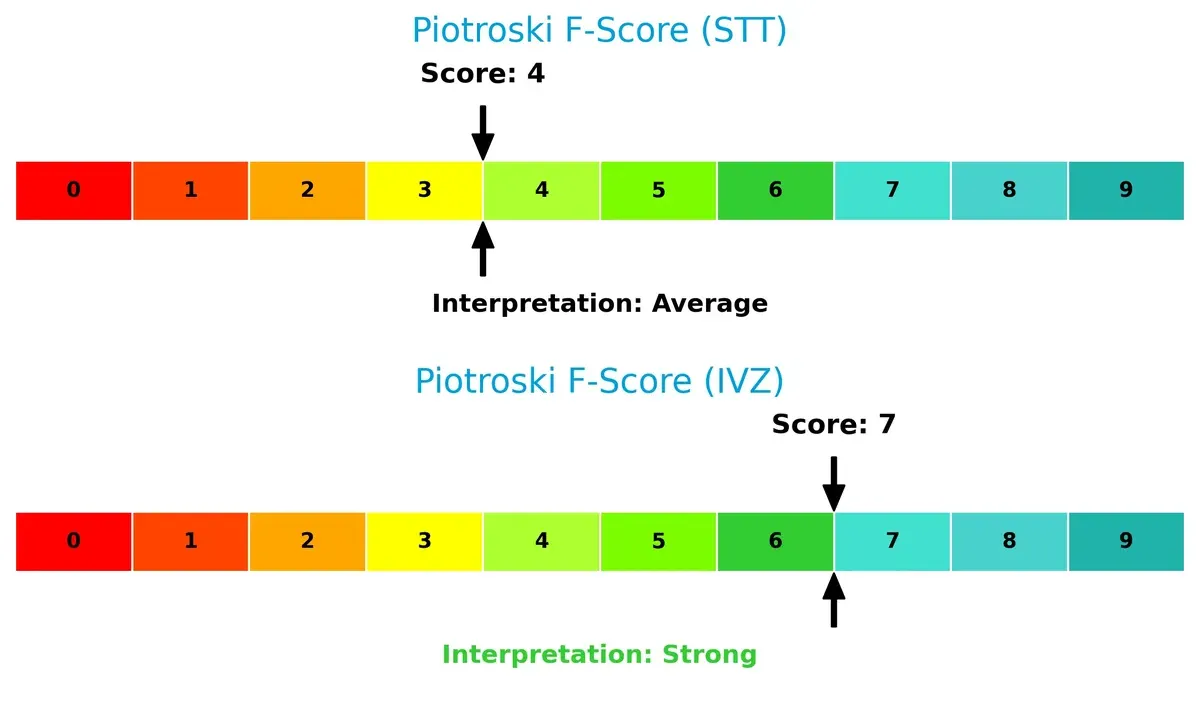
Financial Health: Quality of Operations
Invesco’s Piotroski F-Score of 7 signals strong financial health and operational quality. State Street’s score of 4 is average, pointing to moderate internal risks:
How are the two companies positioned?
This section dissects State Street and Invesco’s operational DNA by comparing revenue distribution and internal dynamics. The goal is to confront their economic moats to reveal which model offers the most resilient competitive advantage today.
Revenue Segmentation: The Strategic Mix
This visual comparison dissects how State Street Corporation and Invesco Ltd. diversify income streams and where their primary sector bets lie:
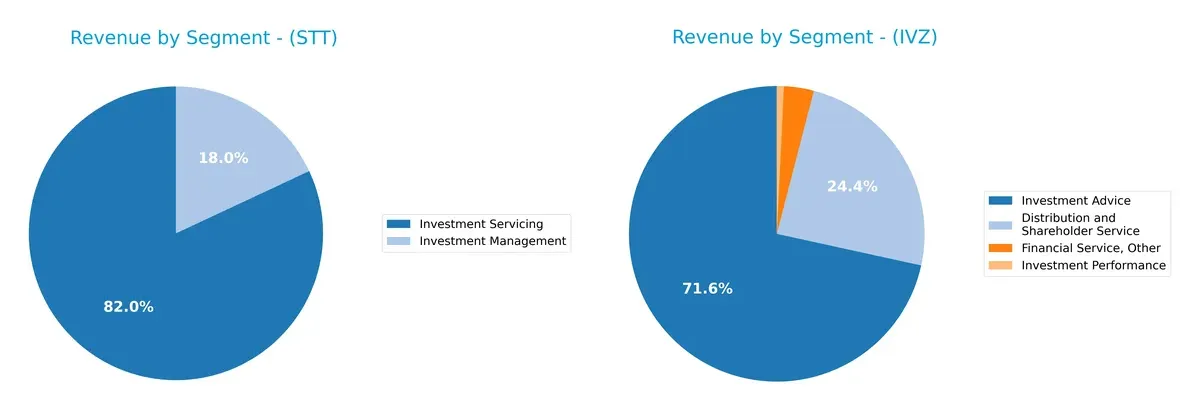
State Street leans heavily on Investment Servicing, generating $10.7B in 2024, dwarfing its $2.3B from Investment Management. Invesco displays a more diversified mix, with $4.3B from Investment Advice and $1.5B from Distribution and Shareholder Service. State Street’s concentration signals infrastructure dominance but also concentration risk. Invesco’s broader base suggests resilience through varied client engagement channels.
Strengths and Weaknesses Comparison
This table compares the Strengths and Weaknesses of State Street Corporation and Invesco Ltd.:
State Street Corporation Strengths
- Strong Investment Servicing revenue around 10.7B USD
- Consistent global revenue with 5.5B USD Non-US sales
- Favorable net margin at 14.23%
- Solid dividend yield at 2.42%
- Favorable P/E and P/B ratios
Invesco Ltd. Strengths
- Diverse revenue streams including Investment Advice at 4.3B USD
- Favorable dividend yield at 3.18%
- Favorable debt-to-equity and debt-to-assets ratios
- Presence in Americas, Asia, and EMEA regions
- Positive P/E and P/B despite losses
State Street Corporation Weaknesses
- Unfavorable ROIC (2.72%) below WACC (16.53%) indicates poor capital efficiency
- High current ratio (3.59) suggests inefficient asset use
- Weak interest coverage at 0.43 times
- Elevated debt-to-equity ratio (1.07)
- Low asset turnover (0.06)
Invesco Ltd. Weaknesses
- Negative net margin at -11.39% and zero ROE/ROIC indicate profitability challenges
- Unfavorable interest coverage at -6.63 times
- Unfavorable current and quick ratios indicate liquidity issues
- Zero asset turnover and fixed asset turnover ratios
- Lack of WACC data limits capital cost assessment
Both companies show strengths in dividend yield and geographic diversification. However, State Street’s capital efficiency and liquidity ratios raise caution, while Invesco faces significant profitability and liquidity challenges limiting its financial robustness. These contrasts highlight differing operational and financial priorities for each firm’s strategic focus.
The Moat Duel: Analyzing Competitive Defensibility
A structural moat is the only true shield guarding long-term profits from relentless competition erosion. Let’s dissect the moats of two asset managers:
State Street Corporation: Intangible Assets and Scale Moat
State Street’s moat stems from deep institutional relationships and brand strength, reflected in stable margins and solid gross margin of 67%. However, its declining ROIC signals pressure on value creation. New ESG and alternative investment products could bolster defensibility in 2026.
Invesco Ltd.: Product Diversification Moat
Invesco relies on product breadth and global reach, contrasting State Street’s scale. Despite positive revenue growth recently, weak margins and negative net income growth erode its competitive position. Expansion into alternatives and quant strategies offers a slim chance to deepen its moat.
Verdict: Institutional Depth vs. Diversification Breadth
State Street’s moat is deeper, anchored by intangible assets and scale, though under margin pressure. Invesco’s broader product base lacks profitability stability, making it less equipped to defend market share over time. I see State Street as better positioned to retain competitive advantage through 2026.
Which stock offers better returns?
The past year reveals strong upward momentum for both stocks, with State Street showing sharper acceleration and higher volatility compared to Invesco’s steadier climb.
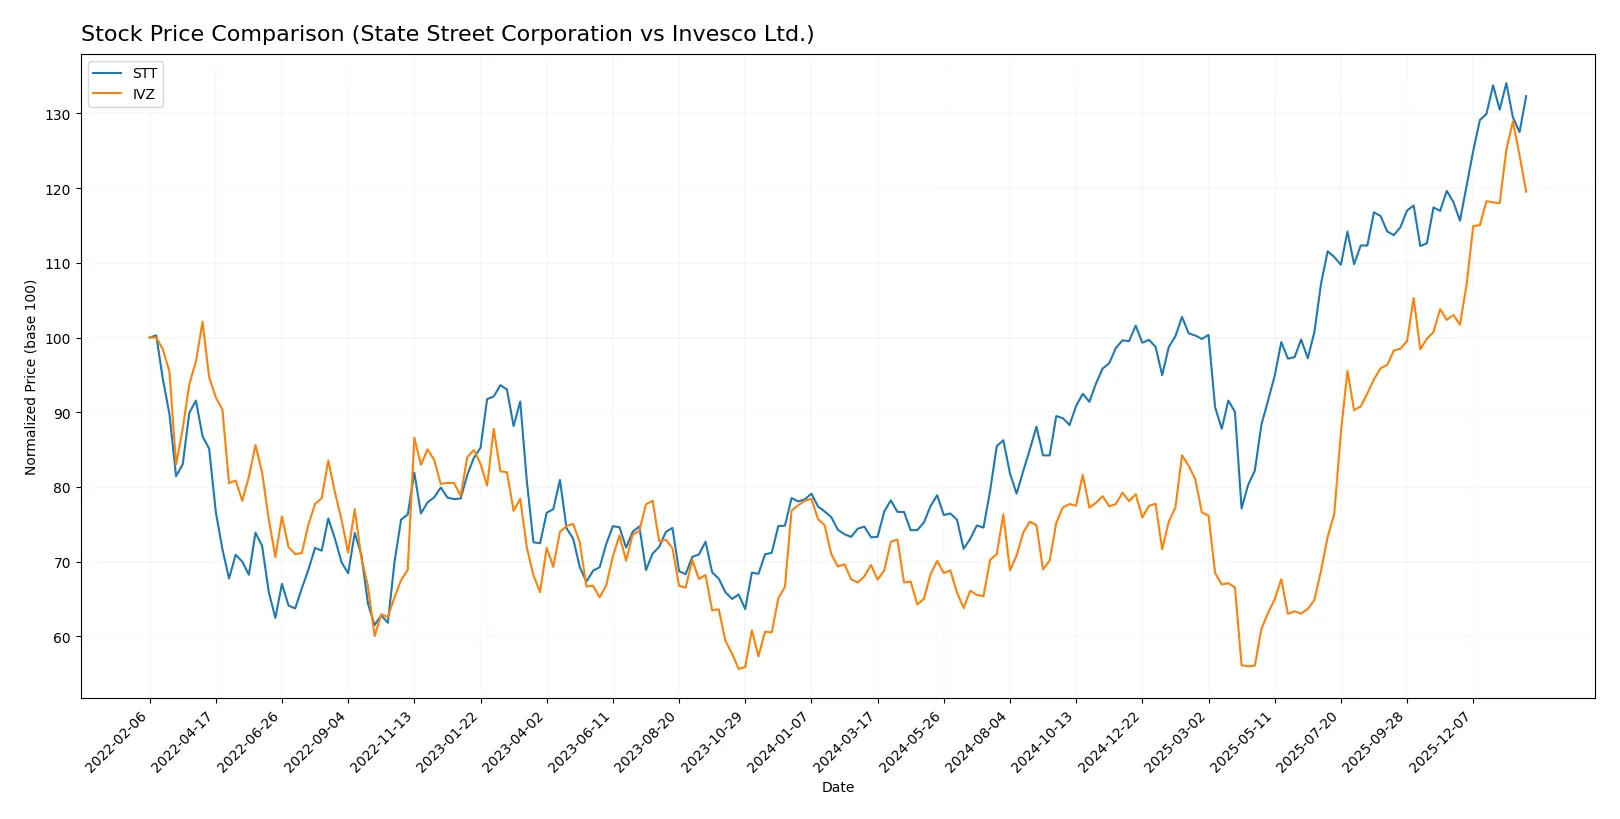
Trend Comparison
State Street Corporation’s stock rose 80.67% over 12 months, a bullish trend with accelerating gains and a high price range between 70.91 and 132.57. Volatility is elevated at 16.89%.
Invesco Ltd.’s stock gained 71.85% in the same period, also bullish with acceleration but lower volatility at 3.99%. Prices ranged from 12.78 to 29.44, indicating steadier growth.
State Street outperformed Invesco by nearly 9 percentage points, delivering the highest market performance with stronger recent upward momentum.
Target Prices
Analysts present a moderately bullish consensus for both State Street Corporation and Invesco Ltd.
| Company | Target Low | Target High | Consensus |
|---|---|---|---|
| State Street Corporation | 128 | 164 | 142.17 |
| Invesco Ltd. | 24 | 34.5 | 29.8 |
The target consensus for State Street stands about 8.6% above its current price of 130.86 USD, signaling moderate upside. Invesco’s consensus target exceeds its current price by nearly 9.2%, reflecting cautious optimism among analysts.

Don’t Let Luck Decide Your Entry Point
Optimize your entry points with our advanced ProRealTime indicators. You’ll get efficient buy signals with precise price targets for maximum performance. Start outperforming now!
How do institutions grade them?
State Street Corporation Grades
The following table summarizes recent grade actions from reputable institutions for State Street Corporation:
| Grading Company | Action | New Grade | Date |
|---|---|---|---|
| Morgan Stanley | Maintain | Overweight | 2026-01-20 |
| TD Cowen | Maintain | Buy | 2026-01-07 |
| Truist Securities | Downgrade | Hold | 2026-01-07 |
| Barclays | Downgrade | Equal Weight | 2026-01-05 |
| Citigroup | Maintain | Buy | 2025-12-30 |
| Citigroup | Maintain | Buy | 2025-10-24 |
| Wells Fargo | Maintain | Overweight | 2025-10-20 |
| Truist Securities | Maintain | Buy | 2025-10-20 |
| Morgan Stanley | Maintain | Overweight | 2025-10-20 |
| Keefe, Bruyette & Woods | Maintain | Outperform | 2025-10-20 |
Invesco Ltd. Grades
Below is a summary of recent ratings from established grading firms for Invesco Ltd.:
| Grading Company | Action | New Grade | Date |
|---|---|---|---|
| Goldman Sachs | Maintain | Neutral | 2026-01-28 |
| Barclays | Maintain | Equal Weight | 2026-01-28 |
| RBC Capital | Maintain | Outperform | 2026-01-28 |
| Argus Research | Maintain | Buy | 2026-01-28 |
| RBC Capital | Upgrade | Outperform | 2026-01-21 |
| JP Morgan | Maintain | Neutral | 2026-01-20 |
| Barclays | Maintain | Equal Weight | 2026-01-15 |
| Deutsche Bank | Upgrade | Buy | 2025-12-17 |
| Morgan Stanley | Maintain | Equal Weight | 2025-12-17 |
| Barclays | Maintain | Equal Weight | 2025-12-12 |
Which company has the best grades?
State Street Corporation generally holds stronger grades, with multiple “Buy,” “Overweight,” and “Outperform” ratings. Invesco Ltd. features mostly “Equal Weight,” “Neutral,” and some “Outperform” grades. Investors may view State Street as more favored by analysts, potentially reflecting higher confidence or better outlook.
Risks specific to each company
The following categories identify the critical pressure points and systemic threats facing both firms in the 2026 market environment:
1. Market & Competition
State Street Corporation (STT)
- Large market cap and diversified services support competitive resilience.
Invesco Ltd. (IVZ)
- Smaller scale and narrower product range increase vulnerability to market shifts.
2. Capital Structure & Debt
State Street Corporation (STT)
- Debt-to-equity at 1.07 signals elevated leverage risk; weak interest coverage (0.43) is concerning.
Invesco Ltd. (IVZ)
- Debt metrics unavailable or zero; reported negative interest coverage (-6.63) signals distress.
3. Stock Volatility
State Street Corporation (STT)
- Beta at 1.448 indicates moderate volatility relative to the market.
Invesco Ltd. (IVZ)
- Higher beta of 1.626 points to greater stock price sensitivity and risk.
4. Regulatory & Legal
State Street Corporation (STT)
- Established compliance framework, but ongoing regulatory changes could pressure operations.
Invesco Ltd. (IVZ)
- Smaller firm size may limit resources to manage evolving financial regulations.
5. Supply Chain & Operations
State Street Corporation (STT)
- Extensive operational infrastructure but asset turnover is very low (0.06), indicating potential inefficiencies.
Invesco Ltd. (IVZ)
- Limited operational scale and zero asset turnover metrics raise questions on operational efficiency.
6. ESG & Climate Transition
State Street Corporation (STT)
- Offers ESG investing solutions, aligning with evolving investor demands and regulatory trends.
Invesco Ltd. (IVZ)
- ESG integration less documented; potential lag in adapting to climate-related investment pressures.
7. Geopolitical Exposure
State Street Corporation (STT)
- Global institutional client base spreads geopolitical risk.
Invesco Ltd. (IVZ)
- Exposure concentrated in fewer regions may heighten sensitivity to geopolitical shocks.
Which company shows a better risk-adjusted profile?
State Street’s largest risk is its stretched capital structure and poor interest coverage, raising solvency concerns. Invesco’s most severe risk is its negative profitability and financial distress signals, with a weak Altman Z-score despite stronger Piotroski fundamentals. Overall, State Street shows a slightly better risk-adjusted profile due to scale and diversified offerings, but both firms face significant financial health challenges. The low interest coverage at State Street and negative net margin at Invesco highlight urgent operational and financial risks investors must monitor closely.
Final Verdict: Which stock to choose?
State Street Corporation’s superpower lies in its consistent cash generation and solid dividend yield, appealing to income-focused investors. However, its declining return on invested capital signals a need for caution. It fits well in a value-oriented portfolio that can tolerate some operational headwinds.
Invesco Ltd. offers a strategic moat through disciplined expense control and a lean cost structure, supporting its ongoing turnaround efforts. Its safety profile appears weaker than State Street’s, with profitability challenges persisting. It might suit investors targeting deep value or contrarian opportunities seeking potential rebounds.
If you prioritize stable income and a proven cash machine, State Street outshines due to its dividend reliability and operational scale. However, if you seek a turnaround play with cost discipline as a lever, Invesco offers better upside potential despite higher risk. Each scenario reflects distinct investor appetites for risk and growth.
Disclaimer: Investment carries a risk of loss of initial capital. The past performance is not a reliable indicator of future results. Be sure to understand risks before making an investment decision.
Go Further
I encourage you to read the complete analyses of State Street Corporation and Invesco Ltd. to enhance your investment decisions: