Home > Comparison > Financial Services > KKR vs IVZ
The strategic rivalry between KKR & Co. Inc. and Invesco Ltd. defines the current trajectory of the global asset management sector. KKR operates as a private equity and real estate investment powerhouse with a broad, capital-intensive footprint. In contrast, Invesco excels as a diversified, high-volume public market investment manager. This analysis explores their contrasting models to determine which offers superior risk-adjusted returns for a balanced, diversified portfolio.
Table of contents
Companies Overview
KKR & Co. Inc. and Invesco Ltd. stand as formidable pillars in the asset management industry, each commanding distinct market niches.
KKR & Co. Inc.: Global Private Equity Powerhouse
KKR dominates as a private equity and real estate investment firm, generating revenue through acquisitions, leveraged buyouts, and diverse fund investments. Its strategic focus in 2026 targets sectors like technology, energy, and real estate across developed and emerging markets. KKR’s global footprint and diverse asset classes underscore its competitive advantage in long-term value creation.
Invesco Ltd.: Diversified Investment Manager
Invesco operates as a publicly owned investment manager, earning fees primarily from managing equity, fixed income, and multi-asset portfolios for a broad client base. Its 2026 strategy emphasizes expanding mutual funds, ETFs, and alternative investments with a quantitative edge. This positions Invesco as a versatile player with a strong retail and institutional client focus.
Strategic Collision: Similarities & Divergences
KKR pursues a hands-on, control-driven investment philosophy, while Invesco favors broad asset diversification and scalable public market strategies. Their primary battleground is asset management fee generation, with KKR leveraging private equity’s illiquidity premium and Invesco capitalizing on public market assets under management. These differences create distinct investment profiles: KKR offers concentrated growth potential; Invesco provides steady, fee-based income.
Income Statement Comparison
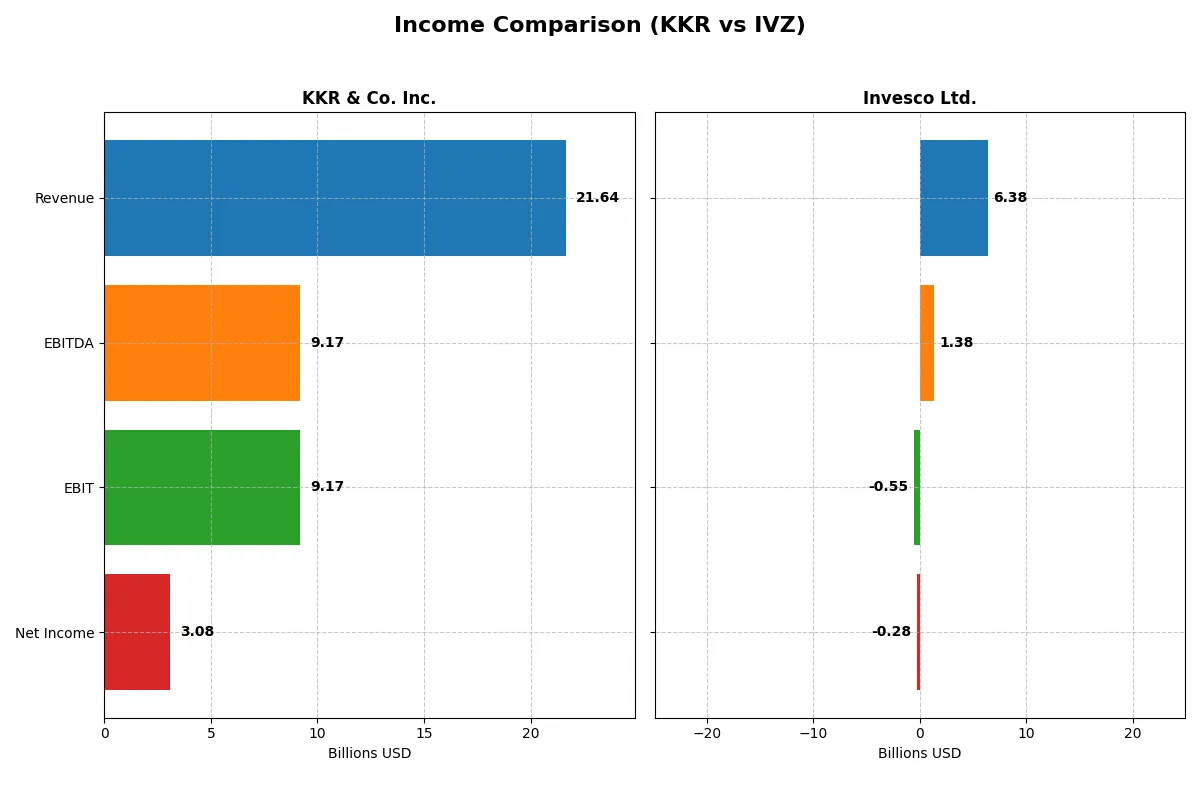
This data dissects the core profitability and scalability of both corporate engines to reveal who dominates the bottom line:
| Metric | KKR & Co. Inc. (KKR) | Invesco Ltd. (IVZ) |
|---|---|---|
| Revenue | 21.6B | 6.37B |
| Cost of Revenue | 17.8B | 3.62B |
| Operating Expenses | 2.92B | 3.45B |
| Gross Profit | 3.84B | 2.75B |
| EBITDA | 9.17B | 1.38B |
| EBIT | 9.17B | -547M |
| Interest Expense | 3.31B | 82.5M |
| Net Income | 3.08B | -727M |
| EPS | 3.47 | -1.61 |
| Fiscal Year | 2024 | 2025 |
Income Statement Analysis: The Bottom-Line Duel
This income statement comparison exposes which company converts revenue into profit more efficiently amid recent market challenges.
KKR & Co. Inc. Analysis
KKR’s revenue surged from 14.3B in 2023 to 21.6B in 2024, showing strong top-line momentum. Despite a shrinking gross profit margin at 17.75%, the company maintains a solid net margin of 14.22%, reflecting healthy operational control. However, net income slid from 3.7B to 3.1B, signaling margin pressures amid rising interest expenses.
Invesco Ltd. Analysis
Invesco’s revenue grew modestly to 6.38B in 2025 from 6.07B in 2024, with a favorable gross margin of 43.18%. Yet, the company reported a negative EBIT margin of -8.57% and a net margin of -4.42%, marking operational inefficiency. The net loss widened to -726M in 2025, reflecting significant depreciation and other expenses undermining profitability.
Margin Resilience vs. Revenue Expansion
KKR clearly outperforms Invesco with higher net income and positive margins despite margin erosion and rising interest costs. Invesco struggles with operational losses despite stable revenue. For investors, KKR’s profile suggests stronger profit conversion and operational resilience, whereas Invesco faces ongoing profitability headwinds.
Financial Ratios Comparison
These vital ratios act as a diagnostic tool to expose the underlying fiscal health, valuation premiums, and capital efficiency of the companies being compared:
| Ratios | KKR & Co. Inc. (KKR) | Invesco Ltd. (IVZ) |
|---|---|---|
| ROE | 13.0% | 5.3% |
| ROIC | 0.25% | 2.38% |
| P/E | 42.6 | 10.3 |
| P/B | 5.55 | 0.55 |
| Current Ratio | 4.12 | 3.14 |
| Quick Ratio | 4.12 | 3.14 |
| D/E | 2.15 | 0.52 |
| Debt-to-Assets | 14.1% | 27.9% |
| Interest Coverage | 0.28 | 14.35 |
| Asset Turnover | 0.06 | 0.22 |
| Fixed Asset Turnover | 12.23 | 12.67 |
| Payout Ratio | 19.9% | 78.5% |
| Dividend Yield | 0.47% | 7.61% |
| Fiscal Year | 2024 | 2024 |
Efficiency & Valuation Duel: The Vital Signs
Financial ratios act as a company’s DNA, unveiling hidden risks and operational strength essential for investment decisions.
KKR & Co. Inc.
KKR posts a solid 13% ROE and a healthy 14.22% net margin, signaling decent profitability. However, its P/E of 42.65 and P/B of 5.55 mark the stock as expensive and stretched. Shareholders receive a low 0.47% dividend yield, reflecting a cautious capital return approach amid reinvestment needs.
Invesco Ltd.
Invesco struggles with a negative net margin and zero ROE, pointing to operational challenges. Yet, its P/E ratio is negative, suggesting market discounting, while a 3.18% dividend yield offers income appeal. The firm’s valuation appears cheaper, but weak profitability and coverage ratios raise red flags.
Premium Valuation vs. Income Appeal
KKR’s valuation is stretched but backed by stronger profitability metrics. Invesco offers a higher dividend yield amid weak earnings and operational risks. Investors prioritizing growth might lean toward KKR; income-focused investors may find Invesco’s yield more attractive despite its challenges.
Which one offers the Superior Shareholder Reward?
I compare KKR & Co. Inc. and Invesco Ltd. by their dividend yields, payout ratios, and buyback intensity. KKR yields 0.47% with a 20% payout ratio, reflecting conservative dividends supported by strong free cash flow (~7.3/share). Its buybacks have been moderate, balancing reinvestment and shareholder returns. Invesco offers a higher 3.18% yield but with payout ratios above 78%, signaling aggressive distribution that pressures cash flow sustainability. Invesco’s buybacks are less documented, indicating reliance on dividends for returns. I note KKR’s balanced approach better ensures long-term value amid market cycles, while Invesco’s model risks payout cuts if growth falters. For 2026, KKR offers a more sustainable, superior total return profile.
Comparative Score Analysis: The Strategic Profile
The radar chart reveals the fundamental DNA and trade-offs of KKR & Co. Inc. and Invesco Ltd., highlighting their core financial strengths and weaknesses:
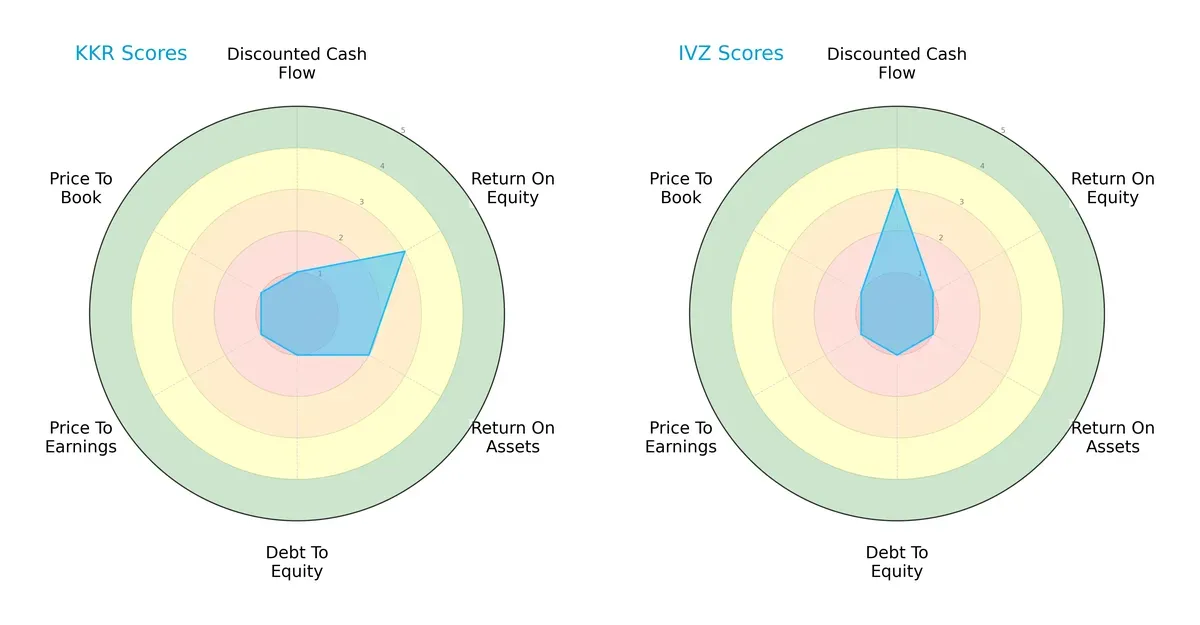
KKR leans on moderate returns with a ROE score of 3 and ROA of 2 but suffers from very unfavorable scores in discounted cash flow, debt/equity, and valuation metrics. Invesco shows strength in discounted cash flow (score 3) but underperforms on profitability and asset efficiency (ROE and ROA scores at 1). Both show very weak valuation and leverage profiles, but KKR’s balanced moderate profitability contrasts with Invesco’s reliance on cash flow projections.
Bankruptcy Risk: Solvency Showdown
KKR and Invesco both occupy the distress zone with Altman Z-Scores below 1, signaling a high risk of bankruptcy if adverse conditions persist:
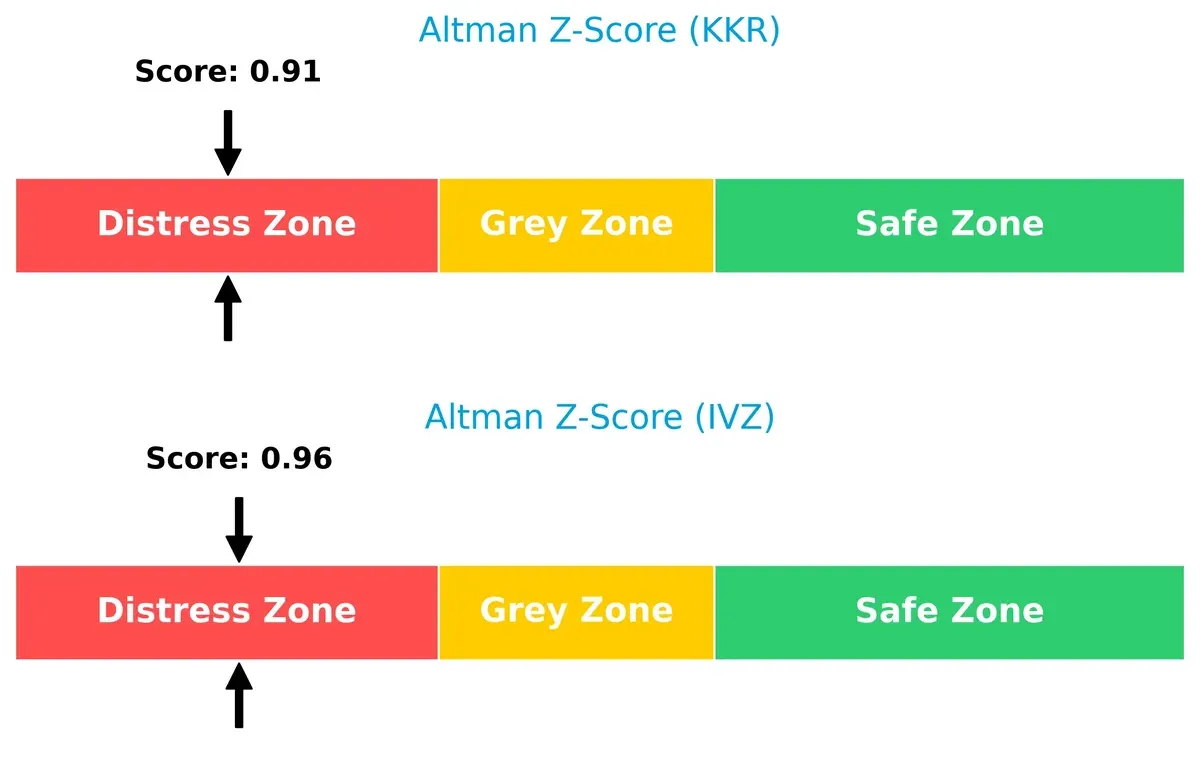
KKR’s 0.91 and Invesco’s 0.96 scores reflect fragile solvency. Historically, firms in this zone face significant default risks during economic downturns, demanding cautious portfolio positioning.
Financial Health: Quality of Operations
Invesco’s Piotroski score of 7 indicates stronger internal financial health compared to KKR’s 6, suggesting better operational quality and fewer red flags:
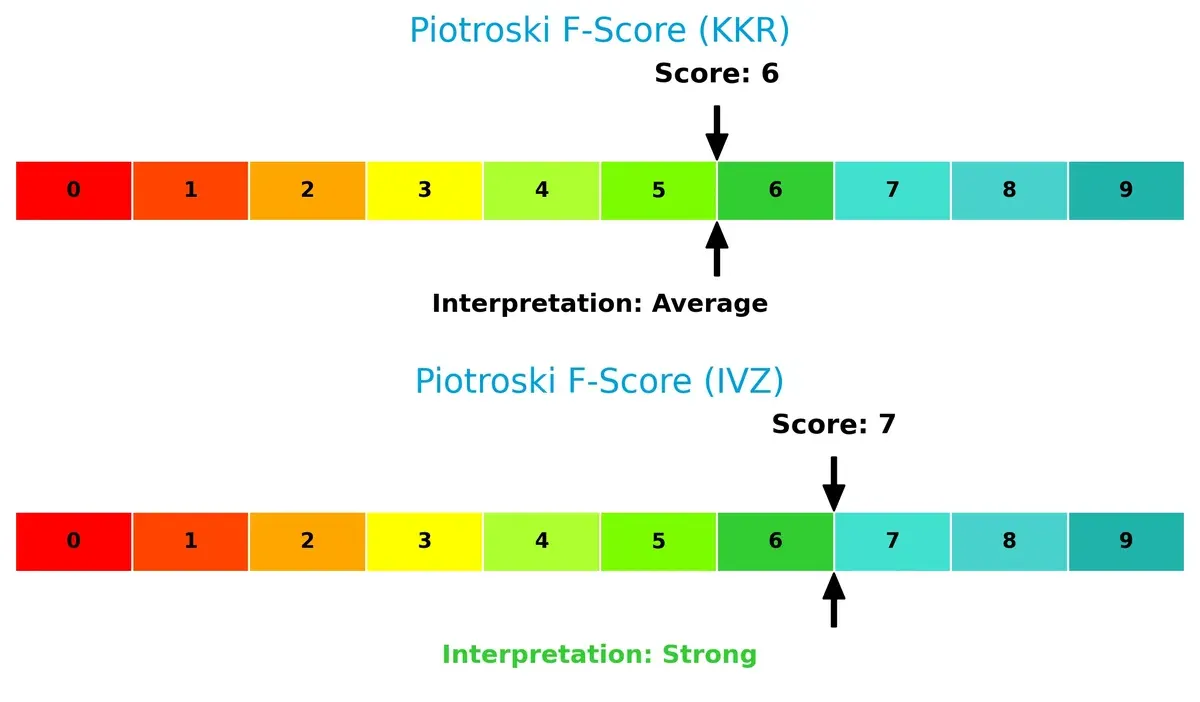
While neither scores in the very strong range, Invesco’s higher rating points to more robust profitability, liquidity, and efficiency metrics. KKR’s average score flags potential internal weaknesses investors must monitor closely.
How are the two companies positioned?
This section dissects the operational DNA of KKR and Invesco by comparing their revenue distribution and internal strengths and weaknesses. The goal is to confront their economic moats and identify which model offers the most resilient competitive advantage today.
Revenue Segmentation: The Strategic Mix
The following visual comparison dissects how KKR & Co. Inc. and Invesco Ltd. diversify their income streams and where their primary sector bets lie:
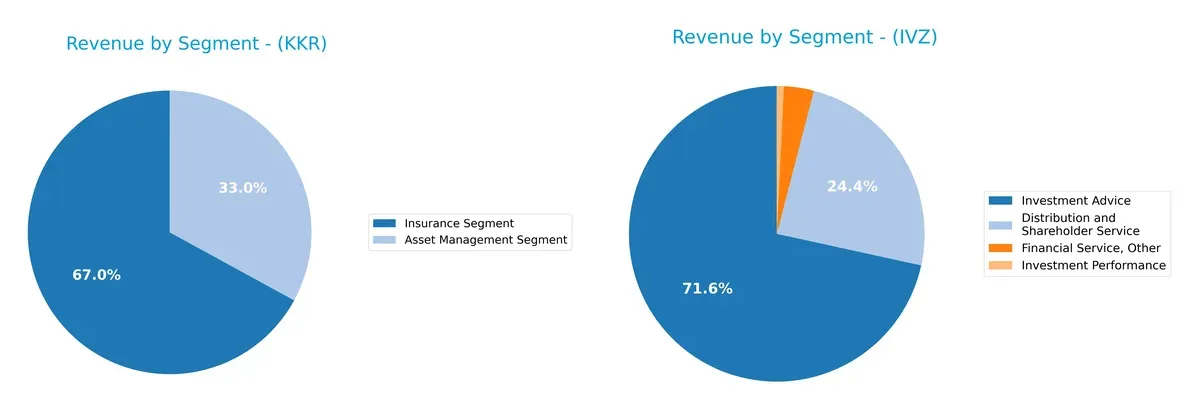
KKR anchors its revenue around the Insurance Segment, which dwarfs its Asset Management Segment at $14.7B versus $7.2B in 2024. Invesco leans heavily on Investment Advice, generating $4.3B, complemented by $1.5B from Distribution and Shareholder Service. KKR’s focus signals infrastructure dominance with concentration risk, while Invesco’s more balanced approach reflects diversified service offerings within investment management.
Strengths and Weaknesses Comparison
This table compares the strengths and weaknesses of KKR & Co. Inc. and Invesco Ltd. based on diversification, profitability, financial statement, innovation, global presence, and market share:
KKR Strengths
- Strong revenue from Asset Management and Insurance segments
- Favorable net margin at 14.22%
- Low debt-to-assets ratio at 14.11%
- High fixed asset turnover at 12.23
- Quick ratio indicates good liquidity
- Diversified fee income streams
IVZ Strengths
- Favorable price-to-earnings and price-to-book ratios
- Positive dividend yield at 3.18%
- Favorable debt-to-equity and debt-to-assets ratios indicate low leverage
- Significant global presence with revenues across Americas, Asia, EMEA
- Large investment advice revenue stream
- Steady distribution and shareholder services
KKR Weaknesses
- Unfavorable return on invested capital at 0.25% below WACC
- High price-to-earnings and price-to-book ratios suggest overvaluation
- High debt-to-equity ratio at 2.15
- Unfavorable current ratio of 4.12 may indicate asset structure issues
- Neutral interest coverage ratio at 2.77
- Unfavorable asset turnover at 0.06
IVZ Weaknesses
- Negative net margin at -11.39% and zero ROE/ROIC
- Unfavorable interest coverage ratio at -6.63
- Unfavorable liquidity ratios with zero current and quick ratios
- Unfavorable asset and fixed asset turnover ratios
- Reliance on a few revenue streams
- Global revenue concentration mainly in Americas
Overall, KKR exhibits strong segment diversification and liquidity but faces valuation and capital efficiency challenges. Invesco shows attractive valuation and global footprint but struggles with profitability and liquidity, highlighting contrasting strategic focuses.
The Moat Duel: Analyzing Competitive Defensibility
A structural moat is the only real shield protecting long-term profits from relentless competitive erosion. Let’s dissect how these firms defend their turf:
KKR & Co. Inc.: Diversified Asset Management Moat
KKR’s moat stems from its broad investment expertise and intangible assets like strong relationships and deal flow. Despite a declining ROIC, its margin stability and global reach offer room for expansion in emerging markets in 2026.
Invesco Ltd.: Scale and Product Breadth Moat
Invesco leverages scale and diversified product offerings to retain clients, contrasting KKR’s private equity focus. However, its shrinking ROIC and profitability raise concerns. Opportunities lie in expanding passive and ESG funds to regain footing.
Verdict: Diversification Depth vs. Scale Breadth
KKR’s deeper, relationship-driven moat trumps Invesco’s scale-based advantage, given KKR’s stronger margin profile despite recent value erosion. KKR is better equipped to defend market share amid rising competition and economic cycles.
Which stock offers better returns?
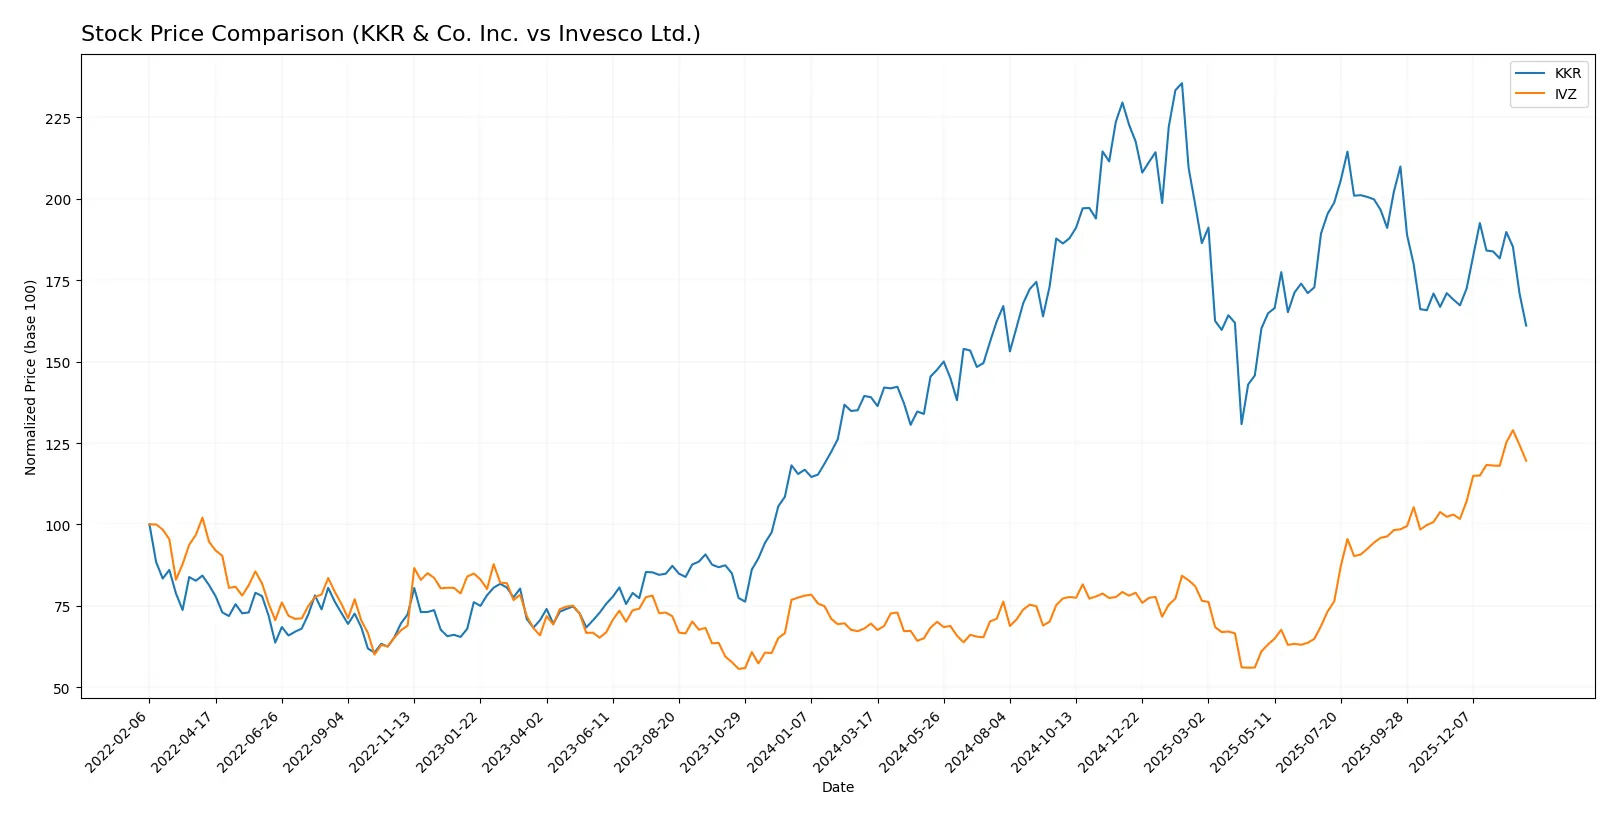
The past year reveals contrasting price dynamics: KKR’s stock gained steadily but slowed recently, while Invesco’s surged with accelerating momentum and stronger buyer dominance.
Trend Comparison
KKR’s stock rose 15.82% over the past year, marking a bullish trend with decelerating gains. The price ranged between 92.62 and 167.07, showing moderate volatility at 18.29%.
Invesco’s stock surged 71.85%, an accelerating bullish trend with a tighter price range from 12.78 to 29.44 and low volatility at 3.99%. Recent gains accelerated further by 16.03%.
Comparing both, Invesco delivered significantly higher returns with accelerating momentum, outperforming KKR’s more modest, decelerating gains.
Target Prices
Analysts present a bullish consensus for both KKR & Co. Inc. and Invesco Ltd., indicating potential upside from current prices.
| Company | Target Low | Target High | Consensus |
|---|---|---|---|
| KKR & Co. Inc. | 144 | 190 | 165.33 |
| Invesco Ltd. | 24 | 34.5 | 29.8 |
KKR’s target consensus sits about 45% above its current price of 114.26, signaling strong growth expectations. Invesco’s consensus target is slightly above its 27.29 market price, pointing to moderate upside potential.

Don’t Let Luck Decide Your Entry Point
Optimize your entry points with our advanced ProRealTime indicators. You’ll get efficient buy signals with precise price targets for maximum performance. Start outperforming now!
How do institutions grade them?
KKR & Co. Inc. Grades
The table below summarizes recent grades from major financial institutions for KKR & Co. Inc.:
| Grading Company | Action | New Grade | Date |
|---|---|---|---|
| TD Cowen | Downgrade | Hold | 2026-01-14 |
| UBS | Maintain | Buy | 2026-01-13 |
| Barclays | Maintain | Overweight | 2026-01-09 |
| Barclays | Maintain | Overweight | 2025-12-12 |
| Barclays | Maintain | Overweight | 2025-11-11 |
| TD Cowen | Maintain | Buy | 2025-11-10 |
| Oppenheimer | Maintain | Outperform | 2025-11-10 |
| Morgan Stanley | Maintain | Overweight | 2025-10-21 |
| Oppenheimer | Maintain | Outperform | 2025-10-14 |
| Citigroup | Maintain | Buy | 2025-10-13 |
Invesco Ltd. Grades
The following table shows recent institutional grades for Invesco Ltd.:
| Grading Company | Action | New Grade | Date |
|---|---|---|---|
| Goldman Sachs | Maintain | Neutral | 2026-01-28 |
| Barclays | Maintain | Equal Weight | 2026-01-28 |
| RBC Capital | Maintain | Outperform | 2026-01-28 |
| Argus Research | Maintain | Buy | 2026-01-28 |
| RBC Capital | Upgrade | Outperform | 2026-01-21 |
| JP Morgan | Maintain | Neutral | 2026-01-20 |
| Barclays | Maintain | Equal Weight | 2026-01-15 |
| Deutsche Bank | Upgrade | Buy | 2025-12-17 |
| Morgan Stanley | Maintain | Equal Weight | 2025-12-17 |
| Barclays | Maintain | Equal Weight | 2025-12-12 |
Which company has the best grades?
KKR & Co. Inc. holds mostly Buy and Overweight ratings, with one recent downgrade to Hold. Invesco Ltd. features a mix of Neutral, Equal Weight, and Outperform grades, with some upgrades to Buy and Outperform. Investors may view KKR’s grades as slightly more bullish, but recent downgrades suggest caution. Invesco’s consistent upgrades indicate improving sentiment, balancing the comparison.
Risks specific to each company
The following categories identify the critical pressure points and systemic threats facing both firms in the 2026 market environment:
1. Market & Competition
KKR & Co. Inc.
- Competes globally in private equity and diversified asset classes with strong focus on mid to large market buyouts.
Invesco Ltd.
- Operates mainly in public equity and fixed income management with broad client base but faces intense ETF and mutual fund competition.
2. Capital Structure & Debt
KKR & Co. Inc.
- High debt-to-equity ratio of 2.15 signals elevated leverage risk despite manageable debt-to-assets at 14.11%.
Invesco Ltd.
- Low or zero reported debt metrics, suggesting conservative leverage but possibly limited growth financing.
3. Stock Volatility
KKR & Co. Inc.
- Beta near 2.0 indicates high sensitivity to market swings, increasing investment risk.
Invesco Ltd.
- Beta of 1.63 signals somewhat less volatility but still above market average.
4. Regulatory & Legal
KKR & Co. Inc.
- Exposure to complex regulations across multiple jurisdictions due to global private equity and infrastructure investments.
Invesco Ltd.
- Subject to financial services regulations; must manage compliance risks in retail and institutional asset management.
5. Supply Chain & Operations
KKR & Co. Inc.
- Operational risk linked to portfolio company performance and fund management execution.
Invesco Ltd.
- Operational risk centers on investment process integrity and fund distribution capabilities.
6. ESG & Climate Transition
KKR & Co. Inc.
- Active impact investing focus but must navigate transition risks in energy and infrastructure sectors.
Invesco Ltd.
- ESG integration is critical amid rising investor demands; underperformance on ESG could deter clients.
7. Geopolitical Exposure
KKR & Co. Inc.
- Broad international presence exposes KKR to geopolitical volatility in emerging and developed markets.
Invesco Ltd.
- Geopolitical risk concentrated in global public markets and client jurisdictions but less operational footprint overseas.
Which company shows a better risk-adjusted profile?
KKR’s most impactful risk is its elevated leverage and related capital structure vulnerability. Invesco struggles with negative profitability and financial distress indicators. Despite KKR’s high beta, its diversified portfolio and stronger operating margins suggest a marginally better risk-adjusted profile. Notably, KKR’s quick ratio above 4 signals liquidity strength, contrasting with Invesco’s deficient current and quick ratios. This liquidity buffer partially mitigates KKR’s leverage risk, while Invesco’s financial distress scores warrant heightened caution.
Final Verdict: Which stock to choose?
KKR’s superpower lies in its ability to generate strong net margins and maintain bullish momentum despite a challenging environment. However, its declining ROIC and high leverage warrant vigilance. It suits portfolios aiming for aggressive growth with a tolerance for capital structure risk.
Invesco’s moat centers on disciplined cost control and a steadily improving free cash flow yield, offering relative safety compared to KKR’s leverage. Its accelerating price trend and dividend yield appeal to GARP investors seeking stability blended with moderate growth potential.
If you prioritize high-growth exposure and can manage leverage risks, KKR outshines with its operational efficiency and growth runway. However, if you seek better stability and income with a more cautious risk profile, Invesco offers a superior balance of cash flow generation and valuation appeal. Both present analytical scenarios for distinct investor profiles.
Disclaimer: Investment carries a risk of loss of initial capital. The past performance is not a reliable indicator of future results. Be sure to understand risks before making an investment decision.
Go Further
I encourage you to read the complete analyses of KKR & Co. Inc. and Invesco Ltd. to enhance your investment decisions: