In the dynamic world of software applications, Intuit Inc. and Workday, Inc. stand out as influential players driving innovation and digital transformation. Both companies operate in overlapping markets, offering cloud-based solutions that enhance financial management and business operations for diverse clients. This comparison explores their strategic approaches and growth potential, helping you decide which stock might best complement your investment portfolio in 2026.

Table of contents
Companies Overview
I will begin the comparison between Intuit and Workday by providing an overview of these two companies and their main differences.
Intuit Overview
Intuit Inc. specializes in financial management and compliance products for consumers, small businesses, and accounting professionals across multiple countries. It operates four segments: Small Business & Self-Employed, Consumer, Credit Karma, and ProConnect, offering solutions like QuickBooks, TurboTax, and personal finance platforms. Founded in 1983, Intuit is headquartered in Mountain View, California, with a market cap of $175B and a strong presence in software applications.
Workday Overview
Workday, Inc. provides enterprise cloud applications focused on financial management, human capital management, spend management, and analytics. Its solutions help customers streamline business operations, improve financial processes, and manage the employee lifecycle. Founded in 2005 and based in Pleasanton, California, Workday serves diverse industries globally and holds a market cap of around $55B, positioning itself as a key player in cloud-based business management software.
Key similarities and differences
Both Intuit and Workday operate in the software application industry with a focus on business management solutions, though Intuit targets small businesses and consumers while Workday focuses on enterprise clients. Intuit offers a mix of financial, tax, and payroll software, whereas Workday emphasizes cloud applications for finance, HR, and spend management. Their market caps and employee counts differ significantly, reflecting their scale and customer base diversity.
Income Statement Comparison
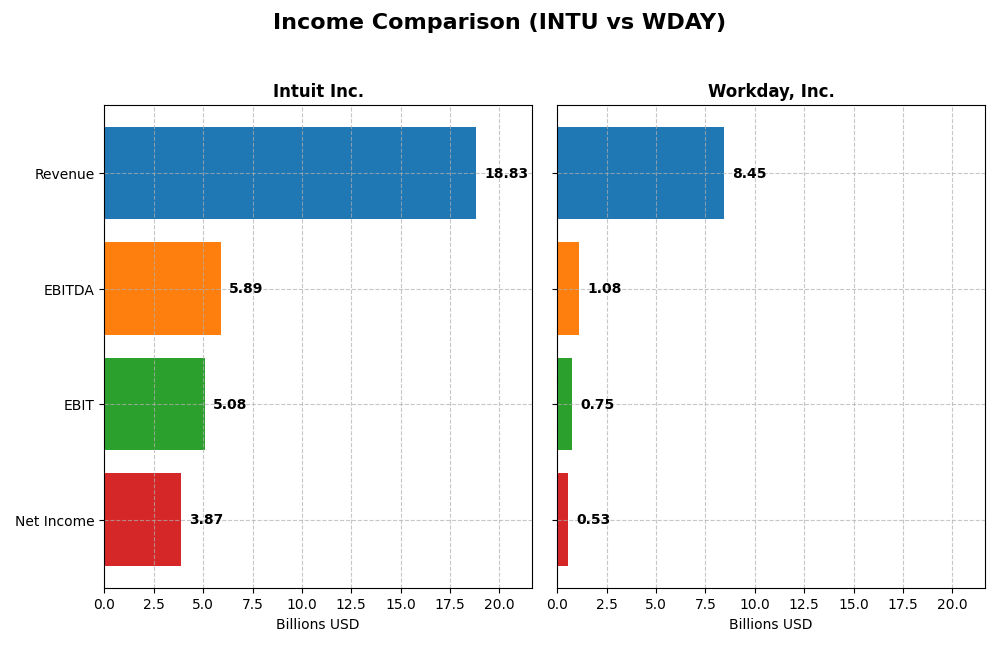
This table provides a factual comparison of key income statement metrics for Intuit Inc. and Workday, Inc. based on their most recent fiscal year data.
| Metric | Intuit Inc. (INTU) | Workday, Inc. (WDAY) |
|---|---|---|
| Market Cap | 175.2B | 54.9B |
| Revenue | 18.83B | 8.45B |
| EBITDA | 5.89B | 1.08B |
| EBIT | 5.08B | 752M |
| Net Income | 3.87B | 526M |
| EPS | 13.82 | 1.98 |
| Fiscal Year | 2025 | 2025 |
Income Statement Interpretations
Intuit Inc.
Intuit’s revenue and net income have shown strong growth from 2021 to 2025, with revenue nearly doubling to $18.8B and net income rising to $3.87B. Gross and EBIT margins remain robust and favorable, around 80.8% and 27%, respectively. In 2025, revenue growth accelerated by 15.63%, supported by a 33.99% increase in EBIT, while net margin remained strong at 20.55%.
Workday, Inc.
Workday’s revenue increased steadily to $8.45B in 2025, with net income also expanding significantly over five years, reaching $526M. Gross margin is favorable at 75.5%, but EBIT margin is neutral at 8.9%, reflecting higher operating costs. Despite a 16.35% revenue growth in 2025, net margin and EPS declined sharply, indicating margin pressure recently.
Which one has the stronger fundamentals?
Intuit shows consistently higher margins and healthier profitability metrics, with nearly 93% of income statement indicators favorable and steady margin expansion. Workday exhibits impressive revenue and net income growth but suffers from margin volatility and some unfavorable recent EPS trends. Intuit’s more stable and efficient income profile suggests stronger fundamentals overall.
Financial Ratios Comparison
The table below compares the most recent key financial ratios for Intuit Inc. and Workday, Inc., providing a snapshot of their profitability, liquidity, leverage, and market valuation.
| Ratios | Intuit Inc. (INTU) FY 2025 | Workday, Inc. (WDAY) FY 2025 |
|---|---|---|
| ROE | 19.6% | 5.8% |
| ROIC | 14.8% | 2.7% |
| P/E | 56.8 | 132.2 |
| P/B | 11.2 | 7.7 |
| Current Ratio | 1.36 | 1.85 |
| Quick Ratio | 1.36 | 1.85 |
| D/E (Debt-to-Equity) | 0.34 | 0.37 |
| Debt-to-Assets | 18.0% | 18.7% |
| Interest Coverage | 19.9 | 3.6 |
| Asset Turnover | 0.51 | 0.47 |
| Fixed Asset Turnover | 12.5 | 5.4 |
| Payout Ratio | 30.7% | 0% |
| Dividend Yield | 0.54% | 0% |
Interpretation of the Ratios
Intuit Inc.
Intuit’s financial ratios are mostly strong, with favorable returns on equity (19.63%), invested capital (14.78%), and net margin (20.55%). Its debt levels and interest coverage are well managed, though valuation multiples like P/E (56.82) and P/B (11.15) appear high. The company pays a dividend with a modest yield of 0.54%, supported by free cash flow and buyback programs, but the low yield and payout levels may warrant monitoring.
Workday, Inc.
Workday shows mixed financial ratios, with weaker profitability metrics such as ROE (5.82%) and ROIC (2.73%) signaling challenges. Its liquidity and solvency ratios, including a current ratio of 1.85 and favorable debt levels, remain solid. Workday does not pay dividends, likely due to its reinvestment focus and growth phase, prioritizing R&D and acquisitions over shareholder payouts.
Which one has the best ratios?
Intuit demonstrates a more favorable overall ratio profile, balancing strong profitability and solvency with moderate risk. Workday’s ratios reflect a company still investing heavily in growth, with less attractive profitability and valuation metrics. The higher proportion of favorable ratios for Intuit suggests it currently holds a stronger financial position compared to Workday.
Strategic Positioning
This section compares the strategic positioning of Intuit Inc. and Workday, Inc. in terms of Market position, Key segments, and Exposure to technological disruption:
Intuit Inc.
- Large market cap of $175B with established presence in financial management software, facing moderate competitive pressure.
- Diverse revenue streams: Small Business, Consumer, Credit Karma, and Professional Tax segments drive growth.
- Operates in financial management and compliance software with cloud-based and desktop solutions; exposed to cloud tech.
Workday, Inc.
- Mid-sized market cap of $55B, focused on enterprise cloud applications with competition in SaaS.
- Concentrated revenue mainly from Subscription Services and Professional Services in enterprise apps.
- Cloud-native enterprise applications with augmented analytics and machine learning integration.
Intuit Inc. vs Workday, Inc. Positioning
Intuit has a diversified business model across various financial software segments, offering stability but complexity. Workday focuses on concentrated enterprise cloud applications, enabling targeted innovation but higher segment risk.
Which has the best competitive advantage?
Intuit demonstrates a slightly favorable moat with value creation despite declining profitability, while Workday shows a slightly unfavorable moat, destroying value but improving profitability, indicating Intuit currently holds a stronger competitive advantage.
Stock Comparison
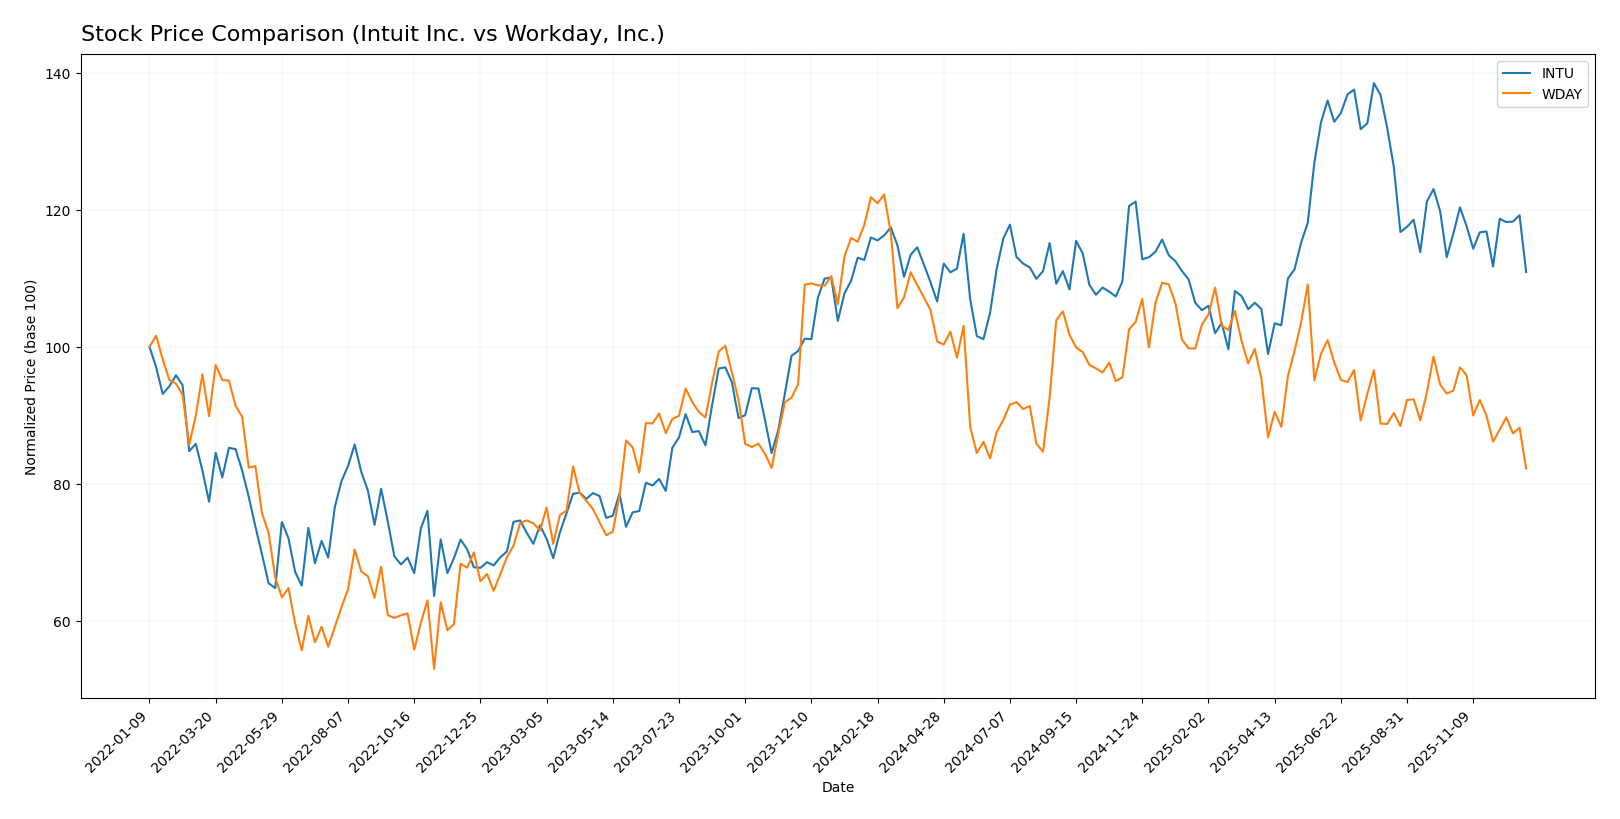
The stock price chart highlights contrasting bearish trends for Intuit Inc. and Workday, Inc. over the past year, with Intuit showing a moderate decline and Workday facing a more severe drop amid decelerating price movements.
Trend Analysis
Intuit Inc. (INTU) experienced a bearish trend over the past 12 months with a price decline of -4.36%, showing deceleration and a high price volatility indicated by a standard deviation of 50.42. The stock peaked at 785.95 and fell to a low of 561.53.
Workday, Inc. (WDAY) recorded a stronger bearish trend with a -32.5% price change over the same period, also decelerating. Its volatility was lower than Intuit’s, with a standard deviation of 20.93, reaching a high of 305.88 and a low of 205.79.
Comparing both stocks, Intuit delivered the higher market performance with a smaller negative price change, while Workday’s stock showed a more pronounced decline and weaker recent trend.
Target Prices
Analysts present a cautiously optimistic consensus for Intuit Inc. and Workday, Inc., suggesting potential upside from current prices.
| Company | Target High | Target Low | Consensus |
|---|---|---|---|
| Intuit Inc. | 880 | 725 | 818.75 |
| Workday, Inc. | 320 | 235 | 277.06 |
For Intuit, the consensus target price of 818.75 is significantly above the current price of 629.46, indicating expected growth. Workday’s consensus target of 277.06 also suggests upside potential from its current 205.79 price, reflecting positive analyst sentiment.
Analyst Opinions Comparison
This section compares analysts’ ratings and grades for Intuit Inc. and Workday, Inc.:
Rating Comparison
Intuit Inc. Rating
- Rating: B, classified as Very Favorable.
- Discounted Cash Flow Score: 4, Favorable valuation.
- Return on Equity Score: 4, Favorable profitability.
- Return on Assets Score: 5, Very Favorable asset use.
- Debt To Equity Score: 2, Moderate financial risk.
- Overall Score: 3, Moderate overall financial health.
Workday, Inc. Rating
- Rating: B-, classified as Very Favorable.
- Discounted Cash Flow Score: 4, Favorable valuation.
- Return on Equity Score: 3, Moderate profitability.
- Return on Assets Score: 3, Moderate asset use.
- Debt To Equity Score: 2, Moderate financial risk.
- Overall Score: 2, Moderate overall financial health.
Which one is the best rated?
Intuit holds higher scores in return on equity and assets, and a better overall score compared to Workday. Both share the same discounted cash flow and debt to equity scores. Intuit is thus better rated based on these metrics.
Scores Comparison
The comparison of Intuit and Workday scores highlights their financial stability and strength as follows:
Intuit Scores
- Altman Z-Score of 10.07 indicates strong financial safety.
- Piotroski Score of 9 reflects very strong financial health.
Workday Scores
- Altman Z-Score of 4.82 shows the company is in a safe zone.
- Piotroski Score of 6 indicates average financial strength.
Which company has the best scores?
Based on the provided data, Intuit demonstrates superior scores with a higher Altman Z-Score and a very strong Piotroski Score, compared to Workday’s safe zone status and average Piotroski rating.
Grades Comparison
Here is the detailed comparison of the latest grades assigned to Intuit Inc. and Workday, Inc.:
Intuit Inc. Grades
This table summarizes recent grades from reputable grading companies for Intuit Inc.:
| Grading Company | Action | New Grade | Date |
|---|---|---|---|
| BMO Capital | Maintain | Outperform | 2025-11-21 |
| RBC Capital | Maintain | Outperform | 2025-11-21 |
| Wells Fargo | Maintain | Overweight | 2025-11-21 |
| Evercore ISI Group | Maintain | Outperform | 2025-11-18 |
| RBC Capital | Maintain | Outperform | 2025-09-02 |
| B of A Securities | Maintain | Buy | 2025-08-22 |
| Barclays | Maintain | Overweight | 2025-08-22 |
| RBC Capital | Maintain | Outperform | 2025-08-22 |
| JP Morgan | Maintain | Overweight | 2025-08-22 |
| Citigroup | Maintain | Buy | 2025-08-22 |
Intuit’s grades consistently indicate strong positive sentiment with repeated “Outperform,” “Overweight,” and “Buy” ratings across multiple reputable firms.
Workday, Inc. Grades
This table presents recent grades from recognized grading companies for Workday, Inc.:
| Grading Company | Action | New Grade | Date |
|---|---|---|---|
| Bernstein | Maintain | Outperform | 2025-11-26 |
| DA Davidson | Maintain | Neutral | 2025-11-26 |
| Barclays | Maintain | Overweight | 2025-11-26 |
| TD Cowen | Maintain | Buy | 2025-11-26 |
| Keybanc | Maintain | Overweight | 2025-11-26 |
| JP Morgan | Maintain | Overweight | 2025-11-26 |
| UBS | Maintain | Neutral | 2025-11-26 |
| Citigroup | Maintain | Neutral | 2025-11-26 |
| RBC Capital | Maintain | Outperform | 2025-11-26 |
| Wells Fargo | Maintain | Overweight | 2025-11-26 |
Workday’s grades show a mixed but overall positive outlook, with several “Overweight,” “Buy,” and “Outperform” ratings balanced by multiple “Neutral” evaluations.
Which company has the best grades?
Intuit Inc. exhibits a stronger consensus with more frequent high ratings such as “Outperform” and “Buy” compared to Workday’s more mixed grades that include several “Neutral” ratings. This suggests Intuit is perceived with higher confidence, potentially indicating a more favorable risk-return profile for investors.
Strengths and Weaknesses
Below is a comparison of Intuit Inc. and Workday, Inc. based on key investment criteria using the most recent 2025 data and financial evaluations.
| Criterion | Intuit Inc. (INTU) | Workday, Inc. (WDAY) |
|---|---|---|
| Diversification | Highly diversified with Consumer (4.87B), Global Business Solutions (11.08B), Credit Karma (2.26B), and Professional Tax segments | Less diversified; mainly Subscription Services (7.72B) and Professional Services (728M) |
| Profitability | Strong profitability: net margin 20.55%, ROIC 14.78%, ROE 19.63% (all favorable) | Moderate profitability: net margin 6.23% (neutral), ROIC 2.73%, ROE 5.82% (both unfavorable) |
| Innovation | Consistent value creation with slightly declining ROIC trend, indicating some margin pressure | Improving ROIC trend but overall value destruction, signaling growth potential but current inefficiencies |
| Global presence | Global business solutions segment dominates revenue, implying broad international reach | Subscription services growth indicates expanding footprint, but less global diversification |
| Market Share | Large market share in financial and tax software markets with multiple strong segments | Growing market share in cloud-based enterprise software but with higher valuation multiples and risk |
Key takeaways: Intuit shows stable profitability and diversification with a slight decline in capital efficiency, making it a safer, value-creating investment. Workday offers growth potential through improving ROIC but currently sheds value, suggesting higher risk and a need for caution.
Risk Analysis
Below is a comparative risk overview for Intuit Inc. and Workday, Inc. based on the latest 2025 data:
| Metric | Intuit Inc. (INTU) | Workday, Inc. (WDAY) |
|---|---|---|
| Market Risk | Beta 1.267, moderately volatile | Beta 1.151, slightly less volatile |
| Debt level | Debt/Equity 0.34, favorable | Debt/Equity 0.37, favorable |
| Regulatory Risk | Moderate, financial software subject to tax and data regulations | Moderate, cloud enterprise software with data privacy considerations |
| Operational Risk | Medium, reliant on software innovation and integration | Medium-high, dependency on cloud infrastructure and customer retention |
| Environmental Risk | Low, limited direct environmental impact | Low, primarily software-based operations |
| Geopolitical Risk | Moderate, global operations including Canada and international markets | Moderate, global enterprise customer base sensitive to geopolitical tensions |
Intuit faces notable market risk with a higher beta and premium valuation metrics, while Workday’s lower profitability ratios and dependency on cloud infrastructure elevate its operational risk. Both companies maintain moderate debt levels and face regulatory scrutiny typical of tech firms, but Intuit’s stronger financial health and risk scores suggest a more resilient profile.
Which Stock to Choose?
Intuit Inc. (INTU) shows a favorable income evolution with 15.63% revenue growth in 2025 and strong profitability indicators, including a 20.55% net margin and 19.63% ROE. Its financial ratios are mostly favorable, with low debt levels and a very favorable rating.
Workday, Inc. (WDAY) records a solid revenue growth of 16.35% in 2025 but displays moderate profitability, with a 6.23% net margin and 5.82% ROE. Its financial ratios are mixed, featuring higher debt relative to earnings and a neutral overall rating.
For investors, INTU might appear more favorable given its higher profitability and stronger financial ratios, suggesting suitability for those prioritizing quality and stability. WDAY’s improving profitability and growth could appeal to more risk-tolerant investors focused on growth potential despite current challenges.
Disclaimer: Investment carries a risk of loss of initial capital. The past performance is not a reliable indicator of future results. Be sure to understand risks before making an investment decision.
Go Further
I encourage you to read the complete analyses of Intuit Inc. and Workday, Inc. to enhance your investment decisions: