In today’s dynamic tech landscape, Intuit Inc. and Unity Software Inc. stand out as leaders in software innovation, albeit in distinct yet increasingly overlapping domains. Intuit excels in financial management solutions for individuals and businesses, while Unity pioneers interactive real-time 3D content platforms. Their shared commitment to technology-driven growth makes them compelling subjects for comparison. Join me as we analyze which company offers the most promising opportunity for your investment portfolio.
Table of contents
Companies Overview
I will begin the comparison between Intuit and Unity Software by providing an overview of these two companies and their main differences.
Intuit Overview
Intuit Inc. specializes in financial management and compliance products for consumers, small businesses, and accounting professionals across multiple countries. Operating through segments like Small Business & Self-Employed, Consumer, Credit Karma, and ProConnect, Intuit offers software solutions such as QuickBooks and TurboTax, alongside payment processing and personal finance services. The company is headquartered in Mountain View, California, and employs around 18,800 people.
Unity Software Overview
Unity Software Inc. develops an interactive real-time 3D content platform that supports creators and developers in producing content for devices including mobiles, PCs, consoles, and AR/VR systems. Founded in 2004 and based in San Francisco, Unity markets its software solutions globally via direct sales, distributors, and resellers. The company employs approximately 5,000 staff and focuses on enabling interactive 2D and 3D content across various industries.
Key similarities and differences
Both Intuit and Unity operate in the technology sector within the software application industry. While Intuit focuses on financial management and compliance products targeting businesses and consumers, Unity concentrates on real-time 3D content creation platforms for content developers and designers. Intuit’s business model includes diversified financial software and services, whereas Unity primarily offers software tools for interactive content creation and monetization. Their geographic reach and customer bases also differ, with Intuit serving financial markets and Unity catering to creative and gaming industries.
Income Statement Comparison
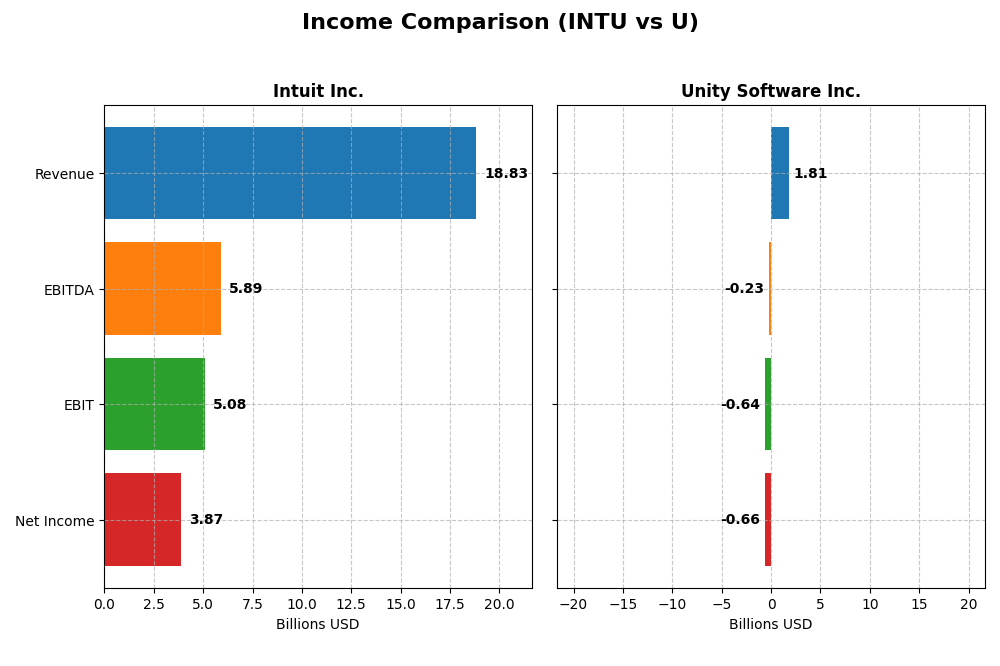
This table presents a side-by-side comparison of key income statement metrics for Intuit Inc. and Unity Software Inc. for their most recent fiscal years.
| Metric | Intuit Inc. (INTU) | Unity Software Inc. (U) |
|---|---|---|
| Market Cap | 151.5B | 17.9B |
| Revenue | 18.8B | 1.81B |
| EBITDA | 5.89B | -235M |
| EBIT | 5.08B | -644M |
| Net Income | 3.87B | -664M |
| EPS | 13.82 | -1.68 |
| Fiscal Year | 2025 | 2024 |
Income Statement Interpretations
Intuit Inc.
Intuit’s revenue showed a strong upward trend from $9.63B in 2021 to $18.83B in 2025, nearly doubling over five years. Net income followed a similar pattern, rising from $2.06B to $3.87B. Margins remained robust, with a gross margin around 81% and net margin above 20% in 2025. The latest fiscal year saw favorable growth in revenue (+15.6%) and net income (+13%), alongside margin stability.
Unity Software Inc.
Unity’s revenue increased from $772M in 2020 to $2.18B in 2023 before declining to $1.81B in 2024. Despite revenue growth over the longer term, net income remained negative, reaching -$664M in 2024. Gross margin was decent at 73%, but negative EBIT and net margins reflected ongoing losses. The latest year showed a revenue drop of -17.1% and reduced gross profit, though EPS improved by 22%.
Which one has the stronger fundamentals?
Intuit exhibits stronger fundamentals with consistent revenue and net income growth, high gross and net margins, and favorable operating efficiency. Conversely, Unity, despite its revenue growth history, struggles with sustained losses and negative profitability metrics. Its recent revenue decline and unfavorable margin trends contrast with Intuit’s solid profitability and margin improvements.
Financial Ratios Comparison
This table presents a side-by-side comparison of key financial ratios for Intuit Inc. and Unity Software Inc. based on their most recent fiscal year data, providing insight into their operational efficiency, profitability, liquidity, and leverage.
| Ratios | Intuit Inc. (INTU, FY 2025) | Unity Software Inc. (U, FY 2024) |
|---|---|---|
| ROE | 19.63% | -20.81% |
| ROIC | 14.78% | -12.78% |
| P/E | 56.82 | -13.40 |
| P/B | 11.15 | 2.79 |
| Current Ratio | 1.36 | 2.50 |
| Quick Ratio | 1.36 | 2.50 |
| D/E (Debt-to-Equity) | 0.34 | 0.74 |
| Debt-to-Assets | 18.0% | 34.9% |
| Interest Coverage | 19.93 | -32.08 |
| Asset Turnover | 0.51 | 0.27 |
| Fixed Asset Turnover | 12.54 | 18.35 |
| Payout Ratio | 30.7% | 0% |
| Dividend Yield | 0.54% | 0% |
Interpretation of the Ratios
Intuit Inc.
Intuit’s financial ratios mostly indicate strength, with favorable net margin (20.55%), ROE (19.63%), and ROIC (14.78%). The company shows a solid interest coverage (20.57) and manageable debt levels, though its high P/E (56.82) and P/B (11.15) ratios suggest premium valuation. Dividend yield is low (0.54%), supported by consistent payouts and buybacks covered by free cash flow, posing limited distribution risk.
Unity Software Inc.
Unity’s ratios reveal weaknesses, including a negative net margin (-36.63%), ROE (-20.81%), and ROIC (-12.78%), reflecting ongoing losses and operational challenges. Despite a solid current ratio (2.5) and quick ratio (2.5), high debt and negative interest coverage (-27.34) raise concerns. The company does not pay dividends, likely due to reinvestment in growth and R&D, with no share buyback programs evident.
Which one has the best ratios?
Intuit presents a more favorable ratio profile overall, with strong profitability, efficient asset use, and controlled leverage. Unity’s ratios reflect financial strain and unprofitability, though it maintains liquidity. Considering the balance of favorable versus unfavorable metrics, Intuit’s financial health and performance ratios are comparatively superior in this analysis.
Strategic Positioning
This section compares the strategic positioning of Intuit and Unity Software in terms of market position, key segments, and exposure to technological disruption:
Intuit Inc.
- Leading financial management software provider with significant market cap and moderate beta.
- Diverse segments: Small Business, Consumer, Credit Karma, and Professional Tax driving revenue.
- Operates in established software applications with some exposure to evolving payment and financial tech.
Unity Software Inc.
- Interactive real-time 3D content platform provider with smaller market cap and higher beta.
- Focused on Create and Operate Solutions for 2D/3D content creators and developers globally.
- Positioned in cutting-edge 3D and AR/VR software, facing rapid technological change potential.
Intuit Inc. vs Unity Software Inc. Positioning
Intuit pursues a diversified strategy across multiple financial software segments, offering stability and broad revenue streams. Unity focuses on interactive 3D content creation platforms, which may yield high growth but carries concentrated market risks and technological volatility.
Which has the best competitive advantage?
Intuit exhibits a slightly favorable moat by creating value despite declining profitability. Unity shows a very unfavorable moat, shedding value with decreasing returns, indicating Intuit currently holds a stronger competitive advantage.
Stock Comparison
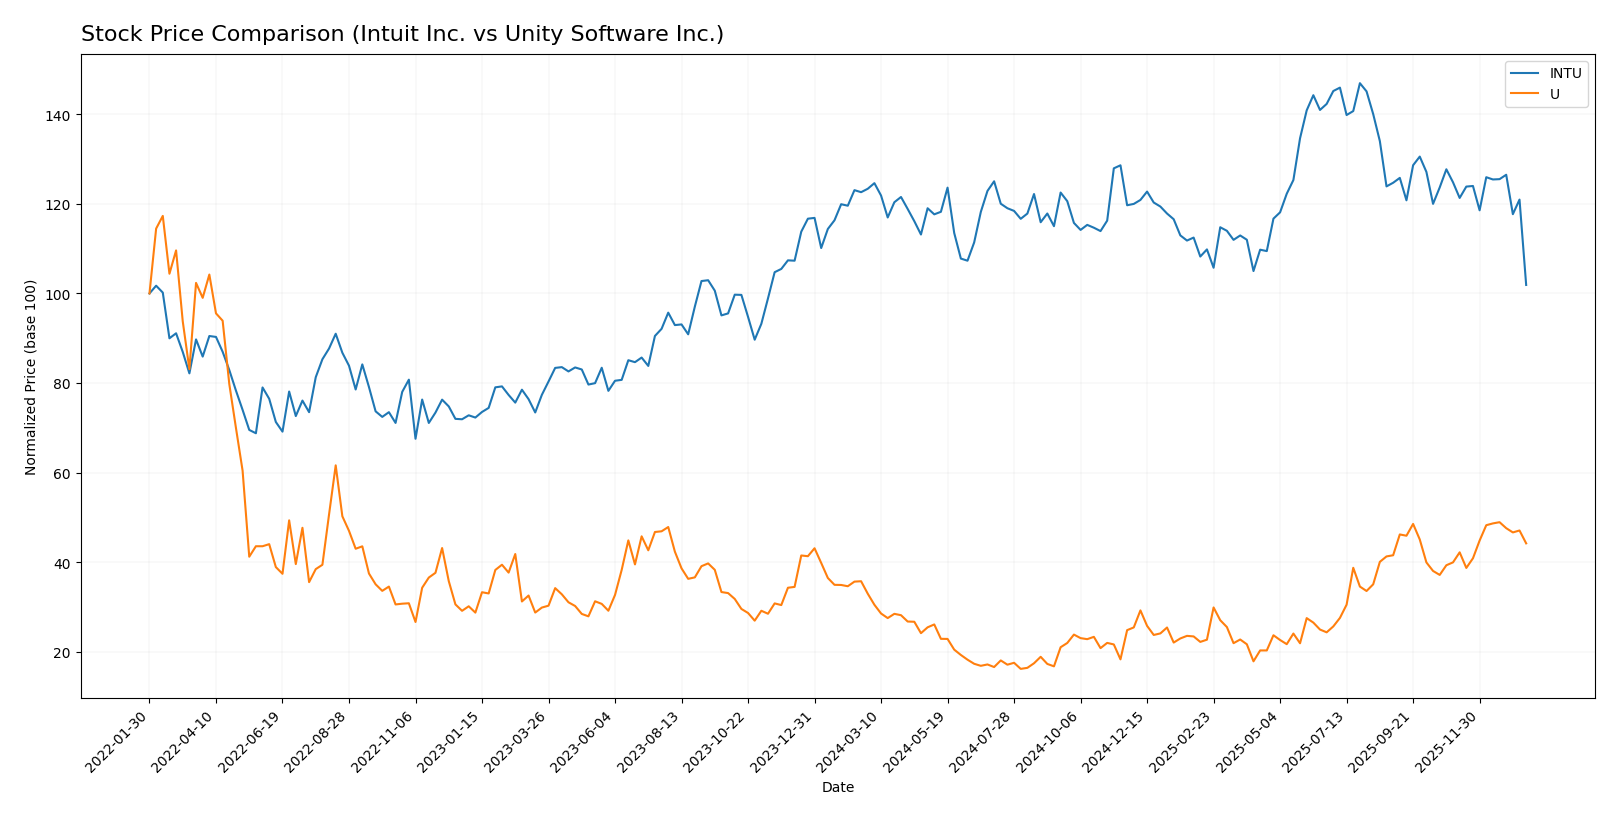
The past year shows contrasting stock price movements for Intuit Inc. and Unity Software Inc., with Intuit experiencing a significant decline and Unity demonstrating notable gains and accelerated growth.
Trend Analysis
Intuit Inc. (INTU) exhibited a bearish trend over the past 12 months with a price decrease of 17.41%, characterized by deceleration and high volatility, ranging from a high of 785.95 to a low of 544.93.
Unity Software Inc. (U) showed a bullish trend with a 34.13% price increase over the same period, marked by acceleration and lower volatility, with prices moving between 15.32 and 46.42.
Comparing both, Unity Software delivered the highest market performance with a strong upward trend, while Intuit faced a significant downward trajectory.
Target Prices
Analysts present a positive consensus on target prices for Intuit Inc. and Unity Software Inc.
| Company | Target High | Target Low | Consensus |
|---|---|---|---|
| Intuit Inc. | 880 | 700 | 798.4 |
| Unity Software Inc. | 60 | 39 | 50.98 |
The target consensus for Intuit Inc. significantly exceeds its current price of 544.06 USD, suggesting considerable upside potential. Unity Software’s target consensus at 50.98 USD also indicates expected growth from its current 41.83 USD price, reflecting generally optimistic analyst expectations.
Analyst Opinions Comparison
This section compares analysts’ ratings and grades for Intuit Inc. and Unity Software Inc.:
Rating Comparison
Intuit Inc. Rating
- Rating: B, considered very favorable overall.
- Discounted Cash Flow Score: 4, a favorable score indicating good valuation.
- ROE Score: 4, favorable efficiency in generating profit from equity.
- ROA Score: 5, very favorable asset utilization.
- Debt To Equity Score: 2, moderate financial risk level.
- Overall Score: 3, a moderate overall financial standing.
Unity Software Inc. Rating
- Rating: D+, also marked as very favorable overall.
- Discounted Cash Flow Score: 1, very unfavorable valuation score.
- ROE Score: 1, very unfavorable efficiency.
- ROA Score: 1, very unfavorable asset utilization.
- Debt To Equity Score: 1, very unfavorable financial risk.
- Overall Score: 1, very unfavorable overall standing.
Which one is the best rated?
Based strictly on the provided data, Intuit Inc. is better rated than Unity Software Inc., with higher scores in discounted cash flow, ROE, ROA, debt to equity, and overall financial standing. Unity exhibits very unfavorable scores across these metrics.
Scores Comparison
Here is a comparison of the Altman Z-Score and Piotroski Score for Intuit and Unity Software:
Intuit Scores
- Altman Z-Score: 9.35, indicating a safe zone.
- Piotroski Score: 9, classified as very strong.
Unity Scores
- Altman Z-Score: 2.93, indicating a grey zone.
- Piotroski Score: 4, classified as average.
Which company has the best scores?
Intuit scores higher on both the Altman Z-Score and Piotroski Score, placing it in the safe zone with very strong financial health, unlike Unity, which is in the grey zone with average strength.
Grades Comparison
Here is a detailed comparison of the recent grades and rating trends for Intuit Inc. and Unity Software Inc.:
Intuit Inc. Grades
The following table summarizes recent grades assigned by major financial institutions to Intuit Inc.:
| Grading Company | Action | New Grade | Date |
|---|---|---|---|
| Wells Fargo | Downgrade | Equal Weight | 2026-01-08 |
| Wells Fargo | Maintain | Overweight | 2025-11-21 |
| RBC Capital | Maintain | Outperform | 2025-11-21 |
| BMO Capital | Maintain | Outperform | 2025-11-21 |
| Evercore ISI Group | Maintain | Outperform | 2025-11-18 |
| RBC Capital | Maintain | Outperform | 2025-09-02 |
| RBC Capital | Maintain | Outperform | 2025-08-22 |
| UBS | Maintain | Neutral | 2025-08-22 |
| Morgan Stanley | Maintain | Overweight | 2025-08-22 |
| Barclays | Maintain | Overweight | 2025-08-22 |
Intuit’s grades mostly indicate strong positive sentiment, with multiple “Outperform” and “Overweight” ratings, though the most recent Wells Fargo action was a downgrade to “Equal Weight.”
Unity Software Inc. Grades
The following table summarizes recent grades assigned by major financial institutions to Unity Software Inc.:
| Grading Company | Action | New Grade | Date |
|---|---|---|---|
| Morgan Stanley | Maintain | Overweight | 2026-01-13 |
| Goldman Sachs | Maintain | Neutral | 2026-01-13 |
| Wells Fargo | Maintain | Overweight | 2026-01-08 |
| Jefferies | Maintain | Buy | 2026-01-05 |
| Piper Sandler | Upgrade | Overweight | 2025-12-11 |
| BTIG | Upgrade | Buy | 2025-12-11 |
| Wells Fargo | Upgrade | Overweight | 2025-12-05 |
| Arete Research | Upgrade | Buy | 2025-12-01 |
| Citigroup | Maintain | Buy | 2025-11-11 |
| Wells Fargo | Maintain | Equal Weight | 2025-11-07 |
Unity Software shows generally positive and improving grades with several upgrades and a majority of “Buy” and “Overweight” ratings.
Which company has the best grades?
Both Intuit Inc. and Unity Software Inc. have received predominantly positive grades, but Unity’s recent grades show more frequent upgrades and consistent “Buy” or “Overweight” ratings, suggesting stronger near-term analyst enthusiasm. This could influence investors seeking growth opportunities, while Intuit’s stable “Outperform” ratings indicate solid confidence but with a recent cautious shift by Wells Fargo.
Strengths and Weaknesses
Below is a comparative overview of key strengths and weaknesses for Intuit Inc. and Unity Software Inc. based on their recent financial and strategic data.
| Criterion | Intuit Inc. (INTU) | Unity Software Inc. (U) |
|---|---|---|
| Diversification | Broad product segments including Consumer, Global Business, Credit Karma, and Professional Tax | Focused on Create and Operate Solutions; less diversified |
| Profitability | Strong profitability with net margin 20.55%, ROIC 14.78%, positive value creation (ROIC > WACC) | Negative profitability: net margin -36.63%, ROIC -12.78%, value destroying (ROIC < WACC) |
| Innovation | Consistent investment in tax, financial management, and business solutions | Innovation-driven in gaming and real-time 3D; but profitability challenges raise concerns |
| Global presence | Established global business solutions segment with expanding revenues | Growing global presence but smaller scale and less diverse markets |
| Market Share | Leading positions in tax and financial software markets | Emerging leader in real-time 3D software, but still developing market share |
Key takeaways: Intuit demonstrates strong profitability and diversified revenue streams, though its ROIC trend shows slight decline. Unity Software faces significant profitability challenges despite innovation and growth potential, signaling higher risk for investors.
Risk Analysis
Below is a comparative table summarizing key risks for Intuit Inc. and Unity Software Inc. based on their latest financial year data:
| Metric | Intuit Inc. (INTU) | Unity Software Inc. (U) |
|---|---|---|
| Market Risk | Moderate (Beta 1.25) | High (Beta 2.05) |
| Debt level | Low (Debt/Equity 0.34) | Moderate (Debt/Equity 0.74) |
| Regulatory Risk | Moderate | Moderate |
| Operational Risk | Low (Strong ROE, ROIC) | High (Negative margins, ROE) |
| Environmental Risk | Low | Low |
| Geopolitical Risk | Moderate (Global presence) | Moderate (Global presence) |
Intuit shows solid financial stability with low debt and strong profitability, making operational risk relatively low. Unity faces higher market and operational risks due to negative profitability and weaker financial health. Unity’s Altman Z-score in the grey zone signals moderate bankruptcy risk, unlike Intuit’s safe zone score. Investors should weigh Unity’s growth potential against its financial vulnerabilities.
Which Stock to Choose?
Intuit Inc. (INTU) shows strong income growth with a 95.48% revenue increase over five years and favorable profitability metrics, including a 20.55% net margin and a 19.63% ROE. Its debt levels are moderate with a net debt to EBITDA of 0.64, and its overall financial ratios and rating are favorable, supported by a very strong Piotroski score and a safe-zone Altman Z-score.
Unity Software Inc. (U) has experienced a 134.74% revenue growth over five years but faces ongoing losses with a -36.63% net margin and a negative ROE of -20.81%. Debt ratios are neutral to moderate, while financial ratios are slightly unfavorable overall. The company’s rating is very unfavorable, with an average Piotroski score and a grey-zone Altman Z-score, indicating financial risk.
For investors prioritizing stability and proven profitability, Intuit’s favorable rating and solid income quality might appear more suitable, whereas those with a higher risk tolerance and focus on growth potential could find Unity’s accelerating stock trend and revenue expansion noteworthy, despite its current financial challenges.
Disclaimer: Investment carries a risk of loss of initial capital. The past performance is not a reliable indicator of future results. Be sure to understand risks before making an investment decision.
Go Further
I encourage you to read the complete analyses of Intuit Inc. and Unity Software Inc. to enhance your investment decisions: