Intuit Inc. and Uber Technologies, Inc. are two influential players in the technology sector, each driving innovation in distinct yet overlapping markets—financial software and digital mobility services. Intuit focuses on financial management tools for individuals and businesses, while Uber revolutionizes transportation and delivery solutions globally. This comparison explores their strategies and growth potential to help you decide which company deserves a place in your investment portfolio.

Table of contents
Companies Overview
I will begin the comparison between Intuit and Uber by providing an overview of these two companies and their main differences.
Intuit Overview
Intuit Inc. specializes in financial management and compliance products, serving consumers, small businesses, self-employed individuals, and accounting professionals globally. Its offerings include QuickBooks for business accounting, TurboTax for income tax preparation, and the Credit Karma personal finance platform. Founded in 1983 and headquartered in Mountain View, CA, Intuit is a major player in the software application industry focused on financial solutions.
Uber Overview
Uber Technologies, Inc. operates technology platforms that connect consumers to ride services, meal and grocery delivery, and freight logistics across multiple continents. Since its founding in 2009 and based in San Francisco, CA, Uber has diversified through its Mobility, Delivery, and Freight segments. It is a leading provider in the software application sector, focusing on transportation, delivery, and logistics services.
Key similarities and differences
Both Intuit and Uber operate within the software application industry and serve global markets with technology-driven platforms. Intuit concentrates on financial management and compliance software, targeting businesses and consumers in financial services. Uber focuses on on-demand mobility, delivery, and freight services, connecting users with independent providers. While both rely on digital platforms, their core business models differ fundamentally: Intuit delivers financial products, whereas Uber facilitates transportation and delivery services.
Income Statement Comparison
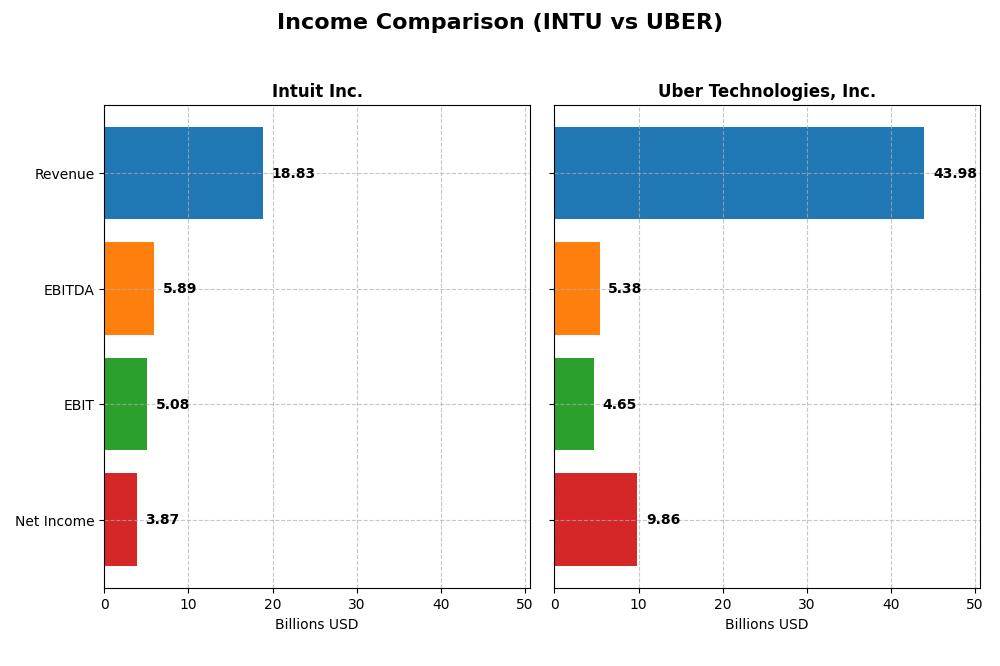
This table presents a side-by-side comparison of key income statement metrics for Intuit Inc. and Uber Technologies, Inc. for their most recent fiscal years.
| Metric | Intuit Inc. (INTU) | Uber Technologies, Inc. (UBER) |
|---|---|---|
| Market Cap | 152B | 176B |
| Revenue | 18.8B | 44.0B |
| EBITDA | 5.9B | 5.4B |
| EBIT | 5.1B | 4.6B |
| Net Income | 3.9B | 9.9B |
| EPS | 13.82 | 4.71 |
| Fiscal Year | 2025 | 2024 |
Income Statement Interpretations
Intuit Inc.
Intuit has shown consistent revenue and net income growth from 2021 to 2025, with revenue rising from $9.63B to $18.83B and net income increasing from $2.06B to $3.87B. Gross and EBIT margins remain strong at approximately 81% and 27%, respectively. The latest fiscal year saw a favorable 15.6% revenue growth and a 33.9% EBIT increase, underscoring improved operational efficiency.
Uber Technologies, Inc.
Uber’s revenue surged from $11.14B in 2020 to $43.98B in 2024, with net income turning positive to $9.81B in 2024 after years of losses. Gross margin is modest at 39.4%, and EBIT margin improved to 10.6%. The most recent year featured a 17.96% revenue increase and a significant 57.35% EBIT growth, reflecting a rapid turnaround and scale expansion in its core businesses.
Which one has the stronger fundamentals?
Both companies exhibit favorable income statement trends, but their fundamentals differ markedly. Intuit demonstrates higher margins with steady, robust growth in revenue and net income, emphasizing profitability and operational discipline. Uber shows exceptional growth and a dramatic earnings turnaround but with lower margins and higher volatility. This contrast highlights different risk-return profiles for investors.
Financial Ratios Comparison
The table below presents the most recent financial ratios for Intuit Inc. and Uber Technologies, Inc., providing a snapshot of their performance and financial health as of their latest fiscal years.
| Ratios | Intuit Inc. (2025) | Uber Technologies, Inc. (2024) |
|---|---|---|
| ROE | 19.63% | 45.72% |
| ROIC | 14.78% | 6.79% |
| P/E | 56.82 | 12.82 |
| P/B | 11.15 | 5.86 |
| Current Ratio | 1.36 | 1.07 |
| Quick Ratio | 1.36 | 1.07 |
| D/E (Debt-to-Equity) | 0.34 | 0.53 |
| Debt-to-Assets | 17.96% | 22.32% |
| Interest Coverage | 19.93 | 5.35 |
| Asset Turnover | 0.51 | 0.86 |
| Fixed Asset Turnover | 12.54 | 14.14 |
| Payout ratio | 30.73% | 0% |
| Dividend yield | 0.54% | 0% |
Interpretation of the Ratios
Intuit Inc.
Intuit displays strong profitability ratios with a net margin of 20.55% and a return on equity of 19.63%, both favorable. Its leverage is well controlled, with debt-to-equity at 0.34 and interest coverage at 20.57, indicating financial stability. However, the high price-to-earnings ratio of 56.82 and price-to-book ratio of 11.15 are less attractive. Intuit pays dividends with a modest yield of 0.54%, supported by free cash flow coverage, but the yield is considered low.
Uber Technologies, Inc.
Uber shows robust profitability with a net margin of 22.41% and an impressive return on equity of 45.72%, both favorable. The company’s debt-to-assets ratio at 22.32% and interest coverage ratio of 8.89 suggest manageable financial risk. Its price-to-earnings ratio of 12.82 is favorable, while the price-to-book ratio at 5.86 is less so. Uber does not pay dividends, likely prioritizing reinvestment and growth, with no current yield for shareholders.
Which one has the best ratios?
Intuit holds a more balanced profile with a higher proportion of favorable ratios (57.14%) and conservative leverage, though its valuation multiples are elevated. Uber’s slightly favorable overall rating (50% favorable ratios) is driven by strong returns and lower valuation multiples but carries more neutral leverage metrics. Both companies exhibit strengths and weaknesses across their financial ratios.
Strategic Positioning
This section compares the strategic positioning of Intuit and Uber, including market position, key segments, and exposure to technological disruption:
Intuit
- Market leader in financial software with moderate competitive pressure in technology sector.
- Diverse segments: Small Business, Consumer, Credit Karma, and Professional Tax drive revenue.
- Moderate exposure to disruption through cloud and fintech innovations impacting financial services.
Uber
- Major player in mobility and delivery markets facing intense competition from local and global firms.
- Concentrated segments: Mobility, Delivery, and Freight form core business drivers.
- High exposure to technological disruption with evolving mobility, delivery, and logistics tech.
Intuit vs Uber Positioning
Intuit pursues a diversified strategy across multiple financial software segments, providing stability but facing steady competition. Uber focuses on a concentrated approach in mobility and delivery, offering growth potential but higher competitive and disruption risks.
Which has the best competitive advantage?
Intuit shows a slightly favorable moat with value creation despite declining profitability. Uber’s moat is slightly unfavorable, shedding value but improving profitability. Intuit currently holds a more stable competitive advantage based on MOAT evaluation.
Stock Comparison
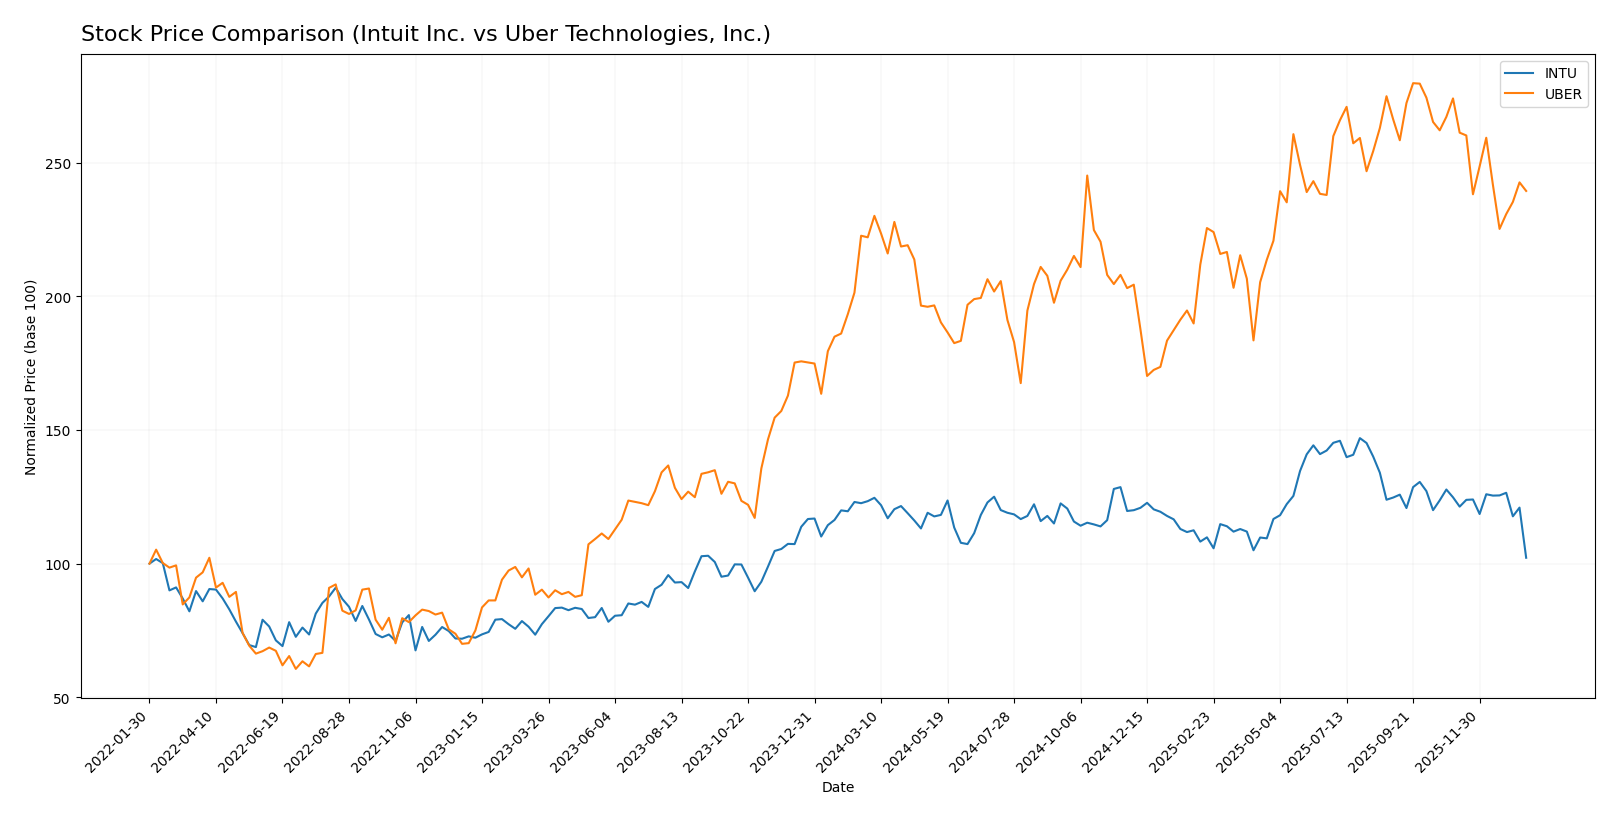
The stock prices of Intuit Inc. and Uber Technologies, Inc. have shown contrasting dynamics over the past year, with Intuit experiencing a notable decline and Uber a moderate rise, each reflecting distinct trading patterns and market responses.
Trend Analysis
Intuit Inc. (INTU) exhibited a bearish trend over the past 12 months with a price decrease of 17.17%. The trend shows deceleration and high volatility, with prices ranging between 785.95 and 546.52.
Uber Technologies, Inc. (UBER) demonstrated a bullish trend over the same period, gaining 7.81%. Despite deceleration, it maintained lower volatility and a price range from 58.99 to 98.51.
Comparing both, Uber delivered the highest market performance with a positive price change, whereas Intuit’s stock declined significantly, indicating contrasting investor sentiment and market momentum.
Target Prices
Here is the current target price consensus from verified analysts for Intuit Inc. and Uber Technologies, Inc.:
| Company | Target High | Target Low | Consensus |
|---|---|---|---|
| Intuit Inc. | 880 | 700 | 798.4 |
| Uber Technologies, Inc. | 140 | 73 | 111.26 |
Analysts expect both stocks to appreciate significantly from current prices, with Intuit’s consensus target about 46% above its $545 price and Uber’s consensus target roughly 32% above its $84 price. This indicates positive sentiment for both companies.
Analyst Opinions Comparison
This section compares analysts’ ratings and financial scores for Intuit Inc. and Uber Technologies, Inc.:
Rating Comparison
Intuit Inc. Rating
- Rating: B, classified as Very Favorable
- Discounted Cash Flow Score: 4 – Favorable
- ROE Score: 4 – Favorable
- ROA Score: 5 – Very Favorable
- Debt To Equity Score: 2 – Moderate
- Overall Score: 3 – Moderate
Uber Technologies, Inc. Rating
- Rating: B, classified as Very Favorable
- Discounted Cash Flow Score: 1 – Very Unfavorable
- ROE Score: 5 – Very Favorable
- ROA Score: 5 – Very Favorable
- Debt To Equity Score: 2 – Moderate
- Overall Score: 3 – Moderate
Which one is the best rated?
Both Intuit and Uber share the same overall rating of B and an overall score of 3, indicating a moderate standing. Uber scores higher on ROE, while Intuit has a more favorable discounted cash flow score, balancing their ratings closely.
Scores Comparison
The following table presents a comparison of Intuit Inc. and Uber Technologies, Inc. based on their Altman Z-Score and Piotroski Score:
Intuit Inc. Scores
- Altman Z-Score: 9.35, indicating a safe zone of financial stability.
- Piotroski Score: 9, classified as very strong financial health.
Uber Technologies, Inc. Scores
- Altman Z-Score: 4.44, also in the safe zone but lower than Intuit.
- Piotroski Score: 6, reflecting average financial strength.
Which company has the best scores?
Intuit Inc. exhibits stronger financial health with a higher Altman Z-Score and a very strong Piotroski Score compared to Uber’s safe zone Altman Z-Score and average Piotroski Score. Intuit’s scores suggest a lower bankruptcy risk and better financial strength.
Grades Comparison
Here is the comparison of recent reliable grades for Intuit Inc. and Uber Technologies, Inc.:
Intuit Inc. Grades
This table summarizes recent analyst grades from reputable firms for Intuit Inc.
| Grading Company | Action | New Grade | Date |
|---|---|---|---|
| Wells Fargo | Downgrade | Equal Weight | 2026-01-08 |
| Wells Fargo | Maintain | Overweight | 2025-11-21 |
| RBC Capital | Maintain | Outperform | 2025-11-21 |
| BMO Capital | Maintain | Outperform | 2025-11-21 |
| Evercore ISI Group | Maintain | Outperform | 2025-11-18 |
| RBC Capital | Maintain | Outperform | 2025-09-02 |
| RBC Capital | Maintain | Outperform | 2025-08-22 |
| UBS | Maintain | Neutral | 2025-08-22 |
| Morgan Stanley | Maintain | Overweight | 2025-08-22 |
| Barclays | Maintain | Overweight | 2025-08-22 |
Overall, Intuit’s grades mostly indicate a strong buy-side sentiment with multiple Outperform and Overweight ratings, though a recent downgrade to Equal Weight signals some caution.
Uber Technologies, Inc. Grades
This table presents recent analyst grades from credible sources for Uber Technologies, Inc.
| Grading Company | Action | New Grade | Date |
|---|---|---|---|
| BTIG | Maintain | Buy | 2026-01-15 |
| Wells Fargo | Maintain | Overweight | 2026-01-08 |
| Cantor Fitzgerald | Maintain | Overweight | 2026-01-08 |
| Wolfe Research | Maintain | Outperform | 2026-01-06 |
| Wedbush | Maintain | Neutral | 2025-12-19 |
| Morgan Stanley | Maintain | Overweight | 2025-12-08 |
| Arete Research | Upgrade | Buy | 2025-12-03 |
| Wells Fargo | Maintain | Overweight | 2025-11-05 |
| Guggenheim | Maintain | Buy | 2025-11-05 |
| DA Davidson | Maintain | Buy | 2025-11-05 |
Uber shows a consistent pattern of buy-side ratings, with several upgrades and no recent downgrades, indicating positive analyst sentiment.
Which company has the best grades?
Both Intuit and Uber hold a “Buy” consensus from analysts, but Uber exhibits a steadier pattern of “Buy” and “Overweight” ratings without recent downgrades, while Intuit shows strong “Outperform” ratings tempered by a recent downgrade to “Equal Weight.” This suggests Uber currently enjoys a more uniformly positive analyst outlook, which may influence investor confidence and portfolio decisions.
Strengths and Weaknesses
The following table summarizes the key strengths and weaknesses of Intuit Inc. and Uber Technologies, Inc. based on the most recent financial and business data.
| Criterion | Intuit Inc. (INTU) | Uber Technologies, Inc. (UBER) |
|---|---|---|
| Diversification | Strong with multiple segments: Consumer, Global Business, Credit Karma, Professional Tax | Moderate; focused on Mobility, Delivery, Freight segments |
| Profitability | High net margin (20.55%), ROE 19.63%, ROIC 14.78%; creating value but with declining ROIC trend | Good net margin (22.41%), high ROE (45.72%), improving ROIC but still shedding value overall |
| Innovation | Consistent innovation in financial and tax software products, expanding digital services | Rapid innovation in mobility and delivery services; strong technology development |
| Global presence | Expanding global business solutions; solid U.S. consumer base | Wide global footprint in urban mobility and logistics |
| Market Share | Leading market share in financial software and tax services | Major player in ride-sharing and food delivery, but competitive market |
Key takeaways: Intuit demonstrates strong profitability and diversified revenue streams despite a slightly declining ROIC trend, reflecting some caution. Uber shows robust growth and improving profitability but still faces challenges in creating overall value, indicating higher risk but potential upside.
Risk Analysis
Below is a comparison table highlighting key risks for Intuit Inc. and Uber Technologies, Inc. as of the most recent fiscal years.
| Metric | Intuit Inc. (INTU) | Uber Technologies, Inc. (UBER) |
|---|---|---|
| Market Risk | Beta 1.254; sensitive to tech sector volatility | Beta 1.203; exposure to global ride-hailing and delivery markets |
| Debt level | Low leverage; debt-to-equity 0.34 (favorable) | Moderate leverage; debt-to-equity 0.53 (neutral) |
| Regulatory Risk | Moderate; financial software compliance required | High; ongoing regulatory scrutiny in multiple countries |
| Operational Risk | Moderate; reliance on cloud service stability | High; complexity in logistics and mobility operations |
| Environmental Risk | Low; limited direct environmental impact | Moderate; rising focus on emissions and sustainability commitments |
| Geopolitical Risk | Low; primarily US and Canada markets | Moderate; operations in politically sensitive regions |
The most impactful and likely risks are Uber’s regulatory and operational challenges given its global footprint and complex logistics, alongside Intuit’s exposure to market volatility and valuation pressures despite strong financial health. Uber’s elevated regulatory scrutiny and Intuit’s relatively high price multiples warrant investor caution.
Which Stock to Choose?
Intuit Inc. has shown strong income growth with a 15.63% revenue increase in 2025 and favorable profitability, including a 20.55% net margin and 19.63% ROE. Its debt remains moderate with a net debt to EBITDA of 0.64, and its overall rating is very favorable (B).
Uber Technologies, Inc. also reports favorable income evolution, with 17.96% revenue growth in 2024 and a 22.41% net margin. Its ROE stands out at 45.72%, though debt levels are slightly higher with a net debt to EBITDA of 0.93. The company holds a very favorable rating (B) but with some moderate concerns in valuation metrics.
For risk-averse or quality-focused investors, Intuit’s stable profitability and strong financial ratios might appear more suitable, while investors with a higher risk tolerance or growth orientation could find Uber’s rapid income growth and high ROE more appealing. Both companies exhibit favorable ratings, but their differing financial profiles suggest varied investment interpretations.
Disclaimer: Investment carries a risk of loss of initial capital. The past performance is not a reliable indicator of future results. Be sure to understand risks before making an investment decision.
Go Further
I encourage you to read the complete analyses of Intuit Inc. and Uber Technologies, Inc. to enhance your investment decisions: