In the dynamic world of software applications, Intuit Inc. and Tyler Technologies, Inc. stand out as key players with distinct yet overlapping market focuses. Intuit excels in financial management solutions for consumers and small businesses, while Tyler Technologies specializes in integrated information management for the public sector. Both companies emphasize innovation through cloud services and tailored software solutions. This article will help you decide which company offers the most compelling investment opportunity in 2026.
Table of contents
Companies Overview
I will begin the comparison between Intuit Inc. and Tyler Technologies, Inc. by providing an overview of these two companies and their main differences.
Intuit Inc. Overview
Intuit Inc. focuses on financial management and compliance products, serving consumers, small businesses, the self-employed, and accounting professionals globally. Operating through segments like Small Business & Self-Employed and Credit Karma, it offers software solutions including QuickBooks and TurboTax. Headquartered in Mountain View, California, Intuit is a leader in application software for financial services with a market cap of 151.5B USD.
Tyler Technologies, Inc. Overview
Tyler Technologies, based in Plano, Texas, provides integrated information management solutions for the public sector. Its offerings cover enterprise software, tax appraisal, judicial, and public safety systems, enhancing government and educational operations. With a market cap of 19B USD, Tyler serves government agencies through software as a service and other technology solutions, supporting public sector efficiency.
Key similarities and differences
Both Intuit and Tyler operate in the software application industry, focusing on specialized markets—financial services for Intuit and public sector management for Tyler. Intuit’s business model centers on financial software and consumer products, while Tyler targets government and education sectors with integrated management solutions. Their distinct customer bases and product scopes highlight complementary roles within the broader technology sector.
Income Statement Comparison
This table compares the most recent fiscal year income statement metrics of Intuit Inc. and Tyler Technologies, Inc., providing a clear financial overview for investors.
| Metric | Intuit Inc. (INTU) | Tyler Technologies, Inc. (TYL) |
|---|---|---|
| Market Cap | 151.5B | 18.97B |
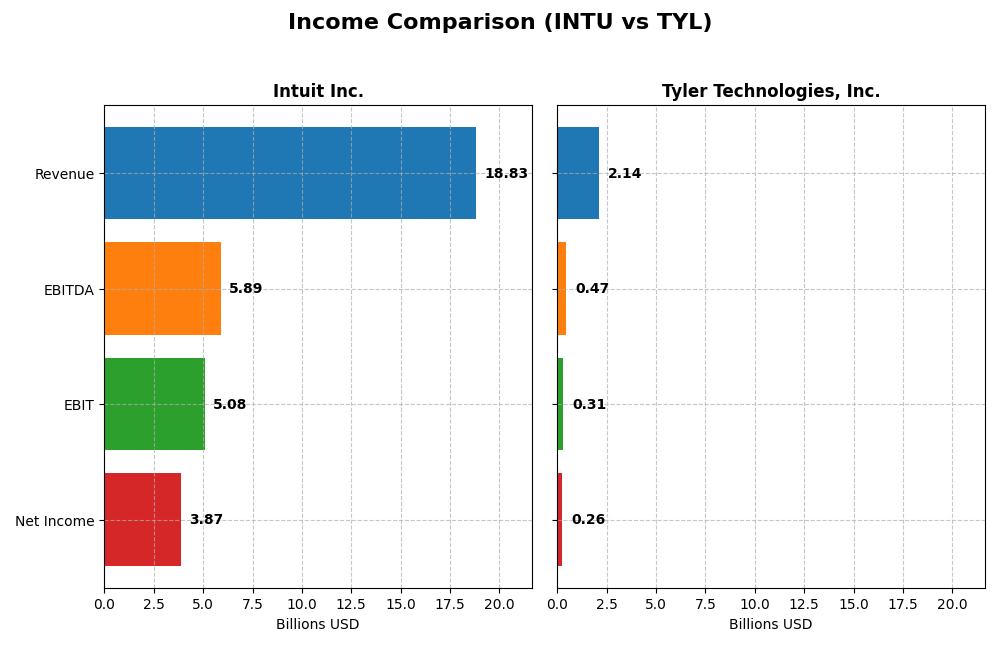
| Revenue | 18.83B | 2.14B |
| EBITDA | 5.89B | 466.5M |
| EBIT | 5.08B | 314.1M |
| Net Income | 3.87B | 263.0M |
| EPS | 13.82 | 6.17 |
| Fiscal Year | 2025 | 2024 |
Income Statement Interpretations
Intuit Inc.
Intuit’s revenue and net income showed consistent growth from 2021 to 2025, nearly doubling revenue to 18.8B and net income to 3.87B in 2025. Margins remained strong, with a gross margin of 80.76% and a net margin above 20%. The latest fiscal year saw robust growth with revenue up 15.6% and net income increasing by 12.9%, supported by improving operating efficiency.
Tyler Technologies, Inc.
Tyler Technologies experienced steady revenue growth from 2020 to 2024, reaching approximately 2.14B, with net income rising to 263M. Margins were stable but lower than Intuit’s, with a gross margin near 41% and a net margin of 12.3%. The latest year showed a 9.5% revenue increase and a strong 44.7% net margin growth, reflecting improved profitability despite a narrower margin base.
Which one has the stronger fundamentals?
Both companies demonstrate favorable income statement trends with steady revenue and net income growth over their respective periods. Intuit leads with higher margins and more substantial overall growth, while Tyler shows impressive margin improvement recently despite lower absolute profitability. Each exhibits strengths; Intuit’s scale and margin dominance contrast with Tyler’s recent acceleration in profitability growth.
Financial Ratios Comparison
This table presents the most recent financial ratios for Intuit Inc. and Tyler Technologies, Inc., allowing a straightforward comparison of their key performance and financial health metrics as of their latest fiscal years.
| Ratios | Intuit Inc. (2025) | Tyler Technologies, Inc. (2024) |
|---|---|---|
| ROE | 19.63% | 7.76% |
| ROIC | 14.78% | 6.20% |
| P/E | 56.82 | 93.42 |
| P/B | 11.15 | 7.25 |
| Current Ratio | 1.36 | 1.35 |
| Quick Ratio | 1.36 | 1.35 |
| D/E | 0.34 | 0.19 |
| Debt-to-Assets | 17.96% | 12.32% |
| Interest Coverage | 19.93 | 50.50 |
| Asset Turnover | 0.51 | 0.41 |
| Fixed Asset Turnover | 12.54 | 10.95 |
| Payout ratio | 30.73% | 0% |
| Dividend yield | 0.54% | 0% |
Interpretation of the Ratios
Intuit Inc.
Intuit shows mostly favorable financial ratios, with strong net margin (20.55%) and return on equity (19.63%), indicating efficient profitability. Debt levels and interest coverage are also positive, though valuation metrics like P/E (56.82) and P/B (11.15) appear stretched. The company pays dividends with a low yield (0.54%), reflecting a cautious payout policy supported by healthy free cash flow.
Tyler Technologies, Inc.
Tyler presents mixed ratio strength, with a favorable net margin (12.3%) but weak return on equity (7.76%) and moderate return on invested capital (6.2%). Debt management and interest coverage are solid, yet valuation multiples such as P/E (93.42) remain high. Tyler does not pay dividends, likely prioritizing reinvestment and growth, consistent with its high research and development spending.
Which one has the best ratios?
Based on the evaluations, Intuit offers a more favorable overall ratio profile with stronger profitability and better capital returns despite some valuation concerns. Tyler’s ratios are slightly favorable, hindered by lower profitability and lack of dividend payments, indicating a cautious stance on immediate shareholder returns.
Strategic Positioning
This section compares the strategic positioning of Intuit Inc. and Tyler Technologies, Inc. across Market position, Key segments, and Exposure to technological disruption:
Intuit Inc.
- Large market cap of 151.5B with strong NASDAQ presence; faces competition in financial software.
- Diversified segments including Small Business, Consumer, Credit Karma, and Professional Tax products.
- Operates cloud-based financial management services and payment solutions; impacted by tech shifts.
Tyler Technologies, Inc.
- Smaller market cap of 19B on NYSE; focused on niche public sector software with moderate competitive pressure.
- Concentrated in public sector with Enterprise Software, Appraisal & Tax, and SaaS services driving revenue.
- Uses cloud hosting via AWS collaboration; relies on integrated public sector software, vulnerable to disruption.
Intuit Inc. vs Tyler Technologies, Inc. Positioning
Intuit shows a diversified approach across consumer and business financial services, offering broad market exposure. Tyler concentrates on public sector solutions, narrowing market scope but specializing deeply. Intuit’s scale may bring resilience; Tyler’s focus may limit growth avenues.
Which has the best competitive advantage?
Intuit demonstrates a slightly favorable moat with value creation despite declining ROIC, indicating some sustained competitive advantage. Tyler’s very unfavorable moat and value destruction suggest weaker competitive positioning and profitability challenges.
Stock Comparison
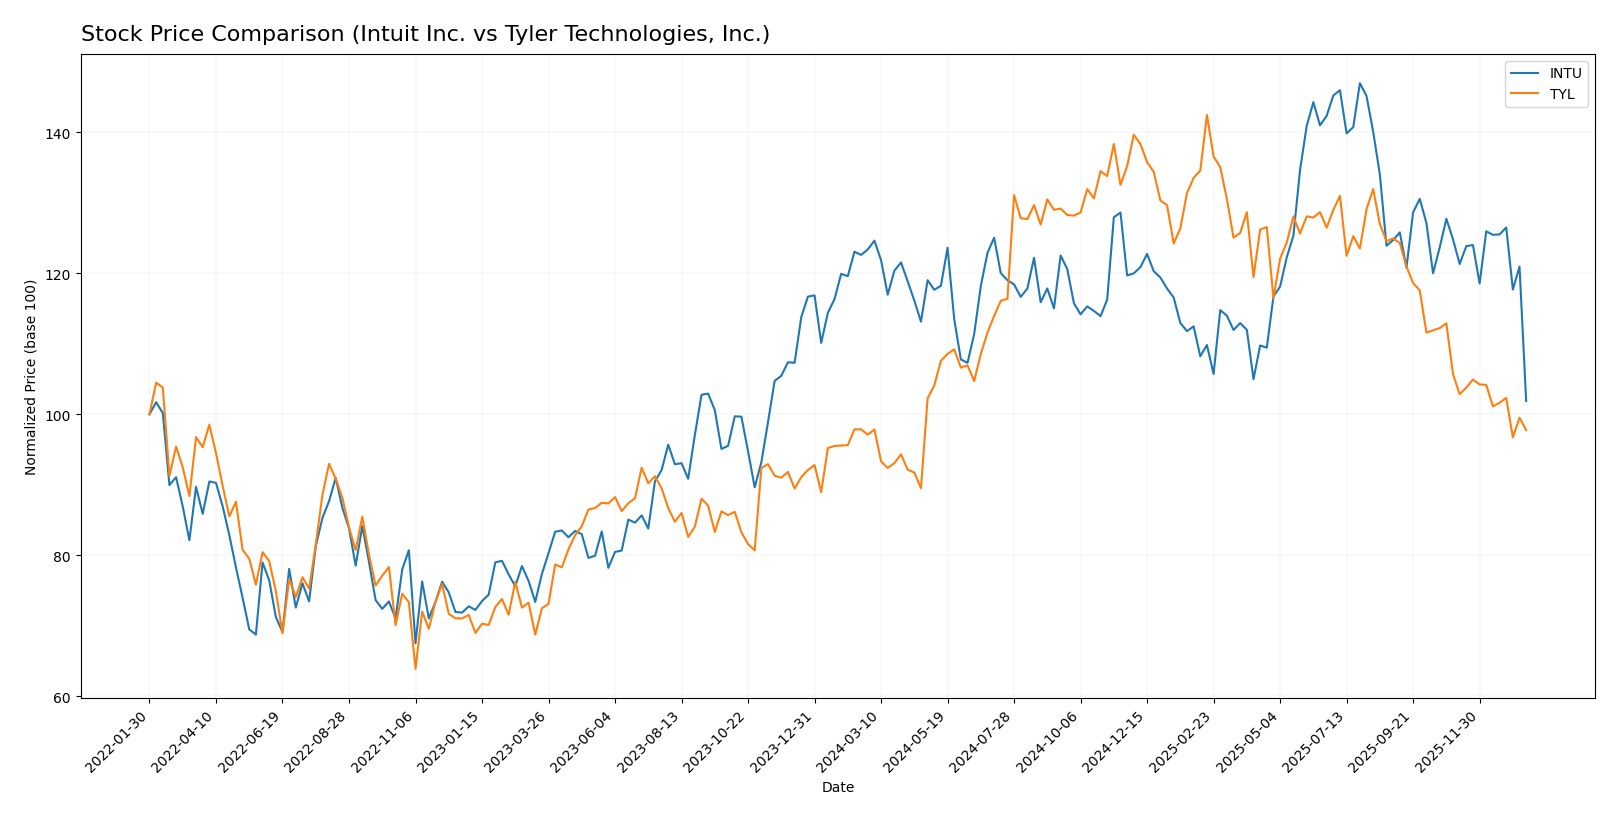
The past year reveals contrasting stock price movements for Intuit Inc. and Tyler Technologies, Inc., with Intuit showing a pronounced bearish trend and Tyler a mild bullish trend, both experiencing recent deceleration in momentum.
Trend Analysis
Intuit Inc. exhibited a -17.41% price change over the past 12 months, reflecting a bearish trend with deceleration and a high volatility level (std. dev. 51.51). Its price ranged from a high of 785.95 to a low of 544.93.
Tyler Technologies, Inc. showed a modest 0.68% increase over the same period, indicating a bullish trend with deceleration and higher volatility (std. dev. 61.81). The stock’s price fluctuated between 403.35 and 641.7.
Comparing trends, Intuit’s stock experienced a significant decline while Tyler’s delivered the highest market performance with slight gains despite recent negative shifts.
Target Prices
The current analyst consensus shows promising upside potential for both Intuit Inc. and Tyler Technologies, Inc.
| Company | Target High | Target Low | Consensus |
|---|---|---|---|
| Intuit Inc. | 880 | 700 | 798.4 |
| Tyler Technologies, Inc. | 675 | 470 | 584 |
Analysts expect Intuit’s stock to rise significantly above its current price of $544.23, while Tyler Technologies also shows a strong upside from its current $440.88, reflecting overall positive market sentiment for both stocks.
Analyst Opinions Comparison
This section compares analysts’ ratings and grades for Intuit Inc. and Tyler Technologies, Inc.:
Rating Comparison
Intuit Inc. Rating
- Rating: B, classified as Very Favorable.
- Discounted Cash Flow Score: 4, considered Favorable.
- ROE Score: 4, Favorable, indicating efficient profit generation from equity.
- ROA Score: 5, Very Favorable, indicating excellent asset utilization.
- Debt To Equity Score: 2, Moderate, reflecting moderate financial risk.
- Overall Score: 3, Moderate overall financial standing.
Tyler Technologies, Inc. Rating
- Rating: B, classified as Very Favorable.
- Discounted Cash Flow Score: 4, considered Favorable.
- ROE Score: 3, Moderate, showing average profit efficiency.
- ROA Score: 4, Favorable, showing good asset utilization.
- Debt To Equity Score: 3, Moderate, indicating balanced financial leverage.
- Overall Score: 3, Moderate overall financial standing.
Which one is the best rated?
Both Intuit and Tyler Technologies share the same overall rating of B and an identical overall score of 3. Intuit scores higher in ROE and ROA, while Tyler has a slightly better debt to equity score, making their ratings closely matched based on the available data.
Scores Comparison
Here is a comparison of the Altman Z-Score and Piotroski Score for Intuit Inc. and Tyler Technologies, Inc.:
INTU Scores
- Altman Z-Score: 9.35, indicating a strong safe zone
- Piotroski Score: 9, classified as very strong
TYL Scores
- Altman Z-Score: 7.42, also within the safe zone
- Piotroski Score: 6, considered average
Which company has the best scores?
Intuit shows stronger scores with a higher Altman Z-Score and a very strong Piotroski Score, compared to Tyler’s safe zone Altman Z-Score and average Piotroski Score. Based strictly on these metrics, Intuit has the better financial health indicators.
Grades Comparison
Here is a detailed comparison of the latest available grades from recognized financial institutions for Intuit Inc. and Tyler Technologies, Inc.:
Intuit Inc. Grades
The table below presents recent grades from major financial analysts for Intuit Inc.:
| Grading Company | Action | New Grade | Date |
|---|---|---|---|
| Wells Fargo | Downgrade | Equal Weight | 2026-01-08 |
| Wells Fargo | Maintain | Overweight | 2025-11-21 |
| RBC Capital | Maintain | Outperform | 2025-11-21 |
| BMO Capital | Maintain | Outperform | 2025-11-21 |
| Evercore ISI Group | Maintain | Outperform | 2025-11-18 |
| RBC Capital | Maintain | Outperform | 2025-09-02 |
| RBC Capital | Maintain | Outperform | 2025-08-22 |
| UBS | Maintain | Neutral | 2025-08-22 |
| Morgan Stanley | Maintain | Overweight | 2025-08-22 |
| Barclays | Maintain | Overweight | 2025-08-22 |
Intuit’s grades mostly indicate strong analyst confidence, with multiple “Outperform” and “Overweight” ratings, only recently adjusting to “Equal Weight” from Wells Fargo.
Tyler Technologies, Inc. Grades
The following table presents recent grades from recognized grading firms for Tyler Technologies, Inc.:
| Grading Company | Action | New Grade | Date |
|---|---|---|---|
| Piper Sandler | Maintain | Overweight | 2026-01-13 |
| Wells Fargo | Maintain | Equal Weight | 2026-01-08 |
| DA Davidson | Maintain | Neutral | 2025-12-09 |
| Evercore ISI Group | Maintain | In Line | 2025-10-31 |
| DA Davidson | Maintain | Neutral | 2025-10-31 |
| DA Davidson | Maintain | Neutral | 2025-10-10 |
| DA Davidson | Maintain | Neutral | 2025-08-05 |
| Barclays | Maintain | Overweight | 2025-07-31 |
| Needham | Maintain | Buy | 2025-05-13 |
| Barclays | Maintain | Overweight | 2025-04-25 |
Tyler Technologies shows a stable outlook with several “Overweight” and “Neutral” ratings, and a “Buy” from Needham, indicating moderate analyst support.
Which company has the best grades?
Intuit Inc. has received a stronger and more consistent set of grades, with numerous “Outperform” and “Overweight” ratings, suggesting higher analyst conviction. Tyler Technologies holds mostly “Neutral” to “Overweight” ratings with fewer “Buy” recommendations. This difference may influence investors’ perception of growth potential and risk.
Strengths and Weaknesses
Below is a comparison table highlighting the key strengths and weaknesses of Intuit Inc. and Tyler Technologies, Inc. based on the most recent financial data and market position.
| Criterion | Intuit Inc. (INTU) | Tyler Technologies, Inc. (TYL) |
|---|---|---|
| Diversification | Highly diversified revenue streams: Consumer, Credit Karma, Global Business Solutions, Professional Tax segments | Less diversified, primarily focused on enterprise software and public sector solutions |
| Profitability | Strong profitability with 20.55% net margin and favorable ROE (19.63%) and ROIC (14.78%) | Moderate profitability: 12.3% net margin, but lower ROE (7.76%) and neutral ROIC (6.2%) |
| Innovation | Continuous product innovation in financial software and credit services | Innovation focused on enterprise and SaaS solutions, but slower ROIC growth |
| Global presence | Significant global reach, especially in small business and consumer markets | More US-centric with limited global expansion |
| Market Share | Leading market position in financial software and tax solutions | Smaller market share, focused on niche public sector software |
Key takeaways: Intuit demonstrates strong profitability and broad diversification, though its ROIC trend is declining. Tyler Technologies shows moderate profitability with a narrower focus and declining ROIC, indicating higher risk. Intuit appears the safer choice for investors seeking stability and innovation.
Risk Analysis
Below is a comparison of key risks for Intuit Inc. and Tyler Technologies, Inc. as of the most recent fiscal years.
| Metric | Intuit Inc. (INTU) | Tyler Technologies, Inc. (TYL) |
|---|---|---|
| Market Risk | Beta 1.25 indicates moderate volatility relative to market | Beta 0.92 suggests lower volatility and defensive profile |
| Debt level | Debt-to-Equity 0.34, Debt-to-Assets 17.96%, manageable debt | Debt-to-Equity 0.19, Debt-to-Assets 12.32%, low leverage |
| Regulatory Risk | Exposure to financial and tax regulations across US/Canada | Public sector software subject to government procurement rules |
| Operational Risk | Complexity from multiple segments and cloud services | Dependence on public sector contracts and SaaS infrastructure |
| Environmental Risk | Moderate; primarily software with limited physical footprint | Similar low environmental footprint, but some data center energy use |
| Geopolitical Risk | Moderate; international presence but mostly North America | Low; mostly US-focused, less exposed to global geopolitical shifts |
Intuit’s higher beta and exposure to evolving tax and financial regulations pose notable market and regulatory risks. Tyler’s risk lies in operational dependence on public sector budgets and contracts. Both have low debt risk and stable financial health, but Intuit’s valuation metrics suggest caution.
Which Stock to Choose?
Intuit Inc. (INTU) shows strong income growth with a 15.63% revenue increase in 2025 and favorable profitability metrics, including a 20.55% net margin. Its financial ratios are mostly favorable, with low debt levels and a solid rating of B. The company has a slightly favorable economic moat despite a declining ROIC trend.
Tyler Technologies, Inc. (TYL) demonstrates steady income growth of 9.53% in 2024 and favorable profit margins, though lower than Intuit’s, with a 12.3% net margin. Financial ratios are slightly favorable but include some unfavorable valuation metrics. The company’s rating is also B, but its economic moat is very unfavorable due to declining ROIC and value destruction.
Investors focused on growth and strong profitability may find Intuit’s favorable income and ratio profile more appealing, while those with a tolerance for risk and interest in a company with steady growth but weaker profitability might view Tyler’s profile as a potential opportunity. Overall, the ratings and financial evaluations suggest differing risk and return profiles to consider.
Disclaimer: Investment carries a risk of loss of initial capital. The past performance is not a reliable indicator of future results. Be sure to understand risks before making an investment decision.
Go Further
I encourage you to read the complete analyses of Intuit Inc. and Tyler Technologies, Inc. to enhance your investment decisions: