In the fast-evolving software industry, Intuit Inc. and Strategy Inc. stand out as influential players shaping financial and analytical technology. Intuit specializes in comprehensive financial management solutions for individuals and small businesses, while Strategy focuses on integrating bitcoin treasury functions with AI-powered enterprise analytics. Their innovative approaches and market overlap make them compelling subjects for comparison. Join me as we explore which company offers the most promising investment opportunity in 2026.
Table of contents
Companies Overview
I will begin the comparison between Intuit Inc. and Strategy Inc. by providing an overview of these two companies and their main differences.
Intuit Inc. Overview
Intuit Inc. is a leading provider of financial management and compliance products for consumers, small businesses, self-employed individuals, and accounting professionals across the US, Canada, and internationally. Operating since 1983, it offers a broad range of solutions including QuickBooks, TurboTax, Credit Karma, and ProConnect, positioning itself as a comprehensive financial software and services provider with a $152B market cap.
Strategy Inc. Overview
Strategy Inc., formerly known as MicroStrategy Incorporated until August 2025, operates primarily as a bitcoin treasury company while also providing AI-powered enterprise analytics software. Founded in 1989 and based in Virginia, it serves global markets including the US, Europe, and the Middle East. The company, with a market cap of $49.7B, offers investment products tied to Bitcoin alongside analytics tools like Strategy One and Strategy Mosaic.
Key similarities and differences
Both Intuit and Strategy Inc. operate in the software application industry and trade on NASDAQ, but their business models differ significantly. Intuit focuses on financial management software and services targeting a broad customer base, while Strategy Inc. combines bitcoin treasury management with AI-driven analytics software, catering to investors and enterprises. Intuit’s workforce is substantially larger with 18,800 employees compared to Strategy’s 1,546, reflecting their distinct operational scopes.
Income Statement Comparison
The table below compares the key income statement metrics for Intuit Inc. and Strategy Inc. for the most recent fiscal year available.
| Metric | Intuit Inc. (INTU) | Strategy Inc (MSTR) |
|---|---|---|
| Market Cap | 152B | 49.7B |
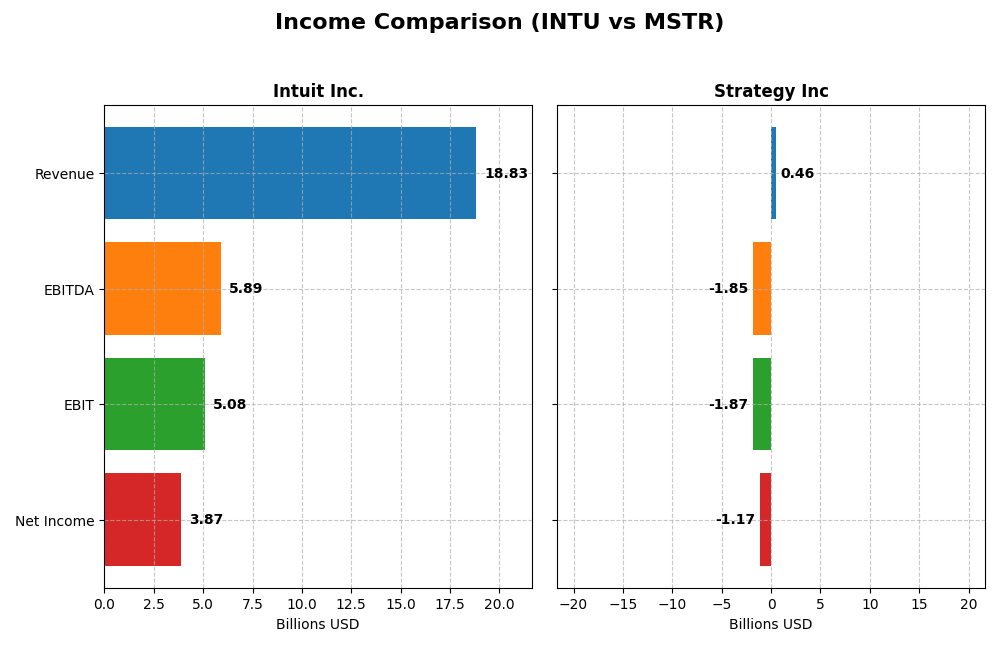
| Revenue | 18.8B | 463M |
| EBITDA | 5.89B | -1.85B |
| EBIT | 5.08B | -1.87B |
| Net Income | 3.87B | -1.17B |
| EPS | 13.82 | -6.06 |
| Fiscal Year | 2025 | 2024 |
Income Statement Interpretations
Intuit Inc.
Intuit demonstrated strong revenue growth from $9.63B in 2021 to $18.83B in 2025, nearly doubling over five years. Net income followed a similar trajectory, rising from $2.06B to $3.87B. Margins remained robust, with a gross margin above 80% and net margin exceeding 20%. In 2025, revenue growth accelerated by 15.63%, accompanied by a 12.92% increase in net margin, reflecting improved profitability.
Strategy Inc
Strategy Inc’s revenue declined from $510M in 2021 to $463M in 2024, with net income turning sharply negative, reaching a loss of $1.17B in 2024. Gross margin remained favorable at 72%, but EBIT and net margins were deeply negative, reflecting operational and financial challenges. The latest year showed deteriorating margins and a 6.61% revenue decrease, indicating ongoing difficulties in profitability.
Which one has the stronger fundamentals?
Intuit Inc. exhibits stronger fundamentals with consistent revenue and net income growth, favorable margins, and positive earnings momentum. In contrast, Strategy Inc faces significant profitability issues, with declining revenues and substantial net losses. Intuit’s stable and expanding margins offer a clearer path to sustainable earnings compared to Strategy’s volatile financial performance and high interest burden.
Financial Ratios Comparison
The table below presents the most recent financial ratios for Intuit Inc. and Strategy Inc, offering a side-by-side comparison of key performance and financial health metrics as of their latest fiscal years.
| Ratios | Intuit Inc. (INTU) FY 2025 | Strategy Inc (MSTR) FY 2024 |
|---|---|---|
| ROE | 19.6% | -6.4% |
| ROIC | 14.8% | -4.4% |
| P/E | 56.8 | -47.8 |
| P/B | 11.2 | 3.06 |
| Current Ratio | 1.36 | 0.71 |
| Quick Ratio | 1.36 | 0.71 |
| D/E (Debt-to-Equity) | 0.34 | 0.40 |
| Debt-to-Assets | 18.0% | 28.1% |
| Interest Coverage | 19.9 | -29.9 |
| Asset Turnover | 0.51 | 0.018 |
| Fixed Asset Turnover | 12.5 | 5.73 |
| Payout Ratio | 31% | 0% |
| Dividend Yield | 0.54% | 0% |
Interpretation of the Ratios
Intuit Inc.
Intuit displays generally strong financial ratios with a favorable net margin of 20.55%, ROE of 19.63%, and ROIC of 14.78%. However, high PE (56.82) and PB (11.15) ratios are less attractive. The company pays dividends, but with a low dividend yield of 0.54%, indicating a cautious payout policy likely supported by solid free cash flow coverage and minimal risk of unsustainable distributions.
Strategy Inc
Strategy Inc’s ratios reveal significant weaknesses, including a negative net margin of -251.73%, ROE of -6.4%, and ROIC of -4.38%. Current and quick ratios are also unfavorable at 0.71. The company does not pay dividends, likely due to net losses and prioritization of reinvestment and R&D. These factors contribute to its unfavorable overall financial profile.
Which one has the best ratios?
Intuit Inc. clearly has the superior ratio profile, with a majority of favorable metrics supporting profitability and financial stability. In contrast, Strategy Inc faces several critical issues, including negative profitability and liquidity challenges, resulting in an unfavorable overall evaluation. This differential highlights Intuit’s stronger financial footing in the current market environment.
Strategic Positioning
This section compares the strategic positioning of Intuit Inc. and Strategy Inc, covering market position, key segments, and exposure to technological disruption:
Intuit Inc.
- Leading software application player with $152B market cap and moderate competitive pressure.
- Diverse segments: Small Business, Consumer, Credit Karma, and Professional Tax drive revenue.
- Moderate exposure through financial tech innovation and cloud-based solutions.
Strategy Inc
- Mid-sized software firm with $50B market cap, facing high competitive and market volatility.
- Focused on bitcoin treasury and AI-powered enterprise analytics software segments.
- High exposure due to bitcoin treasury operations and AI analytics in diverse markets.
Intuit Inc. vs Strategy Inc Positioning
Intuit’s diversified business model spans multiple financial solutions, offering stability but facing moderate competition. Strategy Inc concentrates on bitcoin and AI analytics, presenting niche advantages but higher market and technological risks.
Which has the best competitive advantage?
Intuit holds a slightly favorable moat with consistent value creation and declining profitability, whereas Strategy Inc has a very unfavorable moat, destroying value amid steep ROIC declines and profitability challenges.
Stock Comparison
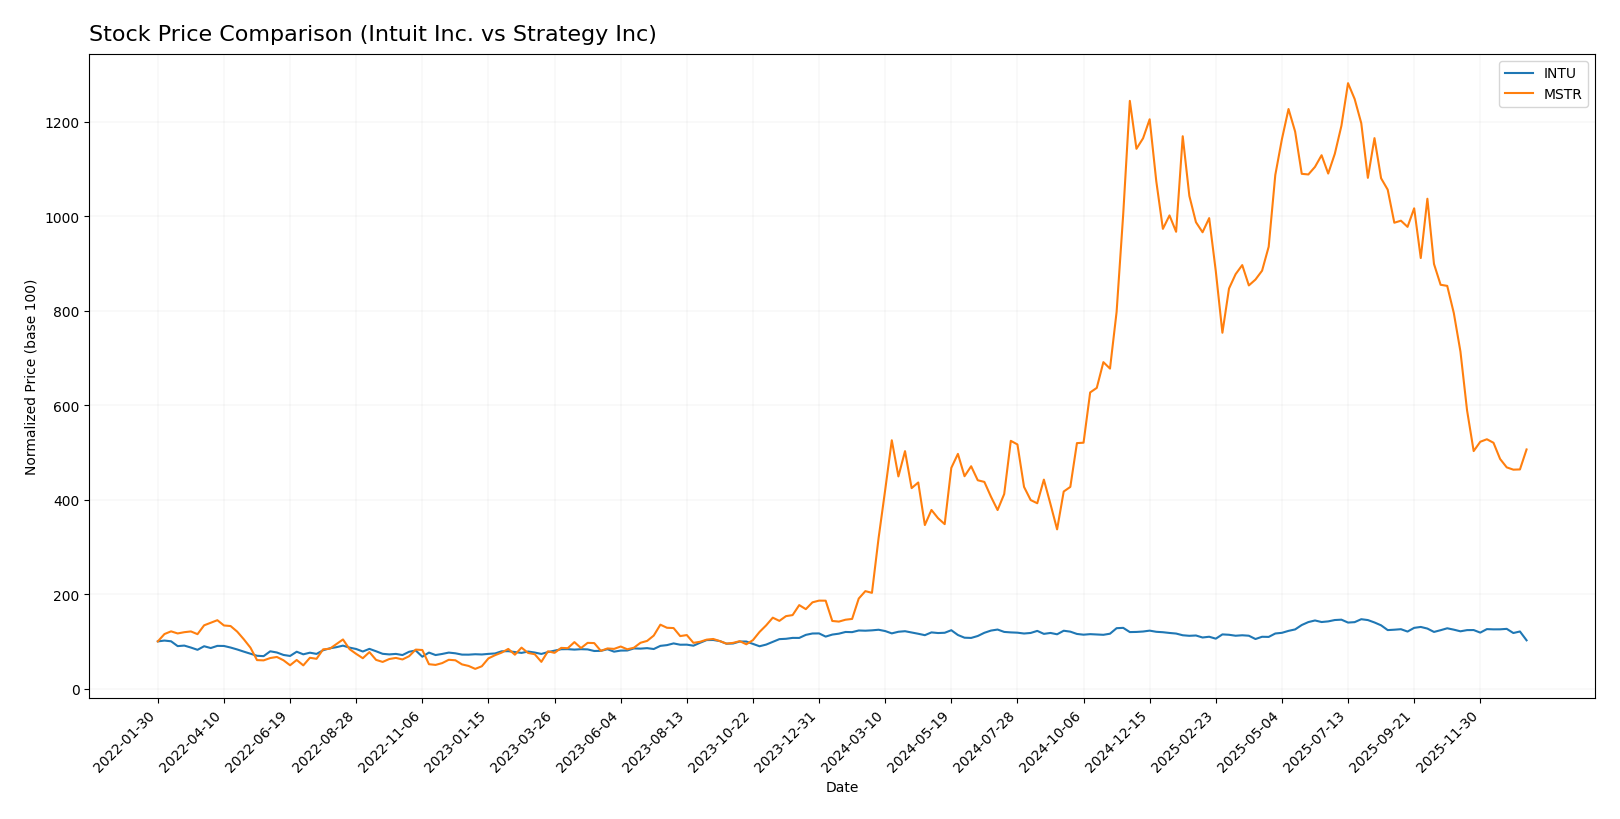
The stock price movements over the past 12 months reveal contrasting dynamics, with Intuit Inc. showing a sustained bearish trend marked by deceleration, while Strategy Inc. exhibits a strong bullish trend despite recent short-term declines.
Trend Analysis
Intuit Inc. experienced a -17.11% price decline over the past year, indicating a bearish trend with deceleration. The stock fluctuated between a high of 785.95 and a low of 546.91, showing moderate volatility with a standard deviation of 51.47.
Strategy Inc. recorded a 149.74% price increase over the same period, reflecting a bullish trend but with deceleration. Its price ranged from 68.74 to 434.58, with higher volatility at a 103.11 standard deviation.
Comparing both stocks, Strategy Inc. delivered the highest market performance over the past year, significantly outperforming Intuit Inc. despite recent short-term downward pressure.
Target Prices
The current target price consensus for Intuit Inc. and Strategy Inc reflects analyst expectations for significant upside potential.
| Company | Target High | Target Low | Consensus |
|---|---|---|---|
| Intuit Inc. | 880 | 700 | 798.4 |
| Strategy Inc | 705 | 175 | 433.57 |
Analysts project Intuit’s stock to rise substantially above its current price of $546, with a consensus near $798. Strategy Inc shows a wider range but a consensus more than double its current price of $171.88.
Analyst Opinions Comparison
This section compares analysts’ ratings and grades for Intuit Inc. and Strategy Inc.:
Rating Comparison
Intuit Inc. Rating
- Rating: B, considered very favorable overall.
- Discounted Cash Flow Score: 4, favorable, indicating positive future cash flow outlook.
- ROE Score: 4, favorable, showing efficient profit generation from equity.
- ROA Score: 5, very favorable, demonstrating excellent asset utilization.
- Debt To Equity Score: 2, moderate, reflecting some financial leverage risk.
- Overall Score: 3, moderate overall financial standing.
Strategy Inc Rating
- Rating: A-, also considered very favorable overall.
- Discounted Cash Flow Score: 1, very unfavorable, suggesting concerns over valuation.
- ROE Score: 4, favorable, similarly indicating efficient equity use.
- ROA Score: 5, very favorable, also indicating excellent asset utilization.
- Debt To Equity Score: 3, moderate, indicating slightly higher financial risk.
- Overall Score: 4, favorable overall financial standing.
Which one is the best rated?
Based strictly on the provided data, Strategy Inc. holds a better overall rating with an A- and a favorable score of 4, while Intuit Inc. has a B rating and a moderate score of 3. However, Intuit shows stronger discounted cash flow and lower debt risk scores.
Scores Comparison
Here is a comparison of the financial scores for Intuit Inc. and Strategy Inc:
Intuit Inc. Scores
- Altman Z-Score: 9.35, indicating a safe zone with low bankruptcy risk.
- Piotroski Score: 9, reflecting very strong financial health.
Strategy Inc Scores
- Altman Z-Score: 2.78, placing it in the grey zone with moderate bankruptcy risk.
- Piotroski Score: 4, considered average financial strength.
Which company has the best scores?
Intuit Inc. shows significantly stronger scores, with a high Altman Z-Score in the safe zone and a very strong Piotroski score. Strategy Inc. has moderate risk and average financial strength based on these metrics.
Grades Comparison
This section compares the recent grades assigned to Intuit Inc. and Strategy Inc. by reputable grading companies:
Intuit Inc. Grades
The table below shows recent grades from several well-known financial institutions for Intuit Inc.:
| Grading Company | Action | New Grade | Date |
|---|---|---|---|
| Wells Fargo | Downgrade | Equal Weight | 2026-01-08 |
| Wells Fargo | Maintain | Overweight | 2025-11-21 |
| RBC Capital | Maintain | Outperform | 2025-11-21 |
| BMO Capital | Maintain | Outperform | 2025-11-21 |
| Evercore ISI Group | Maintain | Outperform | 2025-11-18 |
| RBC Capital | Maintain | Outperform | 2025-09-02 |
| RBC Capital | Maintain | Outperform | 2025-08-22 |
| UBS | Maintain | Neutral | 2025-08-22 |
| Morgan Stanley | Maintain | Overweight | 2025-08-22 |
| Barclays | Maintain | Overweight | 2025-08-22 |
Intuit Inc. has predominantly maintained positive grades such as Outperform and Overweight, with a recent slight downgrade by Wells Fargo to Equal Weight.
Strategy Inc Grades
The table below shows recent grades from several recognized financial institutions for Strategy Inc.:
| Grading Company | Action | New Grade | Date |
|---|---|---|---|
| Citigroup | Maintain | Buy | 2025-12-22 |
| Bernstein | Maintain | Outperform | 2025-12-08 |
| Monness, Crespi, Hardt | Upgrade | Neutral | 2025-11-10 |
| HC Wainwright & Co. | Maintain | Buy | 2025-11-03 |
| Canaccord Genuity | Maintain | Buy | 2025-11-03 |
| BTIG | Maintain | Buy | 2025-10-31 |
| TD Cowen | Maintain | Buy | 2025-10-31 |
| Cantor Fitzgerald | Maintain | Overweight | 2025-10-31 |
| Wells Fargo | Downgrade | Equal Weight | 2025-09-30 |
| TD Cowen | Maintain | Buy | 2025-09-16 |
Strategy Inc exhibits a strong consensus of Buy and Outperform ratings, with a single downgrade to Equal Weight by Wells Fargo.
Which company has the best grades?
Both Intuit Inc. and Strategy Inc. have a consensus rating of “Buy,” with multiple institutions maintaining positive outlooks. Strategy Inc. shows a slight edge with more consistent Buy ratings, while Intuit holds several Outperform grades. Investors may consider these patterns in light of their risk tolerance and portfolio goals.
Strengths and Weaknesses
Below is a comparative table highlighting key strengths and weaknesses of Intuit Inc. (INTU) and Strategy Inc. (MSTR) based on recent financial and operational data:
| Criterion | Intuit Inc. (INTU) | Strategy Inc. (MSTR) |
|---|---|---|
| Diversification | Highly diversified with Consumer, Credit Karma, Global Business, and Professional Tax segments generating combined revenues above $18B in 2025. | Less diversified, mainly focused on License, Maintenance, Subscription, and Technology Services totaling around $460M in 2024. |
| Profitability | Strong profitability with a 20.55% net margin and favorable ROE (19.63%) and ROIC (14.78%). | Negative profitability with -251.73% net margin, negative ROE (-6.4%), and negative ROIC (-4.38%). |
| Innovation | Moderate innovation; steady product expansion especially in consumer and small business solutions, with slightly declining ROIC trend. | Innovation challenges evident from steep declining ROIC and profitability; struggling to maintain competitive edge. |
| Global presence | Significant global footprint, especially through Credit Karma and Global Business Solutions segments. | More limited global reach, primarily focused on licensing and technology services. |
| Market Share | Large market share in tax, small business, and consumer financial software markets. | Smaller market share in its niche, facing profitability and operational challenges. |
Key takeaways: Intuit shows strong diversification and profitability with a favorable financial profile, though its profitability is slightly declining. Strategy Inc. faces significant challenges with poor profitability and declining returns, signaling high risk for investors.
Risk Analysis
Below is a comparative table of key risks for Intuit Inc. and Strategy Inc. based on the latest available data for 2025 (INTU) and 2024 (MSTR):
| Metric | Intuit Inc. (INTU) | Strategy Inc. (MSTR) |
|---|---|---|
| Market Risk | Moderate (Beta 1.25) | High (Beta 3.43) |
| Debt level | Low (Debt/Equity 0.34) | Moderate (Debt/Equity 0.40) |
| Regulatory Risk | Moderate (Financial software) | Moderate to High (Crypto exposure) |
| Operational Risk | Low (Strong operational metrics) | High (Highly volatile Bitcoin treasury) |
| Environmental Risk | Low | Low |
| Geopolitical Risk | Low | Moderate (International crypto regulations) |
The most impactful risks are Strategy Inc.’s high market volatility and operational risk due to its Bitcoin treasury business and international exposure, which adds regulatory and geopolitical uncertainty. Intuit shows financial stability with low debt and operational resilience but faces moderate market risk typical of tech firms. Investors should weigh Strategy’s potential high reward against considerable volatility and regulatory challenges.
Which Stock to Choose?
Intuit Inc. (INTU) shows a favorable income evolution with strong revenue and profit growth over recent years. Its financial ratios reflect good profitability, low debt levels, and solid liquidity, supported by a very favorable rating of B and a slightly favorable moat despite a modest decline in ROIC.
Strategy Inc. (MSTR) exhibits an unfavorable income trend marked by negative margins and declining profitability. Financial ratios largely indicate weakness, including poor liquidity and high risk, but the company holds a very favorable rating of A- mainly driven by some stable asset returns, though its moat is very unfavorable.
Investors with a preference for quality and stable growth might find Intuit’s consistent value creation and strong financial health more appealing. Conversely, those with higher risk tolerance and interest in turnaround potential could interpret Strategy’s contrasting rating and bullish long-term price trend as an opportunity, albeit with significant caution.
Disclaimer: Investment carries a risk of loss of initial capital. The past performance is not a reliable indicator of future results. Be sure to understand risks before making an investment decision.
Go Further
I encourage you to read the complete analyses of Intuit Inc. and Strategy Inc to enhance your investment decisions: