In the fast-evolving software industry, Intuit Inc. and SoundHound AI, Inc. stand out as innovators in financial management and voice AI technology, respectively. Both companies operate in application software but target different niches, with Intuit focusing on financial solutions and SoundHound on conversational AI platforms. This article will dissect their strengths and strategies to help you decide which company holds the most promise for your investment portfolio.
Table of contents
Companies Overview
I will begin the comparison between Intuit Inc. and SoundHound AI, Inc. by providing an overview of these two companies and their main differences.
Intuit Overview
Intuit Inc. delivers financial management and compliance products for consumers, small businesses, and accounting professionals across the US, Canada, and internationally. Operating through segments like Small Business & Self-Employed and Credit Karma, Intuit’s offerings include QuickBooks, TurboTax, and payment-processing solutions. Founded in 1983, it is a major player in software applications with a market cap of $151.6B and employs 18,800 people.
SoundHound Overview
SoundHound AI, Inc. focuses on developing voice AI platforms that enable businesses to create conversational voice assistants. Its Houndify platform offers speech recognition, natural language processing, and text-to-speech technologies. Headquartered in Santa Clara, California, SoundHound went public in 2022, has a market cap of $4.7B, and employs 842 staff, positioning itself as a niche innovator in software applications.
Key similarities and differences
Both Intuit and SoundHound operate in the software application industry and are listed on NASDAQ, targeting technology-driven solutions. Intuit’s business model centers on financial software and services for a broad client base, while SoundHound specializes in voice AI platforms for conversational experiences. Intuit’s scale, with a large workforce and diversified offerings, contrasts with SoundHound’s smaller size and focused AI technology niche.
Income Statement Comparison
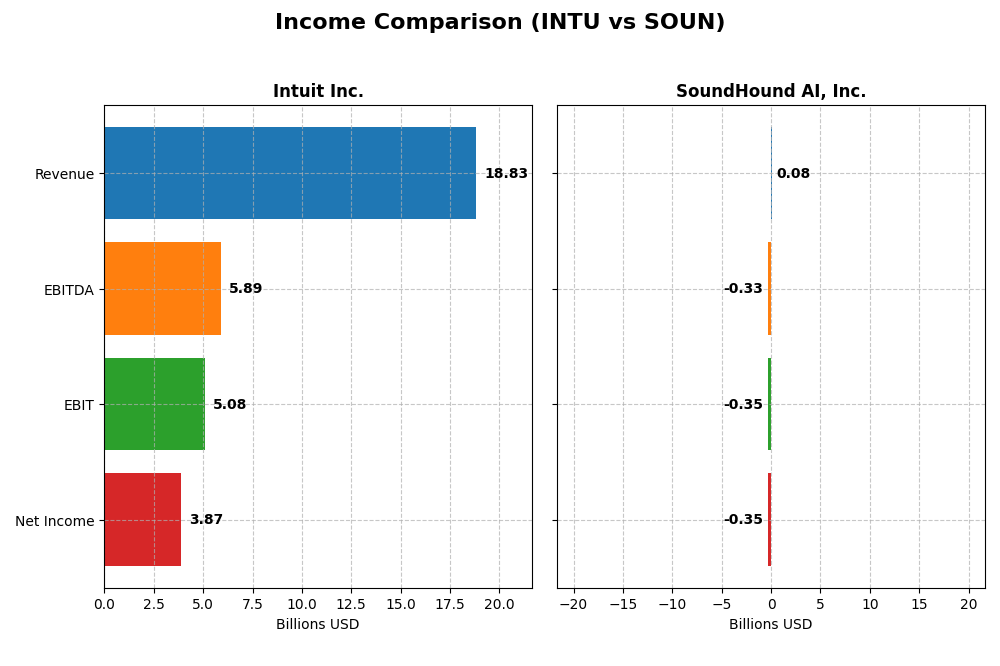
The table below presents a side-by-side comparison of key income statement metrics for Intuit Inc. and SoundHound AI, Inc. for their most recent fiscal years.
| Metric | Intuit Inc. (INTU) | SoundHound AI, Inc. (SOUN) |
|---|---|---|
| Market Cap | 151.6B | 4.7B |
| Revenue | 18.83B | 85M |
| EBITDA | 5.89B | -329M |
| EBIT | 5.08B | -348M |
| Net Income | 3.87B | -351M |
| EPS | 13.82 | -1.04 |
| Fiscal Year | 2025 | 2024 |
Income Statement Interpretations
Intuit Inc.
Intuit’s revenue and net income have shown consistent growth from 2021 to 2025, with revenue nearly doubling to $18.8B and net income rising to $3.87B. Margins remain strong, highlighted by a gross margin of 80.76% and a net margin of 20.55%. In 2025, revenue growth accelerated to 15.63%, supported by a 12.92% net margin increase, indicating improved profitability and operational efficiency.
SoundHound AI, Inc.
SoundHound’s revenue expanded significantly, rising by 550.63% over 2020–2024 to $84.7M, yet net income remained negative at -$351M in 2024. The company’s gross margin of 48.86% is moderate, but it suffers from substantial operating losses, reflected in an unfavorable EBIT margin of -410.61% and a negative net margin of -414.06%. Despite strong revenue growth, profitability remains a concern with margins deteriorating over the latest year.
Which one has the stronger fundamentals?
Intuit demonstrates robust fundamentals with sustained revenue and profit growth, favorable margins, and controlled interest expenses, reflecting operational strength and scalability. In contrast, SoundHound shows impressive revenue expansion but persistent and deep losses, resulting in unfavorable profitability metrics. Therefore, Intuit’s income statement reflects stronger and more stable financial health compared to SoundHound’s current challenges.
Financial Ratios Comparison
The following table summarizes key financial ratios for Intuit Inc. (INTU) and SoundHound AI, Inc. (SOUN) based on their most recent fiscal year data, providing a side-by-side comparison of profitability, valuation, liquidity, leverage, and efficiency metrics.
| Ratios | Intuit Inc. (2025) | SoundHound AI, Inc. (2024) |
|---|---|---|
| ROE | 19.63% | -191.99% |
| ROIC | 14.78% | -68.13% |
| P/E | 56.82 | -19.15 |
| P/B | 11.15 | 36.76 |
| Current Ratio | 1.36 | 3.77 |
| Quick Ratio | 1.36 | 3.77 |
| D/E (Debt-to-Equity) | 0.34 | 0.02 |
| Debt-to-Assets | 17.96% | 0.79% |
| Interest Coverage | 19.93 | -28.05 |
| Asset Turnover | 0.51 | 0.15 |
| Fixed Asset Turnover | 12.54 | 14.28 |
| Payout Ratio | 30.73% | 0% |
| Dividend Yield | 0.54% | 0% |
Interpretation of the Ratios
Intuit Inc.
Intuit’s financial ratios are generally strong, with favorable returns on equity (19.63%) and invested capital (14.78%), supported by good debt management and interest coverage. However, valuation multiples like P/E (56.82) and P/B (11.15) appear stretched, and dividend yield is modest at 0.54%. The company pays dividends, but the low yield and payout warrant monitoring for sustainability.
SoundHound AI, Inc.
SoundHound shows weak financial ratios, including deeply negative net margin (-414.06%) and return on equity (-191.99%), reflecting operational losses. The company maintains low debt levels and a strong quick ratio but suffers from poor asset turnover and negative interest coverage. SoundHound does not pay dividends, likely due to reinvestment in R&D and growth initiatives typical of a high-growth tech firm.
Which one has the best ratios?
Intuit’s ratios are predominantly favorable, reflecting profitability, solid capital returns, and manageable leverage, though valuation is a concern. SoundHound’s ratios are mostly unfavorable, indicating financial distress and operational challenges. Based purely on ratio evaluation, Intuit presents a stronger financial profile compared to SoundHound.
Strategic Positioning
This section compares the strategic positioning of Intuit and SoundHound AI, including market position, key segments, and exposure to technological disruption:
Intuit Inc.
- Leading financial software provider with strong competitive pressure in application software.
- Diverse segments: Small Business & Self-Employed, Consumer, Credit Karma, and Professional Tax solutions.
- Operates in established financial management space; moderate exposure to tech disruption.
SoundHound AI, Inc.
- Smaller market cap voice AI company facing high beta and competitive tech sector pressure.
- Focused on voice AI platform with Hosted Services, Licensing, and Professional Services.
- Highly exposed to technological disruption due to AI innovation in conversational experiences.
Intuit vs SoundHound AI Positioning
Intuit pursues a diversified business model across multiple financial software segments, providing stable revenue streams. SoundHound AI concentrates on voice AI technology, presenting growth potential but higher volatility. Intuit’s breadth offers scale advantages; SoundHound’s focus targets innovation-driven markets.
Which has the best competitive advantage?
Intuit shows a slightly favorable moat with value creation despite declining profitability. SoundHound AI has a slightly unfavorable moat, destroying value but improving profitability. Intuit currently holds a stronger competitive advantage based on efficient capital use and established market presence.
Stock Comparison
The stock price chart illustrates significant divergences in price movements and trading dynamics between Intuit Inc. and SoundHound AI, Inc. over the past 12 months, highlighting a pronounced bullish surge for SoundHound contrasted with a bearish decline for Intuit.
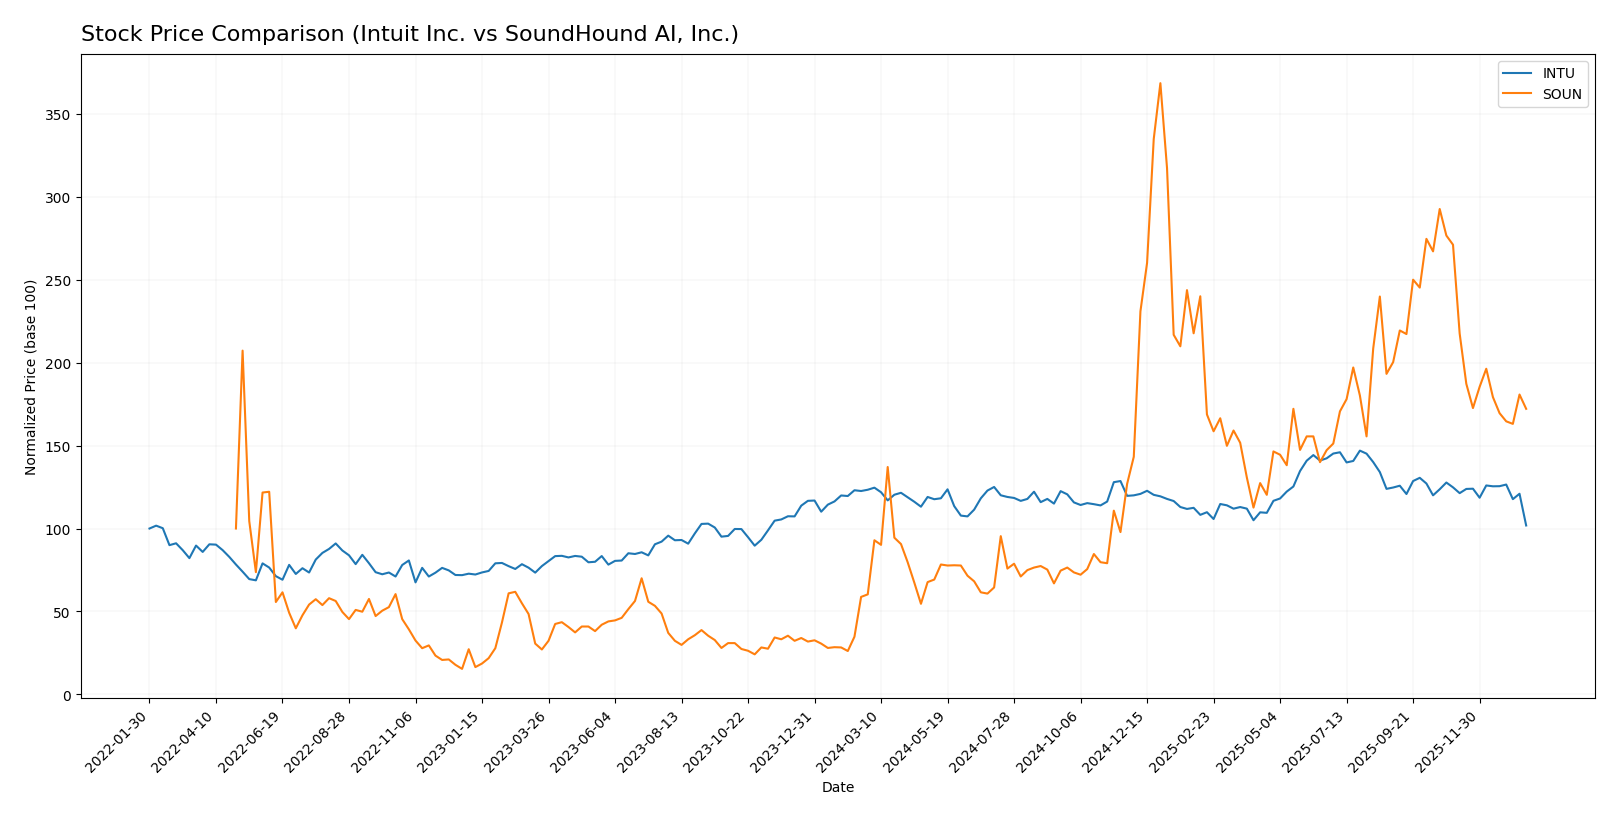
Trend Analysis
Intuit Inc. experienced a bearish trend over the past year with a price decline of 17.46%, showing deceleration and a high volatility level indicated by a standard deviation of 51.52. The stock’s price ranged from a high of 785.95 to a low of 544.62.
SoundHound AI, Inc. displayed a strong bullish trend with a remarkable 185.46% increase in price over the past 12 months, despite deceleration. The stock showed low volatility with a standard deviation of 4.66, trading between 3.55 and 23.95.
Comparing both stocks, SoundHound AI, Inc. delivered the highest market performance, significantly outperforming Intuit Inc. in price appreciation over the analyzed period.
Target Prices
The current analyst consensus presents a positive outlook for both Intuit Inc. and SoundHound AI, Inc.
| Company | Target High | Target Low | Consensus |
|---|---|---|---|
| Intuit Inc. | 880 | 700 | 798.4 |
| SoundHound AI, Inc. | 15 | 11 | 13.33 |
Analysts expect Intuit’s stock to appreciate significantly from its current price of 544.46 USD, while SoundHound AI shows potential upside from 11.19 USD, indicating favorable growth prospects for both stocks.
Analyst Opinions Comparison
This section compares analysts’ ratings and grades for Intuit Inc. and SoundHound AI, Inc.:
Rating Comparison
Intuit Inc. Rating
- Rating: B, indicating a very favorable view
- Discounted Cash Flow Score: 4, favorable
- ROE Score: 4, favorable
- ROA Score: 5, very favorable
- Debt To Equity Score: 2, moderate
- Overall Score: 3, moderate
SoundHound AI, Inc. Rating
- Rating: C-, also marked as very favorable
- Discounted Cash Flow Score: 1, very unfavorable
- ROE Score: 1, very unfavorable
- ROA Score: 1, very unfavorable
- Debt To Equity Score: 4, favorable
- Overall Score: 1, very unfavorable
Which one is the best rated?
Based strictly on the provided data, Intuit Inc. holds higher scores in discounted cash flow, ROE, ROA, and overall rating, while SoundHound AI only scores better in debt-to-equity. Intuit is clearly better rated overall.
Scores Comparison
Here is a comparison of the Altman Z-Score and Piotroski Score for Intuit Inc. and SoundHound AI, Inc.:
INTU Scores
- Altman Z-Score: 9.35, indicating a safe zone with very low bankruptcy risk.
- Piotroski Score: 9, classified as very strong financial health.
SOUN Scores
- Altman Z-Score: 6.62, indicating a safe zone with low bankruptcy risk.
- Piotroski Score: 3, classified as very weak financial health.
Which company has the best scores?
Intuit demonstrates stronger financial health with a higher Altman Z-Score and a very strong Piotroski Score. SoundHound, while safe from bankruptcy risk, shows weaker financial strength based on its Piotroski Score.
Grades Comparison
The grade data for Intuit Inc. and SoundHound AI, Inc. from verified grading companies are as follows:
Intuit Inc. Grades
The table below summarizes recent grades from reputable financial institutions for Intuit Inc.:
| Grading Company | Action | New Grade | Date |
|---|---|---|---|
| Wells Fargo | Downgrade | Equal Weight | 2026-01-08 |
| Wells Fargo | Maintain | Overweight | 2025-11-21 |
| RBC Capital | Maintain | Outperform | 2025-11-21 |
| BMO Capital | Maintain | Outperform | 2025-11-21 |
| Evercore ISI Group | Maintain | Outperform | 2025-11-18 |
| RBC Capital | Maintain | Outperform | 2025-09-02 |
| RBC Capital | Maintain | Outperform | 2025-08-22 |
| UBS | Maintain | Neutral | 2025-08-22 |
| Morgan Stanley | Maintain | Overweight | 2025-08-22 |
| Barclays | Maintain | Overweight | 2025-08-22 |
Intuit’s grades mostly reflect strong buy-side support with multiple “Outperform” and “Overweight” ratings, although a recent downgrade by Wells Fargo to “Equal Weight” indicates some caution.
SoundHound AI, Inc. Grades
Below is the summary of recent financial grades for SoundHound AI, Inc.:
| Grading Company | Action | New Grade | Date |
|---|---|---|---|
| Piper Sandler | Maintain | Neutral | 2026-01-05 |
| Cantor Fitzgerald | Upgrade | Overweight | 2025-12-12 |
| DA Davidson | Maintain | Buy | 2025-11-18 |
| Piper Sandler | Maintain | Neutral | 2025-11-07 |
| HC Wainwright & Co. | Maintain | Buy | 2025-10-16 |
| HC Wainwright & Co. | Maintain | Buy | 2025-09-17 |
| Wedbush | Maintain | Outperform | 2025-09-11 |
| DA Davidson | Maintain | Buy | 2025-09-10 |
| Ladenburg Thalmann | Upgrade | Buy | 2025-08-11 |
| Wedbush | Maintain | Outperform | 2025-08-08 |
SoundHound AI shows a generally positive outlook with consistent “Buy” and “Outperform” ratings, alongside recent upgrades, though some “Neutral” ratings suggest moderate caution.
Which company has the best grades?
Intuit Inc. holds a stronger consensus with a larger number of “Outperform” and “Overweight” ratings from major firms, reflecting broader analyst confidence. SoundHound AI, Inc. receives mostly “Buy” and “Outperform” grades but fewer in volume and some neutral views, indicating a relatively more cautious sentiment. Investors may interpret these differences as a signal of varying analyst conviction and risk profiles.
Strengths and Weaknesses
Below is a comparative summary of the key strengths and weaknesses of Intuit Inc. (INTU) and SoundHound AI, Inc. (SOUN) based on the latest financial and operational data.
| Criterion | Intuit Inc. (INTU) | SoundHound AI, Inc. (SOUN) |
|---|---|---|
| Diversification | Highly diversified revenue streams: Consumer, Global Business, Credit Karma, Professional Tax | Limited diversification, mainly Hosted Services, Licensing, and Professional Services |
| Profitability | Strong profitability with 20.55% net margin and ROIC of 14.78% (favorable) | Negative profitability: -414% net margin, negative ROIC (-68.13%) (unfavorable) |
| Innovation | Consistent product innovation supporting financial and business solutions | Growing ROIC trend indicating improving profitability potential |
| Global presence | Significant global footprint with multiple business segments | Smaller scale, niche AI market player |
| Market Share | Large market share in financial software and services | Emerging player with limited market share |
Key takeaways: Intuit shows strong profitability and robust diversification, though its ROIC is slightly declining, signaling caution. SoundHound is still unprofitable but demonstrates improving operational efficiency and growth potential in AI-driven services. Investors should weigh Intuit’s stability against SoundHound’s growth risks.
Risk Analysis
Below is a comparison table highlighting key risk factors for Intuit Inc. and SoundHound AI, Inc. based on the most recent data available:
| Metric | Intuit Inc. (INTU) | SoundHound AI, Inc. (SOUN) |
|---|---|---|
| Market Risk | Moderate (Beta 1.25) | High (Beta 2.88) |
| Debt level | Low (D/E 0.34) | Very Low (D/E 0.02) |
| Regulatory Risk | Moderate | Moderate |
| Operational Risk | Low | High |
| Environmental Risk | Low | Low |
| Geopolitical Risk | Moderate | Moderate |
Intuit’s risks are generally moderate with manageable debt and operational stability, though market volatility is notable. SoundHound faces higher market and operational risks due to its startup status, negative profitability, and weak financial metrics, despite very low debt. Investors should weigh SoundHound’s growth potential against its higher risk profile.
Which Stock to Choose?
Intuit Inc. (INTU) shows consistent income growth with a favorable global income statement evaluation of 92.86% and strong profitability metrics, including a 20.55% net margin and 19.63% ROE. Its debt levels are moderate, supported by a favorable debt-to-equity ratio and solid interest coverage, earning it a very favorable B rating.
SoundHound AI, Inc. (SOUN) exhibits rapid revenue growth but suffers from significant losses reflected in an unfavorable global income statement opinion and negative profitability ratios such as a -414.06% net margin and -191.99% ROE. Despite low debt levels, its financial ratios and interest coverage appear unfavorable, yet it holds a very favorable C- rating overall.
Investors with a risk-tolerant profile focused on growth might find SOUN’s expanding revenue attractive despite its current losses, while those prioritizing financial stability and sustained profitability may view INTU’s strong income and favorable ratios as indicative of quality and value creation.
Disclaimer: Investment carries a risk of loss of initial capital. The past performance is not a reliable indicator of future results. Be sure to understand risks before making an investment decision.
Go Further
I encourage you to read the complete analyses of Intuit Inc. and SoundHound AI, Inc. to enhance your investment decisions: