In the evolving landscape of technology-driven finance, Intuit Inc. and Snowflake Inc. stand out as influential players. Both operate within the software application industry but focus on different facets—Intuit on financial management solutions and Snowflake on cloud-based data platforms. Their shared emphasis on innovation and market disruption makes them compelling candidates for comparison. This article will help you decide which company holds the most promise for your investment portfolio.
Table of contents
Companies Overview
I will begin the comparison between Intuit and Snowflake by providing an overview of these two companies and their main differences.
Intuit Overview
Intuit Inc. is a leading provider of financial management and compliance products for consumers, small businesses, self-employed individuals, and accounting professionals. Operating primarily in the US, Canada, and internationally, Intuit offers solutions such as QuickBooks, TurboTax, and Credit Karma. Founded in 1983 and headquartered in Mountain View, California, Intuit holds a strong market position in application software with a diversified product portfolio.
Snowflake Overview
Snowflake Inc. delivers a cloud-based data platform designed to consolidate data into a single source of truth, enabling business insights and data-driven applications. Founded in 2012 and based in Bozeman, Montana, Snowflake serves organizations of various sizes across multiple industries. Listed on the NYSE since 2020, Snowflake focuses on cloud data warehousing and analytics, positioning itself as an innovative player in the software sector.
Key similarities and differences
Both Intuit and Snowflake operate in the technology sector with a focus on software applications, but their business models differ significantly. Intuit provides financial management tools primarily targeting consumers and small businesses, while Snowflake offers a cloud data platform aimed at enterprises seeking data consolidation and analytics. Intuit has a longer market presence and broader product diversity, whereas Snowflake is a newer company with a specialized cloud-centric approach.
Income Statement Comparison
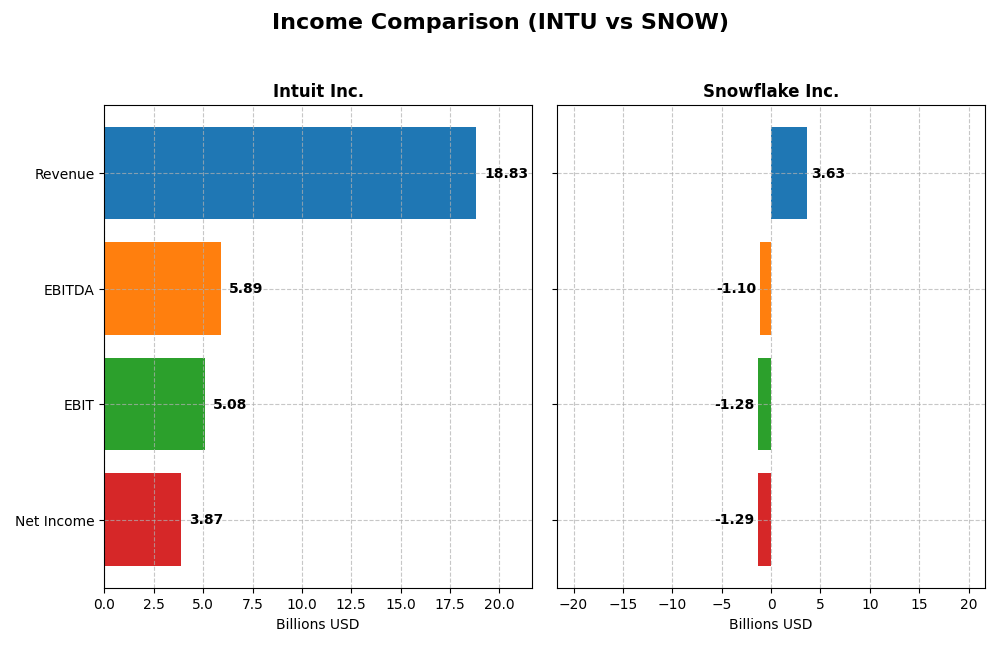
This table compares the key income statement metrics for Intuit Inc. and Snowflake Inc. for the most recent fiscal year available, providing a snapshot of their financial performance.
| Metric | Intuit Inc. (INTU) | Snowflake Inc. (SNOW) |
|---|---|---|
| Market Cap | 152B | 70.8B |
| Revenue | 18.8B | 3.63B |
| EBITDA | 5.89B | -1.10B |
| EBIT | 5.08B | -1.28B |
| Net Income | 3.87B | -1.29B |
| EPS | 13.82 | -3.86 |
| Fiscal Year | 2025 | 2025 |
Income Statement Interpretations
Intuit Inc.
Intuit showed consistent revenue growth from 9.63B in 2021 to 18.83B in 2025, nearly doubling over five years. Net income rose from 2.06B to 3.87B, reflecting strong profit expansion. Margins remained robust, with gross margin steady around 80.76% and net margin at 20.55% in 2025. The latest year marked favorable growth acceleration, including a 15.63% revenue increase and a 31.06% rise in EPS.
Snowflake Inc.
Snowflake’s revenue surged impressively from 592M in 2021 to 3.63B in 2025, a significant expansion. However, net income remained negative, declining further from -539M to -1.29B. Gross margin was favorable at 66.5%, but both EBIT and net margins were deeply negative at -35.36% and -35.45% respectively in 2025. The latest year showed strong revenue growth of 29.21%, yet earnings deteriorated with a 51% drop in EBIT and EPS.
Which one has the stronger fundamentals?
Intuit demonstrates stronger fundamentals with stable profitability, positive net income growth, and high margins, reflecting efficient cost management and solid earnings. Snowflake’s rapid revenue growth contrasts with persistent net losses and negative margins, indicating ongoing challenges in profitability. Intuit’s financials show a more favorable income statement profile, while Snowflake’s remain mixed with significant risks.
Financial Ratios Comparison
The table below compares key financial ratios for Intuit Inc. and Snowflake Inc. based on their most recent fiscal year data available, providing a snapshot of profitability, liquidity, leverage, and market valuation metrics.
| Ratios | Intuit Inc. (2025 FY) | Snowflake Inc. (2025 FY) |
|---|---|---|
| ROE | 19.6% | -42.9% |
| ROIC | 14.8% | -25.2% |
| P/E | 56.8 | -47.0 |
| P/B | 11.2 | 20.1 |
| Current Ratio | 1.36 | 1.75 |
| Quick Ratio | 1.36 | 1.75 |
| D/E | 0.34 | 0.90 |
| Debt-to-Assets | 18.0% | 29.7% |
| Interest Coverage | 19.9 | -527.7 |
| Asset Turnover | 0.51 | 0.40 |
| Fixed Asset Turnover | 12.5 | 5.53 |
| Payout ratio | 30.7% | 0% |
| Dividend yield | 0.54% | 0% |
Interpretation of the Ratios
Intuit Inc.
Intuit presents mostly strong financial ratios with favorable net margin (20.55%), ROE (19.63%), and ROIC (14.78%), indicating efficient profitability and capital use. Some valuation metrics like PE (56.82) and PB (11.15) are unfavorable, suggesting a high market price relative to earnings and book value. The company pays dividends with a low dividend yield (0.54%), balanced payout, and solid free cash flow coverage, posing limited distribution risk.
Snowflake Inc.
Snowflake’s ratios reveal challenges, with unfavorable net margin (-35.45%), ROE (-42.86%), and ROIC (-25.24%), reflecting operating losses and negative returns. The company does not pay dividends, consistent with its high-growth phase and reinvestment strategy. Liquidity ratios are favorable, but weak interest coverage and asset turnover ratios highlight operational risks and potential inefficiencies.
Which one has the best ratios?
Intuit holds the advantage with a majority of favorable ratios, signaling stronger profitability, capital efficiency, and manageable risk. Snowflake’s metrics indicate more financial strain and less profitability, aligned with its growth and reinvestment focus. Overall, Intuit’s ratios present a more robust financial profile compared to Snowflake’s slightly unfavorable evaluation.
Strategic Positioning
This section compares the strategic positioning of Intuit and Snowflake, including market position, key segments, and exposure to technological disruption:
Intuit
- Leading software provider with strong competitive pressure in financial management software.
- Diversified segments: Small business, consumer tax, Credit Karma, and professional tax services.
- Moderate exposure due to cloud-based solutions and evolving fintech landscape.
Snowflake
- Cloud data platform with significant competition in cloud and data analytics sectors.
- Concentrated focus on cloud-based data platform products and professional services.
- High exposure as a cloud-native platform in a rapidly evolving data technology environment.
Intuit vs Snowflake Positioning
Intuit pursues a diversified approach across multiple financial software segments, offering stability but facing broad competitive pressure. Snowflake’s concentrated focus on cloud data platforms provides specialization but increases vulnerability to rapid tech shifts.
Which has the best competitive advantage?
Intuit shows a slightly favorable moat with value creation and stable returns, while Snowflake’s very unfavorable moat indicates value destruction and declining profitability, reflecting weaker competitive advantage based on MOAT evaluation.
Stock Comparison
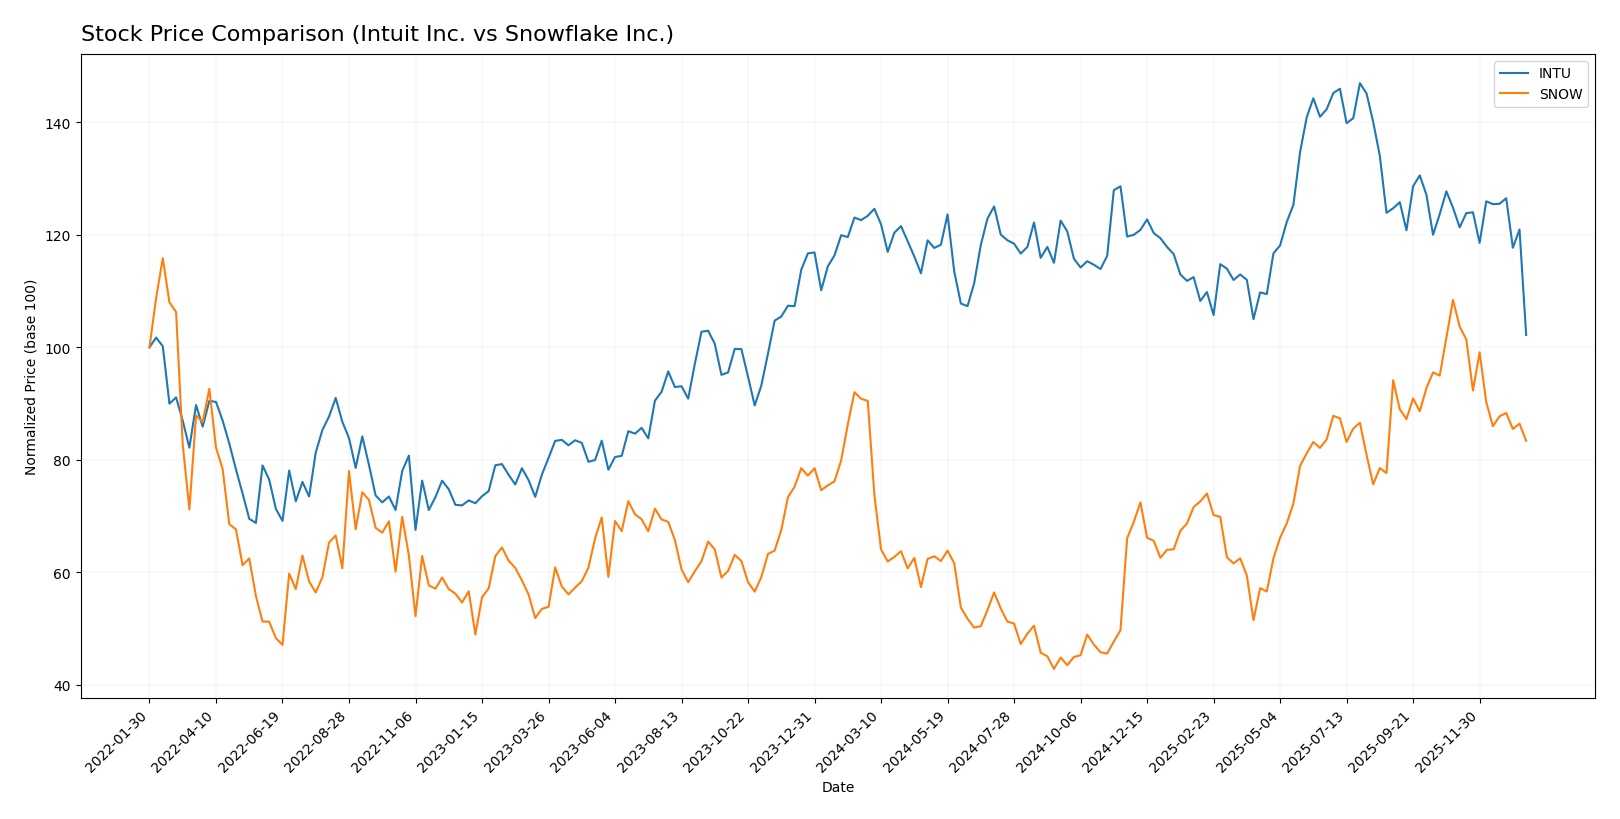
The stock price movements of Intuit Inc. and Snowflake Inc. over the past 12 months reveal notable bearish trends with decelerating downward momentum, marked by significant price drops and shifts in trading volumes.
Trend Analysis
Intuit Inc. experienced a -17.17% price decline over the past year, indicating a bearish trend with decelerating losses and high volatility, as shown by a 51.48 standard deviation and a peak price of 785.95.
Snowflake Inc. posted a -7.82% price change during the same period, also bearish with deceleration and a standard deviation of 42.61, reaching a high of 274.88 and a low of 108.56.
Comparing both, Intuit’s stock showed a larger negative return, thus Snowflake delivered the relatively higher market performance over the past year.
Target Prices
Analysts present a cautiously optimistic consensus on target prices for Intuit Inc. and Snowflake Inc.
| Company | Target High | Target Low | Consensus |
|---|---|---|---|
| Intuit Inc. | 880 | 700 | 798.4 |
| Snowflake Inc. | 325 | 237 | 281.86 |
The target consensus for Intuit at 798.4 significantly exceeds its current price of 545.6, indicating expected growth. Snowflake’s consensus target of 281.86 also suggests upside potential from its current 211.4 price, reflecting positive analyst outlooks.
Analyst Opinions Comparison
This section compares analysts’ ratings and grades for Intuit Inc. and Snowflake Inc.:
Rating Comparison
Intuit Inc. Rating
- Rating: B, indicating a very favorable outlook from analysts.
- Discounted Cash Flow Score: 4, considered favorable for valuation based on future cash flow.
- ROE Score: 4, showing favorable efficiency in generating profit from equity.
- ROA Score: 5, very favorable in asset utilization to generate earnings.
- Debt To Equity Score: 2, moderate financial risk with some debt relative to equity.
- Overall Score: 3, moderate overall financial standing.
Snowflake Inc. Rating
- Rating: C-, reflecting a very unfavorable overall assessment.
- Discounted Cash Flow Score: 3, seen as moderate in valuation outlook.
- ROE Score: 1, indicating very unfavorable profit generation from shareholders’ equity.
- ROA Score: 1, very unfavorable in asset utilization efficiency.
- Debt To Equity Score: 1, very unfavorable due to higher financial risk.
- Overall Score: 1, very unfavorable overall financial position.
Which one is the best rated?
Based on the provided data, Intuit Inc. is better rated overall, with higher scores across discounted cash flow, ROE, ROA, and debt-to-equity metrics. Snowflake Inc. scores are consistently very unfavorable, indicating weaker financial standing.
Scores Comparison
Here is a comparison of Intuit and Snowflake based on their Altman Z-Score and Piotroski Score:
Intuit Scores
- Altman Z-Score: 9.35, indicating a safe financial zone with very low bankruptcy risk.
- Piotroski Score: 9, categorized as very strong, reflecting excellent financial health.
Snowflake Scores
- Altman Z-Score: 5.36, also in the safe zone but lower than Intuit’s score.
- Piotroski Score: 4, considered average, suggesting moderate financial strength.
Which company has the best scores?
Intuit has the best scores with a higher Altman Z-Score indicating stronger financial safety, and a very strong Piotroski Score compared to Snowflake’s average rating. This suggests Intuit is financially healthier based on these metrics.
Grades Comparison
Here is the comparison of recent grades assigned to Intuit Inc. and Snowflake Inc. by established grading companies:
Intuit Inc. Grades
The following table summarizes Intuit Inc.’s recent grades from recognized financial institutions:
| Grading Company | Action | New Grade | Date |
|---|---|---|---|
| Wells Fargo | Downgrade | Equal Weight | 2026-01-08 |
| Wells Fargo | Maintain | Overweight | 2025-11-21 |
| RBC Capital | Maintain | Outperform | 2025-11-21 |
| BMO Capital | Maintain | Outperform | 2025-11-21 |
| Evercore ISI Group | Maintain | Outperform | 2025-11-18 |
| RBC Capital | Maintain | Outperform | 2025-09-02 |
| RBC Capital | Maintain | Outperform | 2025-08-22 |
| UBS | Maintain | Neutral | 2025-08-22 |
| Morgan Stanley | Maintain | Overweight | 2025-08-22 |
| Barclays | Maintain | Overweight | 2025-08-22 |
Intuit’s grades mostly remain positive with several “Outperform” and “Overweight” ratings, though a recent downgrade to “Equal Weight” from Wells Fargo suggests some caution.
Snowflake Inc. Grades
Below are Snowflake Inc.’s recent grades from credible grading firms:
| Grading Company | Action | New Grade | Date |
|---|---|---|---|
| Barclays | Downgrade | Equal Weight | 2026-01-12 |
| Argus Research | Upgrade | Buy | 2026-01-08 |
| Citigroup | Maintain | Buy | 2025-12-08 |
| Wells Fargo | Maintain | Overweight | 2025-12-04 |
| Keybanc | Maintain | Overweight | 2025-12-04 |
| Piper Sandler | Maintain | Overweight | 2025-12-04 |
| Morgan Stanley | Maintain | Overweight | 2025-12-04 |
| Wedbush | Maintain | Outperform | 2025-12-04 |
| Deutsche Bank | Maintain | Buy | 2025-12-04 |
| Cantor Fitzgerald | Maintain | Overweight | 2025-12-04 |
Snowflake shows strong support from analysts with multiple “Buy,” “Overweight,” and “Outperform” ratings, despite a recent downgrade by Barclays to “Equal Weight.”
Which company has the best grades?
Both Intuit Inc. and Snowflake Inc. hold predominantly positive grades, with Snowflake slightly ahead due to a higher number of “Buy” and “Overweight” ratings. This may indicate stronger analyst confidence in Snowflake’s growth potential, which investors could consider when assessing risk and reward.
Strengths and Weaknesses
Below is a comparison of Intuit Inc. and Snowflake Inc. across key criteria based on their latest financial and operational data.
| Criterion | Intuit Inc. | Snowflake Inc. |
|---|---|---|
| Diversification | Highly diversified: Consumer, Credit Karma, Global Business Solutions, Professional Tax segments | Less diversified: primarily Product and Professional Services |
| Profitability | Strong profitability with 20.55% net margin and 14.78% ROIC (creating value) | Negative profitability, -35.45% net margin and -25.24% ROIC (shedding value) |
| Innovation | Steady innovation with strong fixed asset turnover (12.54) supporting efficiency | Innovation is ongoing but profitability challenges persist, reflected in declining ROIC |
| Global presence | Solid global reach via multiple business segments and consumer base | Growing global presence but still building scale and profitability |
| Market Share | Established market leader in financial and tax software segments | Rapidly expanding market share in cloud data platform but at high cost |
Intuit demonstrates strong diversification and consistent profitability, although its ROIC trend is slightly declining. Snowflake shows rapid growth and innovation but faces significant profitability challenges and value destruction, indicating higher investment risk.
Risk Analysis
Below is a comparative table outlining key risks for Intuit Inc. and Snowflake Inc. based on the most recent data from 2025:
| Metric | Intuit Inc. (INTU) | Snowflake Inc. (SNOW) |
|---|---|---|
| Market Risk | Beta 1.25, moderate volatility | Beta 1.14, slightly lower volatility |
| Debt level | Low debt-to-equity 0.34, favorable | Higher debt-to-equity 0.9, moderate risk |
| Regulatory Risk | Moderate, financial software compliance | Moderate, cloud data regulations evolving |
| Operational Risk | Low, strong operational margins | Higher, negative net margin indicates operational challenges |
| Environmental Risk | Low, technology sector standard | Low, technology sector standard |
| Geopolitical Risk | Moderate, global operations exposure | Moderate, expanding international footprint |
The most impactful risks are Snowflake’s operational losses and higher leverage, which pose significant financial stability concerns. Intuit benefits from strong profitability and a conservative debt profile, making it less risky in the current environment. Investors should closely monitor Snowflake’s path to profitability and debt management.
Which Stock to Choose?
Intuit Inc. (INTU) shows strong income growth with a 15.63% revenue rise in 2025 and favorable profitability metrics, including a 20.55% net margin. Its financial ratios are mostly favorable, supported by low debt and a solid current ratio, resulting in a very favorable “B” rating and a safe Altman Z-Score of 9.35.
Snowflake Inc. (SNOW) experienced a 29.21% revenue increase in 2025 but suffers from negative profitability with a -35.45% net margin and unfavorable ROE and ROIC. Its financial ratios are slightly unfavorable overall, with moderate debt levels, and it holds a “C-” rating with a safe Altman Z-Score of 5.36.
Investors seeking stability and consistent profitability might find Intuit’s favorable income and financial ratios more appealing, while those with a tolerance for risk and a focus on high revenue growth could view Snowflake’s profile as indicative of growth potential despite current profitability challenges.
Disclaimer: Investment carries a risk of loss of initial capital. The past performance is not a reliable indicator of future results. Be sure to understand risks before making an investment decision.
Go Further
I encourage you to read the complete analyses of Intuit Inc. and Snowflake Inc. to enhance your investment decisions: