Intuit Inc. and PTC Inc. stand out as influential players in the software application industry, each driving innovation in distinct but overlapping markets. Intuit focuses on financial management solutions for individuals and businesses, while PTC excels in product lifecycle and industrial software with advanced AR capabilities. Comparing these companies offers insights into their growth potential and innovation strategies. Let’s explore which presents the most compelling investment opportunity.
Table of contents
Companies Overview
I will begin the comparison between Intuit and PTC by providing an overview of these two companies and their main differences.
Intuit Overview
Intuit Inc. specializes in financial management and compliance software for consumers, small businesses, and accounting professionals across the US, Canada, and internationally. Its product suite includes QuickBooks for accounting, TurboTax for tax preparation, Credit Karma for personal finance, and ProConnect for professional tax solutions. Headquartered in Mountain View, California, Intuit operates with a market cap of $151.6B and employs approximately 18,800 people.
PTC Overview
PTC Inc. is a software and services provider headquartered in Boston, Massachusetts, focusing on digital transformation solutions globally. It offers platforms like ThingWorx for IoT, Vuforia for augmented reality, and several product lifecycle management tools such as Onshape, Arena, Creo, and Windchill. PTC’s market cap stands at $20B with a workforce of about 7,500 employees, serving customers primarily in the Americas, Europe, and Asia Pacific.
Key similarities and differences
Both Intuit and PTC operate in the software application industry and serve global markets, though their focuses diverge significantly. Intuit concentrates on financial software and services for individual and business consumers, while PTC targets enterprise digital transformation and product lifecycle management. Intuit has a larger market cap and workforce, reflecting its broad consumer base, whereas PTC is more specialized in industrial and design software solutions.
Income Statement Comparison
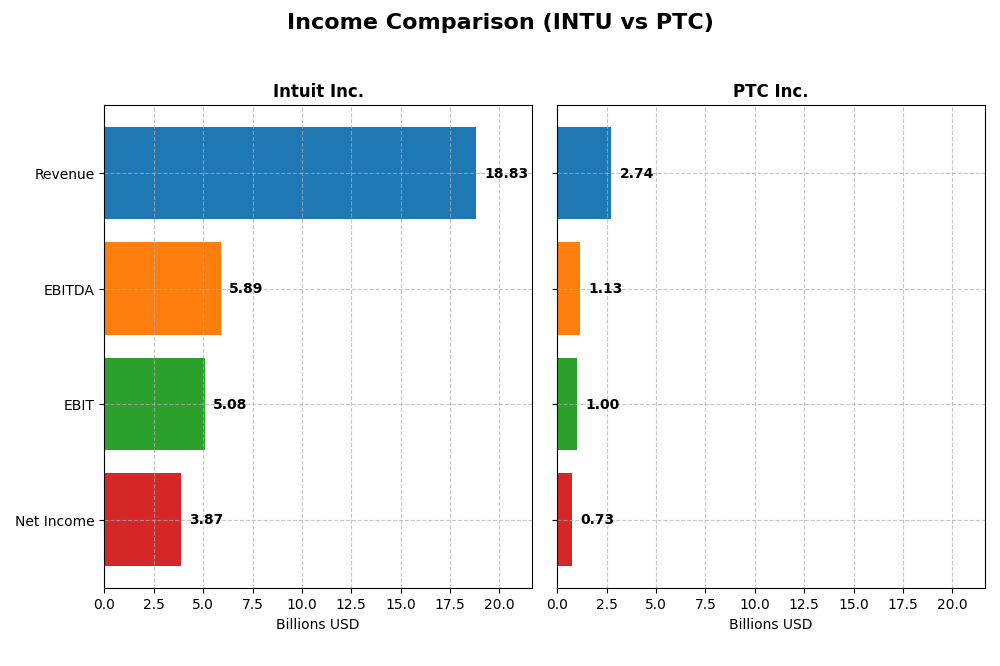
This table compares key income statement metrics for Intuit Inc. and PTC Inc. based on their most recent fiscal year data.
| Metric | Intuit Inc. (INTU) | PTC Inc. (PTC) |
|---|---|---|
| Market Cap | 152B | 20B |
| Revenue | 18.8B | 2.7B |
| EBITDA | 5.9B | 1.1B |
| EBIT | 5.1B | 997M |
| Net Income | 3.9B | 734M |
| EPS | 13.82 | 6.18 |
| Fiscal Year | 2025 | 2025 |
Income Statement Interpretations
Intuit Inc.
Intuit’s revenue nearly doubled from 2021 to 2025, reaching $18.8B, with net income growing 88% to $3.87B. Gross and EBIT margins remain favorable at 80.8% and 27.0%, respectively, though net margin declined slightly over the period. The latest year saw strong 15.6% revenue growth and a 33.9% surge in EBIT, signaling robust operational performance.
PTC Inc.
PTC’s revenue increased steadily by 51.6% from 2021 to 2025, hitting $2.74B, with net income rising 54% to $734M. Margins are solid, notably EBIT margin at 36.4% and net margin at 26.8%. The most recent fiscal year showed impressive momentum with 19.2% revenue growth and a 69.4% jump in EBIT, alongside a 63.7% net margin improvement.
Which one has the stronger fundamentals?
Both companies display favorable income statement trends with strong revenue and net income growth. Intuit boasts higher absolute figures and a longer growth runway, while PTC shows greater margin expansion and more pronounced recent profitability gains. Intuit’s net margin dip contrasts with PTC’s stable to improving margins, highlighting different operational dynamics between the two.
Financial Ratios Comparison
The table below presents the most recent key financial ratios for Intuit Inc. and PTC Inc., aiding in a side-by-side evaluation of their financial health and performance for fiscal year 2025.
| Ratios | Intuit Inc. (INTU) | PTC Inc. (PTC) |
|---|---|---|
| ROE | 19.6% | 19.2% |
| ROIC | 14.8% | 14.4% |
| P/E | 56.8 | 33.2 |
| P/B | 11.2 | 6.37 |
| Current Ratio | 1.36 | 1.12 |
| Quick Ratio | 1.36 | 1.12 |
| D/E (Debt to Equity) | 0.34 | 0.36 |
| Debt-to-Assets | 18.0% | 20.7% |
| Interest Coverage | 19.9 | 12.8 |
| Asset Turnover | 0.51 | 0.41 |
| Fixed Asset Turnover | 12.5 | 15.6 |
| Payout ratio | 30.7% | 0% |
| Dividend yield | 0.54% | 0% |
Interpretation of the Ratios
Intuit Inc.
Intuit’s 2025 ratios show strong profitability with a net margin of 20.55% and ROE near 19.63%, indicating efficient capital use. Its leverage and interest coverage ratios are favorable, supporting financial stability. However, high valuation multiples like a PE of 56.82 and a low dividend yield of 0.54% are less attractive. Intuit pays dividends with a modest yield, reflecting cautious distribution relative to free cash flow.
PTC Inc.
PTC displays a robust net margin of 26.8% and a solid ROE at 19.18%, evidencing good operational efficiency. The company maintains favorable debt ratios and interest coverage, though asset turnover is weaker. PTC does not pay dividends, likely prioritizing reinvestment and growth. Its valuation multiples are lower than Intuit’s but still unfavorable, signaling some market premium despite no shareholder payouts.
Which one has the best ratios?
Both companies have a favorable overall ratio profile, with 57.14% of ratios rated positively. Intuit shows slightly better leverage and interest coverage, while PTC outperforms in net margin but has weaker asset turnover. Valuation multiples are unfavorable for both, but Intuit’s dividend presence contrasts with PTC’s reinvestment strategy. The choice depends on individual investor priorities.
Strategic Positioning
This section compares the strategic positioning of Intuit Inc. and PTC Inc., including market position, key segments, and exposure to technological disruption:
Intuit Inc.
- Market leader in financial management software with strong competitive pressure in software.
- Diverse segments: Small Business & Self-Employed, Consumer, Credit Karma, and Professional Tax.
- Moderate exposure through cloud-based financial and payroll solutions in evolving fintech.
PTC Inc.
- Mid-sized software company facing moderate competitive pressures in product lifecycle management.
- Focused on software products and professional services, including CAD, PLM, AR, and SaaS platforms.
- High exposure with innovative AR, SaaS, and product lifecycle management digital transformation.
Intuit Inc. vs PTC Inc. Positioning
Intuit pursues a diversified strategy across multiple financial software segments, enhancing revenue stability but facing broader competition. PTC concentrates on industrial digital transformation tools, offering focused innovation yet with narrower market scope.
Which has the best competitive advantage?
PTC holds a very favorable moat with growing ROIC and increasing profitability, indicating a durable competitive advantage. Intuit also creates value but shows declining ROIC, suggesting a slightly favorable moat with less momentum.
Stock Comparison
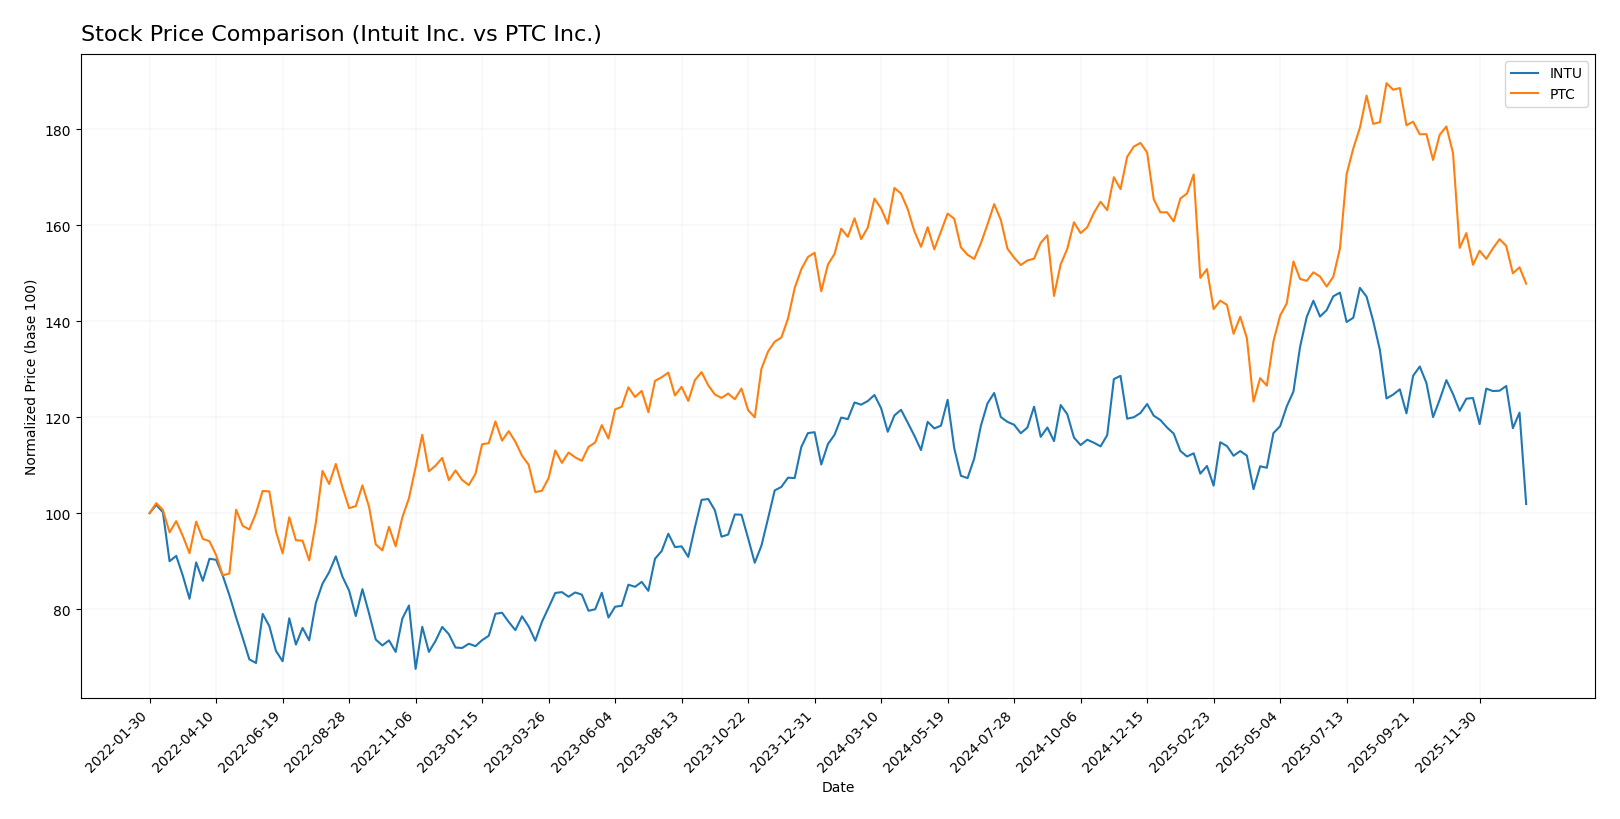
The stock price movements of Intuit Inc. and PTC Inc. over the past year reveal clear bearish trends, with significant declines and notable volatility shaping their trading dynamics.
Trend Analysis
Intuit Inc. experienced a bearish trend with a -17.41% price change over the past year, showing deceleration and a high volatility level with a standard deviation of 51.51. Its highest and lowest prices were 785.95 and 544.93 respectively.
PTC Inc. also showed a bearish trend with a -7.34% price change over the same period, featuring deceleration and lower volatility at a 15.46 standard deviation. The stock ranged between 215.05 and 139.77 in price.
Comparing both stocks, Intuit Inc. faced a larger decline, while PTC Inc. delivered relatively better performance despite both trends being bearish over the past year.
Target Prices
The current analyst consensus shows promising upside potential for both Intuit Inc. and PTC Inc.
| Company | Target High | Target Low | Consensus |
|---|---|---|---|
| Intuit Inc. | 880 | 700 | 798.4 |
| PTC Inc. | 255 | 120 | 213.25 |
Analysts expect Intuit’s price to rise significantly above its current 544.59 USD, reflecting strong growth prospects. PTC’s consensus target of 213.25 USD also indicates notable upside from its current 167.71 USD.
Analyst Opinions Comparison
This section compares analysts’ ratings and grades for Intuit Inc. and PTC Inc.:
Rating Comparison
Intuit Inc. Rating
- Rating: B, indicating a very favorable overall evaluation.
- Discounted Cash Flow Score: 4, showing favorable valuation.
- ROE Score: 4, reflecting efficient profit generation.
- ROA Score: 5, signifying very favorable asset utilization.
- Debt To Equity Score: 2, suggesting moderate financial risk.
- Overall Score: 3, representing a moderate overall rating.
PTC Inc. Rating
- Rating: B+, also reflecting a very favorable overall rating.
- Discounted Cash Flow Score: 4, indicating favorable valuation.
- ROE Score: 4, also reflecting efficient profit generation.
- ROA Score: 5, similarly showing very favorable asset use.
- Debt To Equity Score: 2, indicating moderate financial risk.
- Overall Score: 3, also representing a moderate overall rating.
Which one is the best rated?
Both Intuit and PTC share very similar ratings and scores across all financial metrics. PTC holds a slightly higher rating (B+) compared to Intuit’s B, but their overall and individual scores are identical, making their analyst evaluations effectively equal.
Scores Comparison
Here is a comparison of the Altman Z-Score and Piotroski Score for Intuit Inc. and PTC Inc.:
Intuit Inc. Scores
- Altman Z-Score: 9.35, indicating a safe zone with low bankruptcy risk.
- Piotroski Score: 9, classified as very strong financial health.
PTC Inc. Scores
- Altman Z-Score: 5.67, indicating a safe zone with low bankruptcy risk.
- Piotroski Score: 8, classified as very strong financial health.
Which company has the best scores?
Intuit Inc. has higher Altman Z-Score and Piotroski Score values compared to PTC Inc. Both companies are in the safe zone with very strong Piotroski scores, but Intuit’s scores are slightly superior based on the data provided.
Grades Comparison
Here is a detailed comparison of the latest grades assigned to Intuit Inc. and PTC Inc.:
Intuit Inc. Grades
The table below summarizes recent grades and actions from reputable grading companies for Intuit Inc.:
| Grading Company | Action | New Grade | Date |
|---|---|---|---|
| Wells Fargo | downgrade | Equal Weight | 2026-01-08 |
| Wells Fargo | maintain | Overweight | 2025-11-21 |
| RBC Capital | maintain | Outperform | 2025-11-21 |
| BMO Capital | maintain | Outperform | 2025-11-21 |
| Evercore ISI Group | maintain | Outperform | 2025-11-18 |
| RBC Capital | maintain | Outperform | 2025-09-02 |
| RBC Capital | maintain | Outperform | 2025-08-22 |
| UBS | maintain | Neutral | 2025-08-22 |
| Morgan Stanley | maintain | Overweight | 2025-08-22 |
| Barclays | maintain | Overweight | 2025-08-22 |
Intuit’s grades mostly indicate strong confidence with predominantly “Outperform” and “Overweight” ratings, though a recent downgrade to “Equal Weight” by Wells Fargo suggests some caution.
PTC Inc. Grades
The table below presents recent grades and actions from recognized grading companies for PTC Inc.:
| Grading Company | Action | New Grade | Date |
|---|---|---|---|
| Piper Sandler | maintain | Neutral | 2025-11-07 |
| Rosenblatt | maintain | Buy | 2025-11-06 |
| Rosenblatt | maintain | Buy | 2025-10-30 |
| Oppenheimer | maintain | Outperform | 2025-07-31 |
| Rosenblatt | maintain | Buy | 2025-07-31 |
| Barclays | maintain | Overweight | 2025-07-31 |
| Stifel | maintain | Buy | 2025-07-31 |
| Keybanc | maintain | Overweight | 2025-07-31 |
| RBC Capital | maintain | Outperform | 2025-07-31 |
| Piper Sandler | maintain | Neutral | 2025-07-31 |
PTC’s ratings consistently show positive sentiment, with multiple “Buy,” “Outperform,” and “Overweight” grades, complemented by a few “Neutral” evaluations maintaining a balanced outlook.
Which company has the best grades?
Both Intuit Inc. and PTC Inc. receive predominantly positive grades, but Intuit shows a stronger concentration of “Outperform” ratings. PTC has more “Buy” and “Overweight” grades but also several “Neutral” opinions. Investors may interpret Intuit’s grades as more consistently bullish, while PTC’s ratings suggest moderate optimism with some caution.
Strengths and Weaknesses
Below is a comparison of key strengths and weaknesses for Intuit Inc. and PTC Inc. based on the latest financial and operational data.
| Criterion | Intuit Inc. (INTU) | PTC Inc. (PTC) |
|---|---|---|
| Diversification | Highly diversified with strong segments: Consumer ($4.87B), Global Business Solutions ($11.08B), Credit Karma ($2.26B), Professional Tax ($621M) | Focused on software with three main segments: Support & Cloud Services ($1.47B), License ($1.16B), Technology Service ($107M) |
| Profitability | Net margin 20.55%, ROIC 14.78%, ROE 19.63%, slightly declining ROIC trend | Net margin 26.8%, ROIC 14.43%, ROE 19.18%, growing ROIC trend |
| Innovation | Consistent investments in financial and tax technology; moderate innovation pace | Strong innovation with emphasis on cloud and technology services, visible in growing profitability |
| Global presence | Significant presence in consumer and business financial software markets globally | Strong global footprint in industrial software with cloud-based solutions growing rapidly |
| Market Share | Leading player in tax and small business accounting software | Niche leader in product lifecycle management and IoT software |
Key takeaways: Intuit offers strong diversification and solid profitability but faces a declining ROIC trend, suggesting caution on growth sustainability. PTC demonstrates a very favorable moat with growing profitability and innovation, making it attractive for investors seeking durable competitive advantages in industrial software.
Risk Analysis
Below is a comparative table outlining key risk factors for Intuit Inc. and PTC Inc. as of fiscal year 2025.
| Metric | Intuit Inc. (INTU) | PTC Inc. (PTC) |
|---|---|---|
| Market Risk | Beta 1.25 – moderate volatility | Beta 1.01 – near market volatility |
| Debt level | Debt/Equity 0.34 – low financial leverage | Debt/Equity 0.36 – low financial leverage |
| Regulatory Risk | Moderate – financial software compliance | Moderate – diverse global software regulations |
| Operational Risk | Moderate – reliance on cloud solutions | Moderate – reliance on product innovation and SaaS |
| Environmental Risk | Low – primarily software business | Low – primarily software business |
| Geopolitical Risk | Moderate – exposure to US, Canada, global markets | Moderate – global operations including APAC |
Intuit’s key risks relate to high valuation multiples and sensitivity to regulatory changes in financial sectors. PTC faces operational risks from fast-evolving technology demands and geopolitical exposure. Both companies maintain low debt, reducing financial distress risk, supported by strong Altman Z-Scores in the safe zone. Market risk is moderate, with Intuit slightly more volatile. Investors should monitor regulatory developments and market valuation levels closely.
Which Stock to Choose?
Intuit Inc. (INTU) shows a strong income evolution with 15.63% revenue growth in 2025 and favorable profitability metrics, including a 20.55% net margin and 19.63% ROE. It maintains low debt levels with a net debt to EBITDA of 0.64 and a very favorable B rating, though valuation multiples like P/E and P/B are less attractive.
PTC Inc. (PTC) demonstrates robust income growth with 19.18% revenue increase in 2025, superior profitability including a 26.8% net margin and 19.18% ROE. Its debt is slightly higher (net debt to EBITDA of 1.05) but still manageable, supported by a very favorable B+ rating and more moderate valuation multiples compared to INTU.
Considering ratings and overall financials, INTU’s stable and slightly declining ROIC contrasts with PTC’s very favorable rating supported by growing ROIC and profitability. Investors focused on durable growth and improving returns might find PTC appealing, while those valuing established profitability with moderate risk could see INTU as a viable option.
Disclaimer: Investment carries a risk of loss of initial capital. The past performance is not a reliable indicator of future results. Be sure to understand risks before making an investment decision.
Go Further
I encourage you to read the complete analyses of Intuit Inc. and PTC Inc. to enhance your investment decisions: