In the rapidly evolving software industry, Intuit Inc. and Perfect Corp. stand out as innovators with distinct yet overlapping market ambitions. Intuit, a giant in financial management solutions, competes alongside Perfect Corp., a rising star specializing in AI-driven beauty and fashion tech. Both leverage cutting-edge technology to disrupt traditional sectors. This article will analyze their strengths and risks to help you decide which company offers the most compelling investment opportunity in 2026.
Table of contents
Companies Overview
I will begin the comparison between Intuit Inc. and Perfect Corp. by providing an overview of these two companies and their main differences.
Intuit Inc. Overview
Intuit Inc. is a leading provider of financial management and compliance software for consumers, small businesses, self-employed individuals, and accounting professionals. Founded in 1983 and headquartered in Mountain View, California, Intuit operates globally with products like QuickBooks, TurboTax, and Credit Karma. Its diverse offerings span cloud-based accounting, tax preparation, payroll, and payment solutions, positioning it strongly in the financial software market with a market cap of 151.7B USD.
Perfect Corp. Overview
Perfect Corp., established in 2015 and based in New Taipei City, Taiwan, specializes in SaaS AI and augmented reality solutions for the beauty and fashion industries. The company offers a broad range of virtual try-on and AI-powered personalization tools, including makeup, hair, and accessories simulation apps. With a market cap of 178M USD and 342 employees, Perfect Corp. focuses on enhancing customer engagement through innovative AR and AI technologies in lifestyle sectors.
Key similarities and differences
Both Intuit and Perfect Corp. operate in the software application industry with technology-driven solutions, but their markets differ significantly. Intuit targets financial services with a broad global footprint and a diverse product suite focused on business and consumer finance. In contrast, Perfect Corp. serves niche beauty and fashion markets using AI and AR for virtual experiences. Intuit’s scale and product diversity contrast with Perfect Corp.’s specialized innovation and smaller market capitalization.
Income Statement Comparison
The table below compares the key income statement metrics for Intuit Inc. and Perfect Corp. for their most recent fiscal years, providing a snapshot of their financial performance.
| Metric | Intuit Inc. (INTU) | Perfect Corp. (PERF) |
|---|---|---|
| Market Cap | 151.7B | 178M |
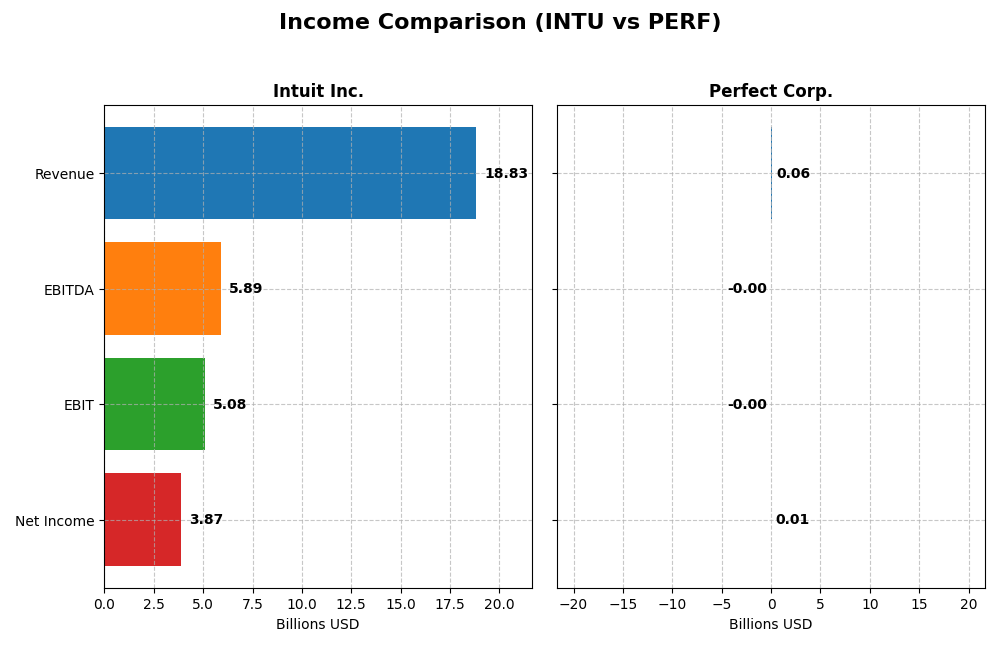
| Revenue | 18.83B | 60.2M |
| EBITDA | 5.89B | -2.05M |
| EBIT | 5.08B | -2.84M |
| Net Income | 3.87B | 5.02M |
| EPS | 13.82 | 0.05 |
| Fiscal Year | 2025 | 2024 |
Income Statement Interpretations
Intuit Inc.
Intuit’s revenue and net income showed consistent growth from 2021 to 2025, with revenue nearly doubling from $9.63B to $18.83B and net income increasing from $2.06B to $3.87B. Margins remained robust, with a slight dip in net margin over the period. In 2025, Intuit posted a strong 15.6% revenue growth and a 12.9% net margin improvement, reflecting healthy operational efficiency.
Perfect Corp.
Perfect Corp. experienced rapid revenue growth, more than doubling from $29.87M in 2020 to $60.2M in 2024, alongside a dramatic net income turnaround to $5.02M from losses. Margins improved notably, though EBIT margin stayed negative in 2024 at -4.7%. The latest year saw 12.5% revenue growth, but EBIT declined sharply, indicating ongoing challenges in profitability despite net income gains.
Which one has the stronger fundamentals?
Intuit demonstrates stronger fundamentals with high and stable margins, consistent profitability, and favorable growth across most income metrics, including a 33.99% EBIT growth in the latest year. Perfect Corp. shows impressive top-line growth and net income recovery, but negative EBIT margin and unfavorable EBIT growth highlight profitability risks. Overall, Intuit’s income statement is more balanced and resilient.
Financial Ratios Comparison
The table below presents a side-by-side comparison of key financial ratios for Intuit Inc. and Perfect Corp. based on their most recent fiscal year data.
| Ratios | Intuit Inc. (2025) | Perfect Corp. (2024) |
|---|---|---|
| ROE | 19.6% | 3.4% |
| ROIC | 14.8% | -2.1% |
| P/E | 56.8 | 56.6 |
| P/B | 11.2 | 1.93 |
| Current Ratio | 1.36 | 5.52 |
| Quick Ratio | 1.36 | 5.52 |
| D/E | 0.34 | 0.0035 |
| Debt-to-Assets | 18.0% | 0.28% |
| Interest Coverage | 19.9 | -449 |
| Asset Turnover | 0.51 | 0.33 |
| Fixed Asset Turnover | 12.5 | 57.9 |
| Payout ratio | 30.7% | 0% |
| Dividend yield | 0.54% | 0% |
Interpretation of the Ratios
Intuit Inc.
Intuit displays mostly strong financial ratios with favorable returns on equity (19.63%) and invested capital (14.78%), supported by a solid debt-to-equity ratio of 0.34 and interest coverage above 20. However, its price-to-earnings (PE) and price-to-book (PB) ratios are notably high, indicating potential overvaluation risks. The company pays dividends with a modest yield of 0.54%, reflecting a cautious payout policy aligned with stable shareholder returns.
Perfect Corp.
Perfect Corp. shows mixed ratio strength with a neutral net margin of 8.34% but unfavorable returns on equity (3.42%) and invested capital (-2.1%), suggesting operational challenges. Its zero dividend yield aligns with reinvestment in growth and R&D, common for a younger tech firm. The debt level is minimal, but weak interest coverage and asset turnover ratios highlight risks in profitability and asset efficiency.
Which one has the best ratios?
Intuit’s ratios are globally favorable, reflecting strong profitability, sound leverage, and stable cash flow metrics, despite high valuation multiples. Perfect Corp. faces significant weaknesses in profitability and coverage ratios, with a slightly unfavorable overall evaluation. Based on these metrics, Intuit demonstrates a more robust financial profile relative to Perfect Corp.
Strategic Positioning
This section compares the strategic positioning of Intuit Inc. and Perfect Corp., including their market position, key segments, and exposure to technological disruption:
Intuit Inc.
- Leading financial software provider with strong market cap of 152B and competitive pressure from tech sector peers.
- Diverse segments: Small Business & Self-Employed, Consumer, Credit Karma, and ProConnect driving revenue growth.
- Operates in established software application industry with moderate risk of disruption through cloud and AI innovations.
Perfect Corp.
- Smaller market cap of 178M, focused on niche SaaS AI and AR beauty tech, facing specialized competition.
- Concentrated in AI and AR solutions for beauty and fashion tech, offering virtual try-on and analysis services.
- High exposure to technological disruption due to reliance on cutting-edge AI and AR technologies in evolving markets.
Intuit Inc. vs Perfect Corp. Positioning
Intuit adopts a diversified business model with multiple financial software segments, supporting stable revenue streams. Perfect Corp. focuses on a concentrated AI and AR niche in beauty tech, which may offer growth but entails higher volatility and risk.
Which has the best competitive advantage?
Intuit shows a slightly favorable moat with value creation despite declining profitability, while Perfect Corp. has a slightly unfavorable moat, currently destroying value though improving profitability. Intuit holds a more stable competitive advantage based on this evaluation.
Stock Comparison
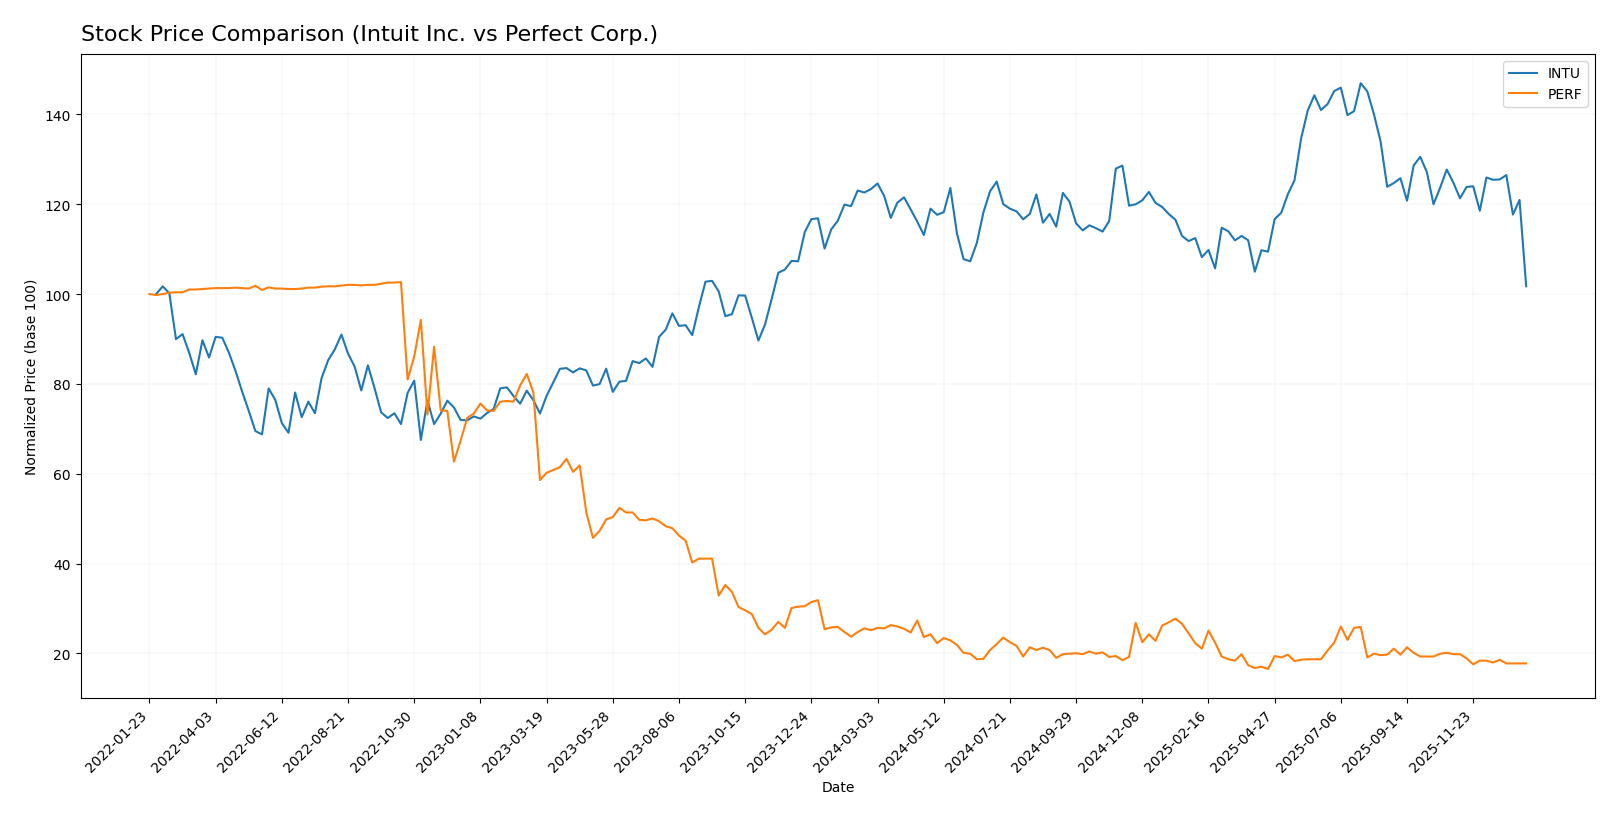
The past year has seen both Intuit Inc. (INTU) and Perfect Corp. (PERF) experience notable declines with bearish trends, reflecting weakening prices and decelerating momentum across their trading periods.
Trend Analysis
Intuit Inc. shows a bearish trend with a -17.52% price change over the past 12 months. The trend is decelerating, with high volatility marked by a standard deviation of 51.53. The stock peaked at 785.95 and fell to a low of 544.22.
Perfect Corp. also exhibits a bearish trend, declining by -29.39% over the same 12-month span. Volatility is minimal with a standard deviation of 0.27, and the trend is decelerating. The highest price reached 2.7, dropping to a low of 1.61.
Comparing both stocks, Intuit Inc. delivered a smaller loss than Perfect Corp., indicating a relatively stronger market performance in the past year despite both experiencing bearish trends.
Target Prices
Analysts present a clear target consensus for Intuit Inc. and Perfect Corp., offering useful guidance for potential investors.
| Company | Target High | Target Low | Consensus |
|---|---|---|---|
| Intuit Inc. | 880 | 700 | 798.4 |
| Perfect Corp. | 7 | 7 | 7 |
The consensus target for Intuit Inc. is significantly above its current price of 544.9 USD, suggesting strong upside potential. Perfect Corp.’s target price at 7 USD also indicates a potential for substantial growth compared to its current price of 1.735 USD.
Analyst Opinions Comparison
This section compares analysts’ ratings and financial scores for Intuit Inc. and Perfect Corp.:
Rating Comparison
INTU Rating
- Rating: B, classified as Very Favorable.
- Discounted Cash Flow Score: 4, Favorable rating.
- ROE Score: 4, Favorable rating.
- ROA Score: 5, Very Favorable rating.
- Debt To Equity Score: 2, Moderate rating.
- Overall Score: 3, Moderate rating.
PERF Rating
- Rating: A-, classified as Very Favorable.
- Discounted Cash Flow Score: 5, Very Favorable.
- ROE Score: 2, Moderate rating.
- ROA Score: 3, Moderate rating.
- Debt To Equity Score: 4, Favorable rating.
- Overall Score: 4, Favorable rating.
Which one is the best rated?
Based strictly on the provided data, Perfect Corp. holds a higher overall score (4 vs. 3) and a superior discounted cash flow score, while Intuit Inc. scores better on ROE and ROA. Perfect Corp. is better rated overall.
Scores Comparison
The scores comparison between Intuit Inc. and Perfect Corp. highlights their financial health and bankruptcy risk:
Intuit Inc. Scores
- Altman Z-Score: 9.35, indicating a safe zone and low bankruptcy risk.
- Piotroski Score: 9, classified as very strong financial health.
Perfect Corp. Scores
- Altman Z-Score: 1.31, indicating distress zone with high bankruptcy risk.
- Piotroski Score: 6, classified as average financial strength.
Which company has the best scores?
Intuit Inc. clearly has the best scores, with a safe zone Altman Z-Score and a very strong Piotroski Score, compared to Perfect Corp.’s distress zone and average scores. This suggests stronger financial stability for Intuit.
Grades Comparison
The following presents the latest reliable grades for Intuit Inc. and Perfect Corp.:
Intuit Inc. Grades
This table summarizes recent grades from recognized grading firms for Intuit Inc.
| Grading Company | Action | New Grade | Date |
|---|---|---|---|
| Wells Fargo | Downgrade | Equal Weight | 2026-01-08 |
| Wells Fargo | Maintain | Overweight | 2025-11-21 |
| RBC Capital | Maintain | Outperform | 2025-11-21 |
| BMO Capital | Maintain | Outperform | 2025-11-21 |
| Evercore ISI Group | Maintain | Outperform | 2025-11-18 |
| RBC Capital | Maintain | Outperform | 2025-09-02 |
| RBC Capital | Maintain | Outperform | 2025-08-22 |
| UBS | Maintain | Neutral | 2025-08-22 |
| Morgan Stanley | Maintain | Overweight | 2025-08-22 |
| Barclays | Maintain | Overweight | 2025-08-22 |
Intuit has predominantly maintained strong positive grades such as Outperform and Overweight, with a recent slight downgrade to Equal Weight by Wells Fargo.
Perfect Corp. Grades
This table summarizes recent grades from recognized grading firms for Perfect Corp.
| Grading Company | Action | New Grade | Date |
|---|---|---|---|
| Piper Sandler | Maintain | Neutral | 2024-02-29 |
| Goldman Sachs | Maintain | Neutral | 2023-10-26 |
| Piper Sandler | Maintain | Neutral | 2023-10-25 |
| Piper Sandler | Maintain | Neutral | 2023-07-26 |
| Piper Sandler | Maintain | Neutral | 2023-07-25 |
| Piper Sandler | Maintain | Neutral | 2023-04-27 |
| Oppenheimer | Downgrade | Perform | 2023-04-20 |
| Oppenheimer | Downgrade | Perform | 2023-04-19 |
| Oppenheimer | Downgrade | Perform | 2023-04-18 |
| Piper Sandler | Maintain | Neutral | 2023-03-08 |
Perfect Corp.’s grades have mostly remained Neutral, with a downgrade from Outperform to Perform by Oppenheimer in early 2023.
Which company has the best grades?
Intuit Inc. consistently receives stronger grades, including several Outperform and Overweight ratings, compared to Perfect Corp.’s mostly Neutral ratings. This suggests Intuit is viewed more favorably by analysts, possibly reflecting higher confidence in its growth prospects and stability, which may influence investor sentiment.
Strengths and Weaknesses
Below is a comparison of key strengths and weaknesses of Intuit Inc. (INTU) and Perfect Corp. (PERF) based on their latest financial and strategic data.
| Criterion | Intuit Inc. (INTU) | Perfect Corp. (PERF) |
|---|---|---|
| Diversification | Highly diversified revenue streams across consumer, small business, and professional segments with strong growth in Global Business Solutions | Limited diversification; primarily focused on niche tech solutions, lacking broad segment revenue |
| Profitability | Strong profitability with 20.55% net margin, 19.63% ROE, and 14.78% ROIC; slightly declining ROIC trend | Lower profitability with 8.34% net margin, 3.42% ROE, and negative ROIC; however, ROIC is growing |
| Innovation | Consistent investment in financial tech innovations and expanding credit services | Rapid innovation with growing ROIC, but currently value-destroying due to negative returns on capital |
| Global presence | Extensive global footprint, especially in small business and consumer financial solutions | Smaller global footprint; growth potential but limited scale currently |
| Market Share | Leading market share in tax preparation and financial management software | Emerging player with limited market share in beauty tech and AI-driven applications |
Intuit excels with diversified revenue and strong profitability despite a slight decline in capital efficiency. Perfect Corp. shows promising innovation and growth potential but currently faces profitability and value-creation challenges. Investors should weigh Intuit’s stability against Perfect’s growth risk.
Risk Analysis
Below is a comparative risk table for Intuit Inc. and Perfect Corp. based on the most recent data available in 2026.
| Metric | Intuit Inc. (INTU) | Perfect Corp. (PERF) |
|---|---|---|
| Market Risk | Beta 1.25, moderate volatility | Beta 0.45, low volatility |
| Debt level | Debt/Equity 0.34, low risk | Debt/Equity 0.0, negligible |
| Regulatory Risk | Moderate, US and global compliance | Moderate, Taiwan and global compliance |
| Operational Risk | Low, established processes | Moderate, smaller size and scale |
| Environmental Risk | Low, software industry | Low, software industry |
| Geopolitical Risk | Moderate, US-based with global exposure | Higher, Taiwan-based with regional tensions |
Intuit faces moderate market and geopolitical risks due to its US base and global operations but maintains a strong financial position with low debt and favorable operational efficiency. Perfect Corp. enjoys low debt and market volatility but is more exposed to geopolitical tensions in Asia and shows some financial distress signs, including a low Altman Z-score indicating higher bankruptcy risk. Investors should weigh Intuit’s stable fundamentals against Perfect’s growth potential and regional risks.
Which Stock to Choose?
Intuit Inc. (INTU) shows strong income growth with a 15.63% revenue increase in 2025 and favorable profitability metrics, including a 20.55% net margin and 19.63% ROE. Its debt levels are moderate with a net debt to EBITDA of 0.64, and its overall rating is very favorable (B) supported by strong financial ratios and excellent cash flow scores.
Perfect Corp. (PERF) reports solid revenue growth at 12.52% in 2024 but faces challenges with an unfavorable ROIC of -2.1% and a negative interest coverage ratio. Profitability is modest with an 8.34% net margin, and debt is minimal. Its overall rating is very favorable (A-), though financial ratios are slightly unfavorable, reflecting mixed operational efficiency.
Investors prioritizing financial stability and consistent value creation might find Intuit’s strong profitability and favorable ratios more aligned with a quality investing approach, whereas those focused on growth potential despite current profitability challenges might see Perfect’s improving income and rating as indicative of a risk-tolerant, growth investment profile.
Disclaimer: Investment carries a risk of loss of initial capital. The past performance is not a reliable indicator of future results. Be sure to understand risks before making an investment decision.
Go Further
I encourage you to read the complete analyses of Intuit Inc. and Perfect Corp. to enhance your investment decisions: