In the dynamic world of software applications, Intuit Inc. and Paycom Software, Inc. stand out as influential players shaping financial and human capital management solutions. Intuit excels in comprehensive financial tools for businesses and consumers, while Paycom specializes in cloud-based human capital management for small to mid-sized firms. This article will explore their market positions, innovation strategies, and growth potential to help you decide which company deserves a place in your investment portfolio.
Table of contents
Companies Overview
I will begin the comparison between Intuit Inc. and Paycom Software, Inc. by providing an overview of these two companies and their main differences.
Intuit Inc. Overview
Intuit Inc. is a leading provider of financial management and compliance products for consumers, small businesses, self-employed individuals, and accounting professionals across the US, Canada, and internationally. The company operates through four segments, including QuickBooks and TurboTax, delivering cloud-based and desktop software solutions alongside payment-processing services. Founded in 1983, Intuit is headquartered in Mountain View, California, with a market cap of $151.5B.
Paycom Software, Inc. Overview
Paycom Software, Inc. offers cloud-based human capital management (HCM) solutions on a software-as-a-service basis targeting small to mid-sized US companies. Its suite includes talent acquisition, payroll, time and labor management, and compliance applications, designed to streamline the employment lifecycle. Founded in 1998 and headquartered in Oklahoma City, Oklahoma, Paycom has a market cap of $8.4B.
Key similarities and differences
Both Intuit and Paycom operate in the software application industry, providing cloud-based solutions to improve business processes. Intuit focuses on financial management, accounting, and tax compliance, while Paycom specializes in human capital management and payroll. Intuit serves a broader international market with diversified segments, whereas Paycom concentrates on the US mid-sized business sector with a specific HCM focus.
Income Statement Comparison
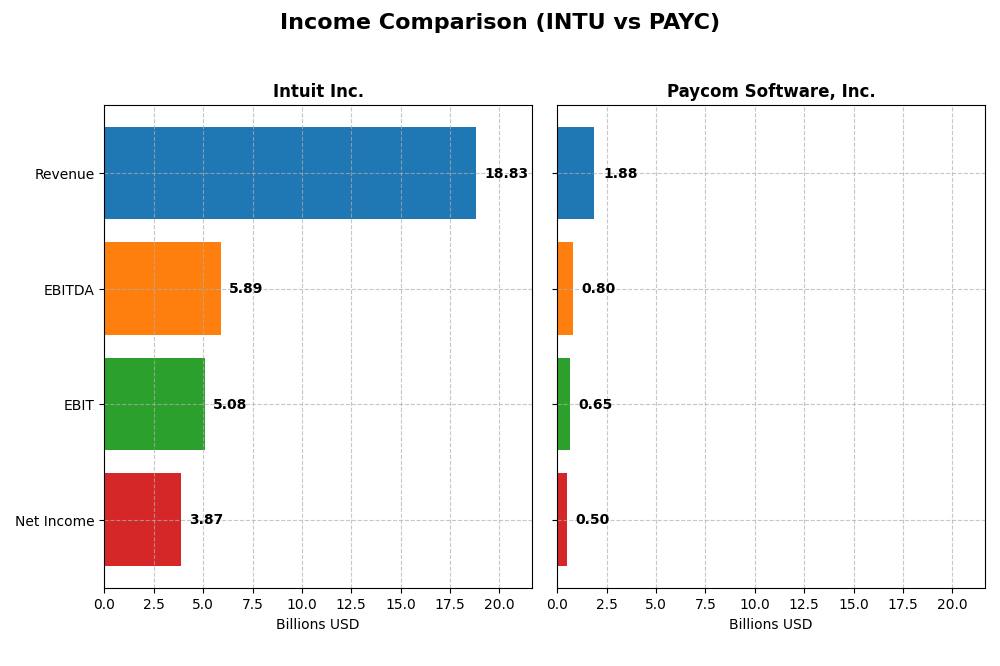
This table compares key income statement metrics for Intuit Inc. and Paycom Software, Inc. based on their most recent fiscal year results.
| Metric | Intuit Inc. (INTU) | Paycom Software, Inc. (PAYC) |
|---|---|---|
| Market Cap | 151.5B | 8.39B |
| Revenue | 18.83B | 1.88B |
| EBITDA | 5.89B | 798M |
| EBIT | 5.08B | 652M |
| Net Income | 3.87B | 502M |
| EPS | 13.82 | 8.93 |
| Fiscal Year | 2025 | 2024 |
Income Statement Interpretations
Intuit Inc.
Intuit Inc. showed strong revenue growth from 2021 to 2025, nearly doubling to $18.8B in 2025, with net income rising from $2.06B to $3.87B. Margins mostly remained stable, with a slight net margin dip overall but favorable gross and EBIT margins. The latest year saw robust revenue and profit growth, with net income up 30% and improved EBIT margin at 27%.
Paycom Software, Inc.
Paycom’s revenue more than doubled over 2020-2024, reaching $1.88B, while net income surged by roughly 250% to $502M. Margins improved markedly, with net margin growth of 56% overall and an EBIT margin above 34% in 2024. The most recent year maintained strong momentum, showing double-digit revenue growth and a net margin increase of 32%.
Which one has the stronger fundamentals?
Both companies demonstrate favorable income statement trends with solid revenue and net income growth. Paycom excels with higher margin improvements and exceptional net income growth, while Intuit benefits from larger scale and stable high margins. Each shows strong fundamentals, with Paycom’s rapid expansion contrasting Intuit’s robust profitability at scale.
Financial Ratios Comparison
The table below presents the most recent key financial ratios for Intuit Inc. and Paycom Software, Inc., facilitating a straightforward comparison of their financial performance and stability.
| Ratios | Intuit Inc. (2025) | Paycom Software, Inc. (2024) |
|---|---|---|
| ROE | 19.63% | 31.85% |
| ROIC | 14.78% | 24.86% |
| P/E | 56.82 | 22.95 |
| P/B | 11.15 | 7.31 |
| Current Ratio | 1.36 | 1.10 |
| Quick Ratio | 1.36 | 1.10 |
| D/E (Debt-to-Equity) | 0.34 | 0.05 |
| Debt-to-Assets | 17.96% | 1.42% |
| Interest Coverage | 19.93 | 186.56 |
| Asset Turnover | 0.51 | 0.32 |
| Fixed Asset Turnover | 12.54 | 2.93 |
| Payout ratio | 30.73% | 16.89% |
| Dividend yield | 0.54% | 0.74% |
Interpretation of the Ratios
Intuit Inc.
Intuit displays a generally favorable financial profile with strong net margin (20.55%), ROE (19.63%), and ROIC (14.78%). Its leverage ratios are solid, with debt-to-equity at 0.34 and interest coverage high at 20.57. However, valuation multiples like P/E at 56.82 and P/B at 11.15 are relatively high, posing potential concerns. The dividend yield is low at 0.54%, reflecting modest shareholder returns.
Paycom Software, Inc.
Paycom shows robust profitability ratios, including a net margin of 26.66%, ROE of 31.85%, and ROIC of 24.86%, supported by a favorable WACC of 7.61%. Its debt levels are minimal, with a debt-to-assets ratio of 1.42%. Despite a lower asset turnover (0.32), the overall financial health is positive. Dividend yield stands at 0.74%, indicating limited but consistent shareholder returns.
Which one has the best ratios?
Both Intuit and Paycom present a favorable overall ratio profile, each with 57.14% of ratios rated as favorable. Intuit’s strengths lie in leverage management and asset utilization, while Paycom excels in profitability and cost of capital. Paycom’s lower valuation multiples and higher dividend yield contrast with Intuit’s higher leverage and valuation concerns, making their profiles complementary rather than directly comparable.
Strategic Positioning
This section compares the strategic positioning of Intuit and Paycom, focusing on market position, key segments, and exposure to technological disruption:
Intuit Inc.
- Leading market cap at $151.5B with broad competitive pressure in software applications globally.
- Diverse segments including Small Business, Consumer, Credit Karma, and Professional Tax services.
- Exposure to disruption through evolving cloud and financial technology platforms across multiple sectors.
Paycom Software, Inc.
- Market cap of $8.4B with focused competition in U.S. cloud-based human capital management solutions.
- Concentrated on cloud-based HCM solutions with comprehensive payroll, talent, and compliance applications.
- Technological disruption managed via proprietary Bluetooth and advanced analytics in HCM software.
Intuit Inc. vs Paycom Software, Inc. Positioning
Intuit pursues a diversified strategy across multiple financial software and services segments, offering scale advantages but facing wide competition. Paycom concentrates on U.S. HCM SaaS, benefiting from specialization but with narrower market exposure.
Which has the best competitive advantage?
Paycom exhibits a very favorable moat with growing ROIC and durable profitability, indicating a strong competitive advantage. Intuit, while creating value, shows a slightly favorable moat with declining ROIC, suggesting less durable advantages.
Stock Comparison
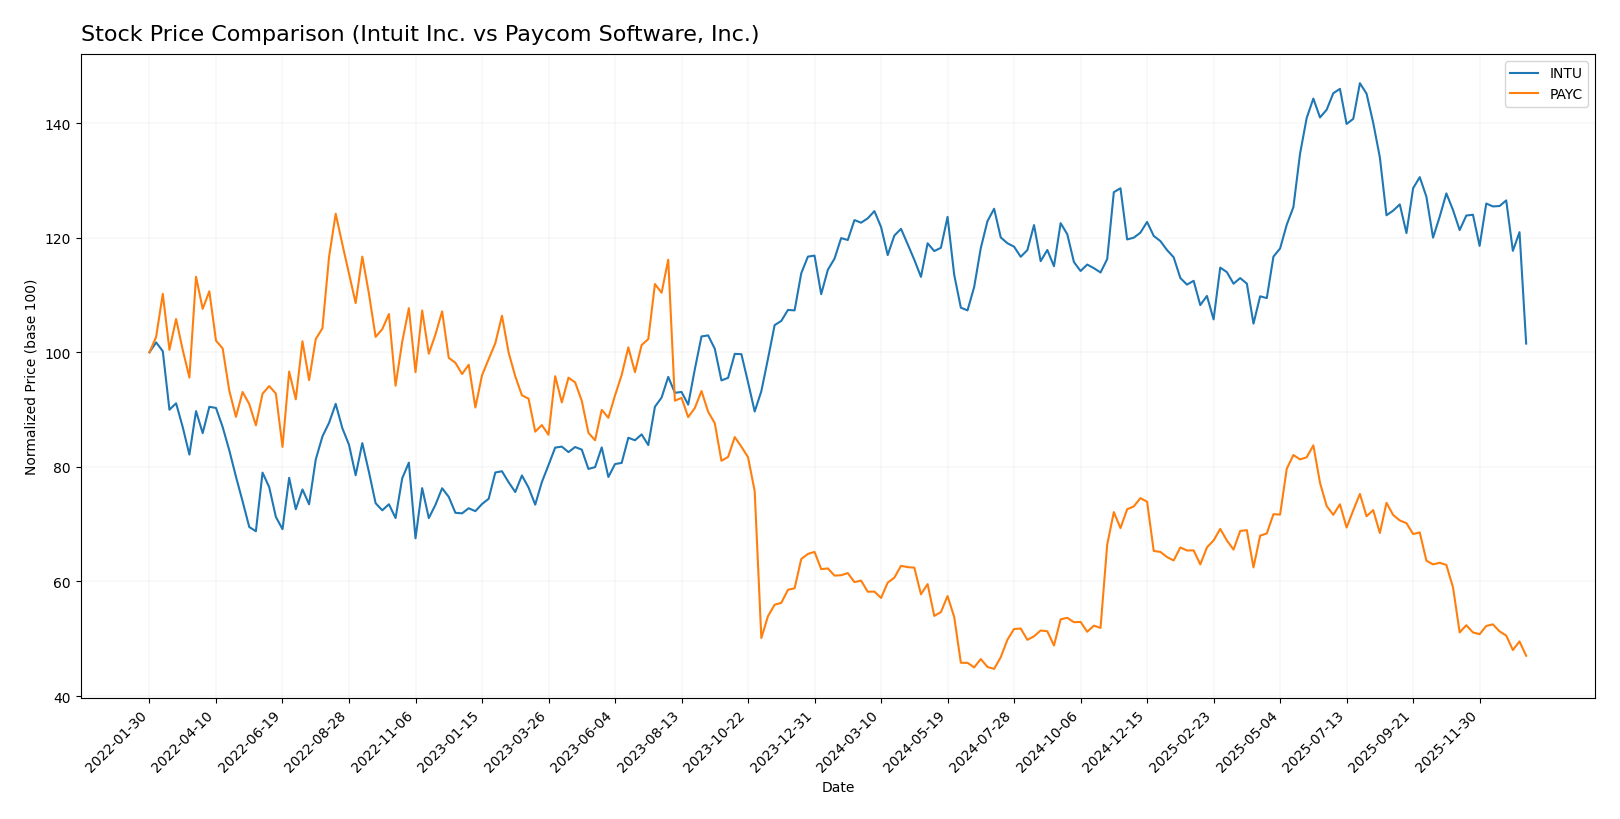
The stock price movements over the past year for Intuit Inc. and Paycom Software, Inc. reveal clear bearish trends with notable declines and decelerating momentum in both cases.
Trend Analysis
Intuit Inc. (INTU) experienced a bearish trend with a -17.71% price change over the past 12 months, showing deceleration and high volatility with prices ranging between 542.92 and 785.95.
Paycom Software, Inc. (PAYC) also followed a bearish trend, declining by -19.2% over the same period, with decelerating momentum and lower volatility, trading between 141.96 and 265.71.
Comparing both, Paycom’s stock delivered a slightly larger negative return than Intuit, indicating weaker market performance over the past year.
Target Prices
The current analyst consensus shows promising upside potential for both Intuit Inc. and Paycom Software, Inc.
| Company | Target High | Target Low | Consensus |
|---|---|---|---|
| Intuit Inc. | 880 | 700 | 798.4 |
| Paycom Software, Inc. | 290 | 165 | 215 |
Analysts expect Intuit’s stock to trade significantly higher than the current price of 544.34 USD, reflecting strong confidence in growth prospects. Paycom’s consensus target of 215 USD also suggests considerable upside from its current price around 149.11 USD.
Analyst Opinions Comparison
This section compares analysts’ ratings and grades for Intuit Inc. and Paycom Software, Inc.:
Rating Comparison
INTU Rating
- Rating: B, considered Very Favorable overall.
- Discounted Cash Flow Score: 4, Favorable assessment of future cash flows.
- ROE Score: 4, favorable efficiency in generating profit from equity.
- ROA Score: 5, very favorable asset utilization.
- Debt To Equity Score: 2, moderate financial risk due to higher leverage.
- Overall Score: 3, moderate overall financial standing.
PAYC Rating
- Rating: A, considered Very Favorable overall.
- Discounted Cash Flow Score: 5, Very Favorable evaluation of cash flow projections.
- ROE Score: 5, very favorable profit generation efficiency.
- ROA Score: 5, very favorable asset utilization.
- Debt To Equity Score: 4, favorable financial stability with lower leverage.
- Overall Score: 4, favorable overall financial standing.
Which one is the best rated?
Based strictly on the provided data, Paycom Software, Inc. (PAYC) holds a stronger position with higher ratings across all key financial metrics and an overall score of 4, compared to Intuit Inc.’s (INTU) overall score of 3.
Scores Comparison
The comparison of Intuit Inc. and Paycom Software, Inc. scores is as follows:
Intuit Inc. Scores
- Altman Z-Score: 9.35, indicating a safe zone with low bankruptcy risk.
- Piotroski Score: 9, classified as very strong financial health.
Paycom Software Scores
- Altman Z-Score: 3.84, also in the safe zone, low bankruptcy risk.
- Piotroski Score: 5, indicating average financial strength.
Which company has the best scores?
Intuit Inc. has higher scores than Paycom Software, with a significantly stronger Piotroski Score and a higher Altman Z-Score, suggesting better financial stability and health based on the provided data.
Grades Comparison
Here is a comparison of the recent grades assigned to Intuit Inc. and Paycom Software, Inc.:
Intuit Inc. Grades
The following table summarizes Intuit Inc.’s grades from various reputable grading companies over the past year:
| Grading Company | Action | New Grade | Date |
|---|---|---|---|
| Wells Fargo | Downgrade | Equal Weight | 2026-01-08 |
| Wells Fargo | Maintain | Overweight | 2025-11-21 |
| RBC Capital | Maintain | Outperform | 2025-11-21 |
| BMO Capital | Maintain | Outperform | 2025-11-21 |
| Evercore ISI Group | Maintain | Outperform | 2025-11-18 |
| RBC Capital | Maintain | Outperform | 2025-09-02 |
| RBC Capital | Maintain | Outperform | 2025-08-22 |
| UBS | Maintain | Neutral | 2025-08-22 |
| Morgan Stanley | Maintain | Overweight | 2025-08-22 |
| Barclays | Maintain | Overweight | 2025-08-22 |
Intuit’s grades generally trend toward Outperform and Overweight, with a recent slight downgrade to Equal Weight by Wells Fargo.
Paycom Software, Inc. Grades
The following table presents Paycom Software, Inc.’s most recent grades from recognized grading companies:
| Grading Company | Action | New Grade | Date |
|---|---|---|---|
| Barclays | Maintain | Equal Weight | 2026-01-12 |
| TD Cowen | Maintain | Buy | 2026-01-08 |
| Citigroup | Maintain | Neutral | 2025-12-23 |
| Keybanc | Maintain | Overweight | 2025-11-06 |
| TD Cowen | Maintain | Buy | 2025-11-06 |
| UBS | Maintain | Buy | 2025-11-06 |
| Jefferies | Maintain | Hold | 2025-11-06 |
| JP Morgan | Maintain | Neutral | 2025-11-06 |
| Mizuho | Maintain | Neutral | 2025-11-06 |
| Barclays | Maintain | Equal Weight | 2025-11-06 |
Paycom’s grades mostly cluster around Buy, Hold, and Neutral ratings, with no recent downgrades.
Which company has the best grades?
Intuit Inc. holds a stronger consensus with multiple Outperform and Overweight ratings, supported by a “Buy” consensus from 31 analysts, compared to Paycom Software’s mixed Buy and Neutral ratings and a “Hold” consensus. Investors may interpret Intuit’s grades as reflecting greater confidence from analysts, potentially indicating more favorable expectations.
Strengths and Weaknesses
Below is a comparative overview of the key strengths and weaknesses of Intuit Inc. (INTU) and Paycom Software, Inc. (PAYC) based on recent financial performance, profitability, market presence, and innovation indicators.
| Criterion | Intuit Inc. (INTU) | Paycom Software, Inc. (PAYC) |
|---|---|---|
| Diversification | Highly diversified with multiple segments: Consumer $4.87B, Global Business Solutions $11.08B, Credit Karma $2.26B, and Professional Tax $621M in 2025. | Less diversified, heavily reliant on recurring revenue ($1.73B in 2024) with smaller implementation services ($24.4M). |
| Profitability | Favorable net margin (20.55%), ROE (19.63%), and ROIC (14.78%) but declining ROIC trend; PE ratio high at 56.82 (unfavorable). | Strong profitability with net margin (26.66%), ROE (31.85%), ROIC (24.86%) and growing ROIC trend; PE ratio moderate at 22.95 (neutral). |
| Innovation | Strong innovation through acquisitions (Credit Karma) and product expansion, but ROIC decline suggests some efficiency challenges. | High innovation efficiency shown by very favorable moat and rising ROIC, reflecting durable competitive advantage. |
| Global presence | Established global business solutions segment, broad geographic reach. | Primarily US-based with strong domestic market focus, less global footprint. |
| Market Share | Large market share in tax and financial software markets, supported by diversified offerings. | Growing market share in payroll and HR software sector, with recurring revenue model enhancing stability. |
Key takeaways: Intuit benefits from strong diversification and global reach but faces a slight decline in profitability efficiency. Paycom displays robust profitability growth and a durable moat, though it is less diversified and more domestically focused. Investors should balance Intuit’s broad exposure against Paycom’s operational excellence and growth trajectory.
Risk Analysis
Below is a comparative overview of key risks for Intuit Inc. (INTU) and Paycom Software, Inc. (PAYC) based on the most recent financial and operational data.
| Metric | Intuit Inc. (INTU) | Paycom Software, Inc. (PAYC) |
|---|---|---|
| Market Risk | Beta 1.25 indicates moderate volatility and sensitivity to market swings. | Beta 0.82 suggests lower volatility and less sensitivity to market fluctuations. |
| Debt level | Debt-to-Equity 0.34; moderate debt with strong interest coverage (20.57x). | Debt-to-Equity 0.05; very low debt and extremely high interest coverage (191.88x). |
| Regulatory Risk | Exposure to financial and data privacy regulations in multiple markets; tax software compliance critical. | Subject to labor laws and data security regulations in the U.S.; cloud service compliance essential. |
| Operational Risk | Complex multi-segment operations (QuickBooks, TurboTax, Credit Karma) require integration and cybersecurity vigilance. | Cloud-based HCM platform demands high uptime and data security; operational disruptions could impact client retention. |
| Environmental Risk | Moderate; primarily office-based operations with digital footprint, limited direct environmental impact. | Low; software service with minimal environmental footprint but potential risks from data centers’ energy use. |
| Geopolitical Risk | Global presence exposes to currency and trade policy risks; U.S.-China tensions may affect supply chain and expansion. | Primarily U.S.-focused, reducing exposure but dependent on domestic economic and political stability. |
In summary, Intuit faces moderate market and regulatory risks due to its global footprint and diverse product range, with manageable debt levels. Paycom exhibits lower market and debt risks but is more sensitive to operational reliability and U.S. regulatory changes. Both companies maintain strong financial health, minimizing bankruptcy risk, but investors should monitor regulatory developments and operational resilience closely.
Which Stock to Choose?
Intuit Inc. (INTU) shows a favorable income evolution with 15.63% revenue growth over the past year and a strong global income statement rating. Its financial ratios are mostly favorable, including a high return on equity of 19.63% and a low debt-to-equity ratio of 0.34. The company maintains a very favorable rating of B, supported by strong profitability and manageable debt, although its price multiples appear expensive.
Paycom Software, Inc. (PAYC) exhibits robust income growth, with a 11.19% revenue increase last year and outstanding net margin improvements overall. Its financial ratios are similarly favorable, featuring a higher return on equity of 31.85% and very low leverage with a debt-to-equity ratio of 0.05. PAYC holds a very favorable A rating, reflecting solid profitability and financial stability despite slightly elevated valuation metrics.
For investors prioritizing growth and profitability, PAYC’s very favorable rating and increasing return on invested capital could appear attractive. Conversely, those valuing stability with solid income and a proven track record might find INTU’s consistent value creation and moderate debt profile more aligned with their goals. Both companies demonstrate favorable financial health, yet their differing profiles may suit distinct investor preferences.
Disclaimer: Investment carries a risk of loss of initial capital. The past performance is not a reliable indicator of future results. Be sure to understand risks before making an investment decision.
Go Further
I encourage you to read the complete analyses of Intuit Inc. and Paycom Software, Inc. to enhance your investment decisions: