Intuit Inc. and monday.com Ltd. are two prominent players in the software application industry, each offering innovative solutions tailored to business productivity and financial management. While Intuit focuses on financial tools for small businesses and consumers, monday.com delivers a versatile cloud-based work operating system for diverse organizational needs. This comparison explores their market positions and innovation strategies to help you identify the most compelling investment opportunity. Let’s dive in to find out which company stands out for your portfolio.

Table of contents
Companies Overview
I will begin the comparison between Intuit Inc. and monday.com Ltd. by providing an overview of these two companies and their main differences.
Intuit Inc. Overview
Intuit Inc. delivers financial management and compliance products for consumers, small businesses, self-employed, and accounting professionals worldwide. Its key offerings include QuickBooks software, TurboTax tax preparation, Credit Karma personal finance, and ProConnect tax solutions. Founded in 1983 and headquartered in Mountain View, California, Intuit holds a strong position in the financial software market with a $151.6B market cap.
monday.com Ltd. Overview
monday.com Ltd. develops cloud-based Work OS software applications designed to support work and project management across various industries. It offers modular tools for marketing, CRM, software development, and more, serving organizations globally. Established in 2012 and based in Tel Aviv, Israel, monday.com has a market cap of $6.5B and focuses on visual work management solutions.
Key similarities and differences
Both companies operate in the software application industry and serve a global client base with cloud-based solutions. Intuit primarily focuses on financial management and tax-related services, while monday.com concentrates on work operating systems and project management tools. Intuit’s extensive history and larger market cap contrast with monday.com’s more recent IPO and smaller scale, highlighting different stages of company maturity and specialization.
Income Statement Comparison
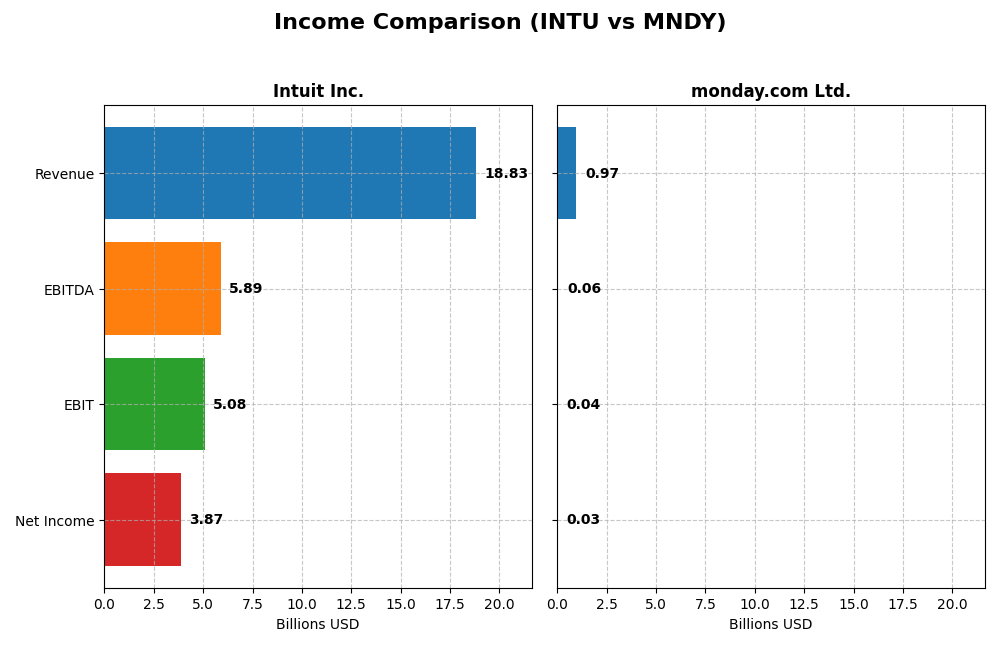
Below is a side-by-side comparison of the most recent fiscal year income statement figures for Intuit Inc. and monday.com Ltd., providing key financial metrics for analysis.
| Metric | Intuit Inc. (INTU) | monday.com Ltd. (MNDY) |
|---|---|---|
| Market Cap | 151.6B | 6.52B |
| Revenue | 18.83B | 972M |
| EBITDA | 5.89B | 58.0M |
| EBIT | 5.08B | 39.8M |
| Net Income | 3.87B | 32.4M |
| EPS | 13.82 | 0.65 |
| Fiscal Year | 2025 | 2024 |
Income Statement Interpretations
Intuit Inc.
Intuit’s revenue and net income exhibited steady growth from 2021 to 2025, with revenue nearly doubling from $9.6B to $18.8B and net income rising from $2.06B to $3.87B. Margins remained strong, with a gross margin of 80.76% and a net margin of 20.55% in 2025. The latest fiscal year showed favorable growth in revenue (+15.6%) and earnings (+31%), confirming solid profitability and operational efficiency.
monday.com Ltd.
Monday.com displayed rapid revenue growth between 2020 and 2024, surging from $161M to $972M, alongside a positive net income turnaround from a loss of $152M in 2020 to a profit of $32M in 2024. Gross margin improved to 89.33%, while EBIT and net margins remained modest at 4.09% and 3.33%, respectively. The recent year saw significant margin and profitability improvements, reflecting accelerating operational leverage.
Which one has the stronger fundamentals?
Intuit benefits from larger scale, higher and more stable margins, and consistent profitability growth, reflecting mature fundamentals. Monday.com’s fundamentals show impressive growth and margin expansion from a smaller base, but with lower absolute profitability and more modest margins. Both companies present favorable income statement trends, though Intuit exhibits stronger overall income statement metrics and margin stability.
Financial Ratios Comparison
This table presents the latest available key financial ratios for Intuit Inc. and monday.com Ltd., allowing for a straightforward side-by-side comparison.
| Ratios | Intuit Inc. (2025) | monday.com Ltd. (2024) |
|---|---|---|
| ROE | 19.6% | 3.1% |
| ROIC | 14.8% | -1.7% |
| P/E | 56.8 | 363 |
| P/B | 11.2 | 11.4 |
| Current Ratio | 1.36 | 2.66 |
| Quick Ratio | 1.36 | 2.66 |
| D/E (Debt-to-Equity) | 0.34 | 0.10 |
| Debt-to-Assets | 18.0% | 6.3% |
| Interest Coverage | 19.9 | 0 |
| Asset Turnover | 0.51 | 0.58 |
| Fixed Asset Turnover | 12.5 | 7.13 |
| Payout ratio | 30.7% | 0% |
| Dividend yield | 0.54% | 0% |
Interpretation of the Ratios
Intuit Inc.
Intuit shows strong profitability ratios with a net margin of 20.55%, ROE at 19.63%, and ROIC of 14.78%, indicating efficient capital use. However, valuation ratios like P/E of 56.82 and P/B of 11.15 are unfavorable, suggesting a high market price relative to earnings and book value. The dividend yield is low at 0.54%, with a consistent payout supported by free cash flow, posing limited risk in distributions.
monday.com Ltd.
monday.com’s ratios reveal challenges, with low profitability metrics: a net margin of 3.33%, ROE at 3.14%, and negative ROIC at -1.73%. Despite strong liquidity ratios (current and quick ratios at 2.66) and low leverage, the valuation multiples are very high, such as a P/E of 362.98 and a P/B of 11.41. The company does not pay dividends, reflecting its reinvestment and growth-focused strategy.
Which one has the best ratios?
Intuit presents a more favorable overall financial profile with strong profitability and solid capital management despite high valuation multiples. monday.com shows a mixed picture with weaker profitability but good liquidity and low debt. Thus, Intuit’s ratios appear more robust, while monday.com’s reflect a riskier growth phase and reinvestment focus.
Strategic Positioning
This section compares the strategic positioning of Intuit and monday.com, including market position, key segments, and exposure to technological disruption:
Intuit Inc.
- Leading software application provider with high market cap ($151.6B) and diverse competitive pressures.
- Operates in multiple segments: Small Business, Consumer, Credit Karma, and Professional Tax.
- Exposure to cloud technology with established financial management and tax software solutions.
monday.com Ltd.
- Smaller market cap ($6.5B) with growth focus in cloud-based work management software.
- Focused on cloud-based Work OS platform serving marketing, CRM, project management, and development.
- Positioned in cloud work OS with modular tools, facing evolving software development trends.
Intuit vs monday.com Positioning
Intuit shows a diversified business model across various financial and tax software segments, offering scale advantages. monday.com concentrates on cloud-based work management tools, emphasizing modularity and flexibility but with a narrower product scope. Each approach has inherent scale and focus trade-offs.
Which has the best competitive advantage?
Intuit maintains a slightly favorable moat with value creation despite declining profitability, indicating stronger capital efficiency. monday.com shows improving profitability but currently destroys value, reflecting a weaker competitive advantage based on MOAT evaluation.
Stock Comparison
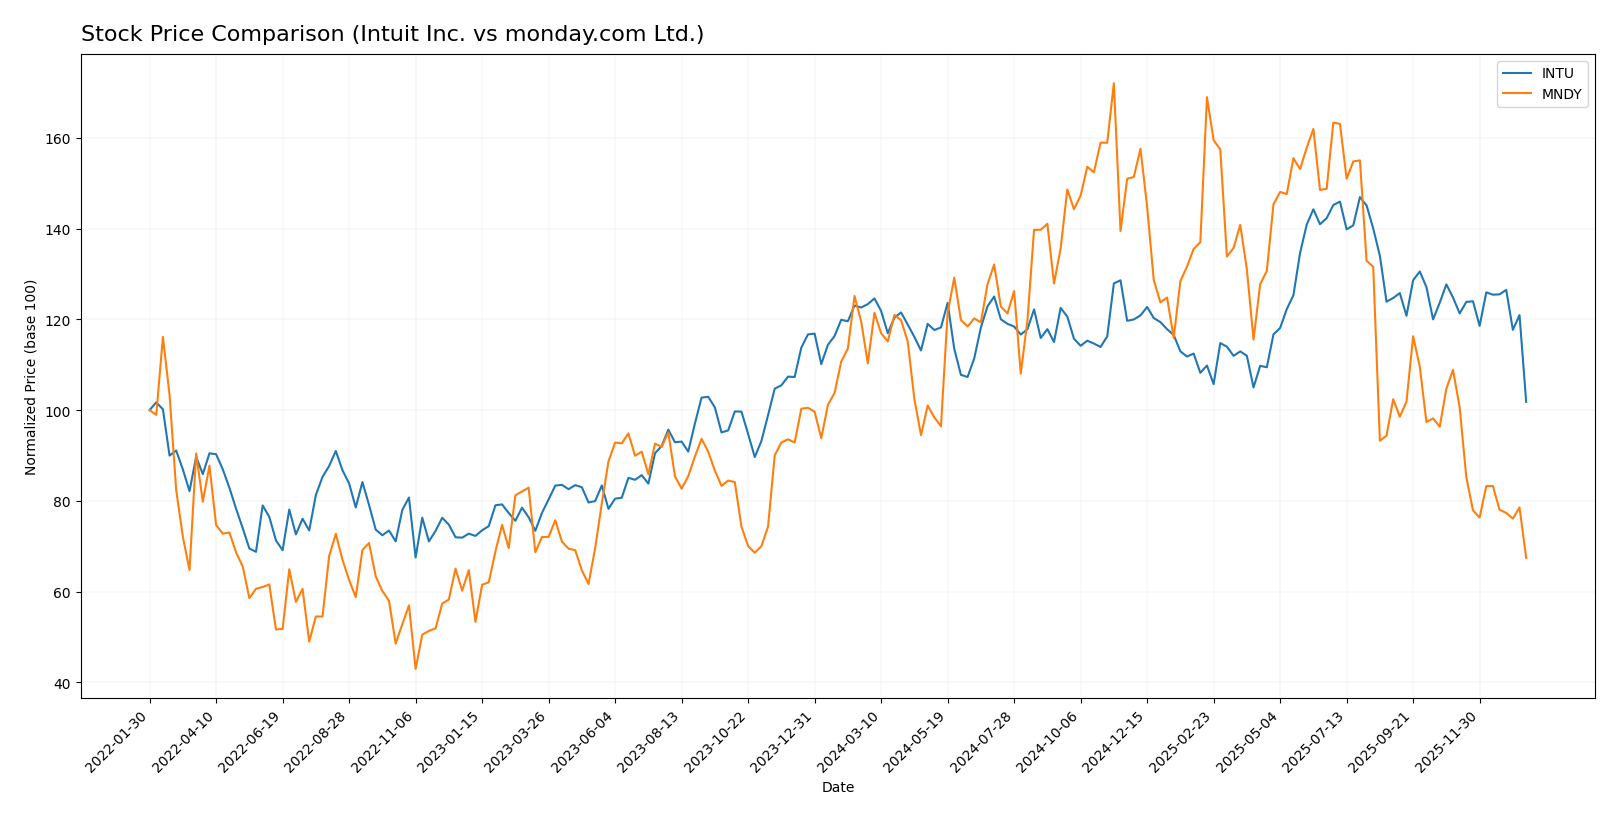
The stock prices of Intuit Inc. and monday.com Ltd. have exhibited notable bearish trends over the past 12 months, with both companies experiencing significant declines and deceleration in price movements.
Trend Analysis
Intuit Inc. (INTU) showed a bearish trend over the past year with a -17.46% price change and decelerating momentum. Volatility is high, indicated by a 51.52 standard deviation, with prices ranging from 544.62 to 785.95.
monday.com Ltd. (MNDY) also displayed a bearish trend, declining -38.87% over the same period with deceleration. Its volatility is slightly lower at 47.31 standard deviation, with a price range between 127.09 and 324.31.
Comparing the two, Intuit’s stock outperformed monday.com by delivering a smaller negative return, indicating a less severe market decline over the past year.
Target Prices
Analysts present a bullish consensus for both Intuit Inc. and monday.com Ltd., signaling potential upside from current prices.
| Company | Target High | Target Low | Consensus |
|---|---|---|---|
| Intuit Inc. | 880 | 700 | 798.4 |
| monday.com Ltd. | 330 | 194 | 264.42 |
The consensus target prices for Intuit and monday.com exceed their current market prices of 544.5 and 127.32 USD respectively, indicating expected growth potential according to analyst estimates.
Analyst Opinions Comparison
This section compares analysts’ ratings and grades for Intuit Inc. and monday.com Ltd.:
Rating Comparison
INTU Rating
- Rating: B, classified as Very Favorable by analysts.
- Discounted Cash Flow Score: 4, indicating a Favorable valuation.
- Return on Equity Score: 4, reflecting efficient profit generation.
- Return on Assets Score: 5, a Very Favorable indication of asset utilization.
- Debt To Equity Score: 2, showing Moderate financial risk.
- Overall Score: 3, rated as Moderate.
MNDY Rating
- Rating: B-, also considered Very Favorable by analysts.
- Discounted Cash Flow Score: 4, indicating a Favorable valuation.
- Return on Equity Score: 3, showing moderate efficiency in profit generation.
- Return on Assets Score: 3, a moderate indication of asset utilization.
- Debt To Equity Score: 3, also indicating Moderate financial risk.
- Overall Score: 3, rated as Moderate.
Which one is the best rated?
Based strictly on the data, Intuit Inc. holds a higher Return on Equity and Return on Assets score compared to monday.com Ltd., suggesting better operational efficiency and asset use, while both share the same overall and discounted cash flow scores.
Scores Comparison
Here is a comparison of the Altman Z-Score and Piotroski Score for Intuit Inc. and monday.com Ltd.:
INTU Scores
- Altman Z-Score: 9.35, indicating a safe zone financial position.
- Piotroski Score: 9, classified as very strong financial health.
MNDY Scores
- Altman Z-Score: 6.33, also reflecting a safe zone status.
- Piotroski Score: 5, considered average financial strength.
Which company has the best scores?
Intuit Inc. shows stronger financial health with a higher Altman Z-Score and a very strong Piotroski Score compared to monday.com Ltd., which has a lower Piotroski Score indicating average financial strength.
Grades Comparison
Here is the comparison of recent grades provided by reputable financial institutions for Intuit Inc. and monday.com Ltd.:
Intuit Inc. Grades
This table summarizes recent grades and rating actions from recognized grading companies for Intuit Inc.:
| Grading Company | Action | New Grade | Date |
|---|---|---|---|
| Wells Fargo | Downgrade | Equal Weight | 2026-01-08 |
| Wells Fargo | Maintain | Overweight | 2025-11-21 |
| RBC Capital | Maintain | Outperform | 2025-11-21 |
| BMO Capital | Maintain | Outperform | 2025-11-21 |
| Evercore ISI Group | Maintain | Outperform | 2025-11-18 |
| RBC Capital | Maintain | Outperform | 2025-09-02 |
| RBC Capital | Maintain | Outperform | 2025-08-22 |
| UBS | Maintain | Neutral | 2025-08-22 |
| Morgan Stanley | Maintain | Overweight | 2025-08-22 |
| Barclays | Maintain | Overweight | 2025-08-22 |
Intuit’s grades predominantly indicate a strong buy sentiment with most ratings at Outperform or Overweight, though a recent downgrade to Equal Weight suggests some caution.
monday.com Ltd. Grades
The following table presents recent grades and rating actions from established grading companies for monday.com Ltd.:
| Grading Company | Action | New Grade | Date |
|---|---|---|---|
| Barclays | Maintain | Overweight | 2026-01-12 |
| Jefferies | Maintain | Buy | 2026-01-05 |
| Citigroup | Maintain | Buy | 2025-12-23 |
| Tigress Financial | Maintain | Buy | 2025-12-11 |
| JP Morgan | Maintain | Overweight | 2025-11-11 |
| Morgan Stanley | Maintain | Overweight | 2025-11-11 |
| Piper Sandler | Maintain | Overweight | 2025-11-11 |
| Canaccord Genuity | Maintain | Buy | 2025-11-11 |
| Baird | Maintain | Outperform | 2025-11-11 |
| Citigroup | Maintain | Buy | 2025-11-11 |
monday.com’s grades consistently show positive sentiment, with all ratings at Buy, Overweight, or Outperform and no recent downgrades.
Which company has the best grades?
Both companies hold a consensus “Buy” rating, but monday.com Ltd. has a more uniformly positive set of grades without recent downgrades, while Intuit Inc. shows some caution with a recent downgrade to Equal Weight. Investors might interpret monday.com’s stable positive outlook as indicating less immediate risk compared to Intuit’s mixed signals.
Strengths and Weaknesses
Below is a comparison of key strengths and weaknesses between Intuit Inc. and monday.com Ltd. based on the most recent financial and operational data.
| Criterion | Intuit Inc. (INTU) | monday.com Ltd. (MNDY) |
|---|---|---|
| Diversification | Highly diversified with Consumer, Small Business, Professional Tax, and Credit Karma segments generating $22.9B in 2025 revenue | Limited diversification, focused primarily on work operating systems and collaboration tools |
| Profitability | Strong profitability: 20.55% net margin, 19.63% ROE, 14.78% ROIC; generating value but ROIC declining | Low profitability: 3.33% net margin, 3.14% ROE, negative ROIC; shedding value but improving |
| Innovation | Established product ecosystem with continuous enhancements and acquisitions (e.g., Credit Karma) | Rapid innovation with growing ROIC, focused on cloud-based collaboration software |
| Global presence | Extensive global business solutions and consumer reach | Expanding presence globally but smaller scale compared to Intuit |
| Market Share | Leading market share in financial and tax software segments | Growing but still smaller market share in collaboration software |
Key takeaways: Intuit shows strong diversification and profitability with a solid market position but faces slight declines in capital efficiency. monday.com is innovating rapidly with improving returns but remains less profitable and less diversified, presenting higher risk but potential growth opportunities.
Risk Analysis
Below is a summary table of key risks for Intuit Inc. (INTU) and monday.com Ltd. (MNDY) based on recent financial and operational data:
| Metric | Intuit Inc. (INTU) | monday.com Ltd. (MNDY) |
|---|---|---|
| Market Risk | Moderate (Beta 1.25) | Moderate (Beta 1.25) |
| Debt level | Low (Debt/Equity 0.34) | Very Low (Debt/Equity 0.10) |
| Regulatory Risk | Moderate (US & international) | Moderate (Global, Israel HQ) |
| Operational Risk | Low (Established product suite) | Moderate (Growth phase) |
| Environmental Risk | Low (Tech sector) | Low (Tech sector) |
| Geopolitical Risk | Low (US-based) | Moderate (Israel-based exposure) |
Intuit’s risks are mainly moderate market fluctuations and regulatory challenges due to its broad international reach. monday.com faces higher operational and geopolitical risks given its growth stage and exposure to Middle East geopolitical tensions. Both maintain low debt levels, supporting financial stability.
Which Stock to Choose?
Intuit Inc. (INTU) has shown strong income growth with a favorable 15.63% revenue increase in the last year and solid profitability metrics, including a 20.55% net margin. Its financial ratios are mostly favorable, with a low debt level and a very strong interest coverage ratio. The company holds a very favorable overall rating and scores highly on financial strength with a safe Altman Z-Score and a very strong Piotroski score.
monday.com Ltd. (MNDY) exhibits rapid revenue growth at 33.21% annually and improving profitability, albeit from a lower base, with a 3.33% net margin and some unfavorable financial ratios like a negative ROIC. Its debt levels are low, and liquidity ratios are favorable. The company has a very favorable rating overall, though its financial strength is moderate with a safe Altman Z-Score but only an average Piotroski score.
For investors prioritizing established profitability and financial stability, Intuit’s favorable rating and consistent value creation with a strong moat might appear more attractive. Conversely, those with a growth-oriented, risk-tolerant profile might see monday.com’s rapid income growth and improving profitability as a potential opportunity despite its current challenges.
Disclaimer: Investment carries a risk of loss of initial capital. The past performance is not a reliable indicator of future results. Be sure to understand risks before making an investment decision.
Go Further
I encourage you to read the complete analyses of Intuit Inc. and monday.com Ltd. to enhance your investment decisions: