In the dynamic world of technology, Intuit Inc. and Match Group, Inc. stand out for their innovative software applications that cater to distinct yet impactful markets. Intuit focuses on financial management solutions for individuals and businesses, while Match Group leads in digital dating platforms worldwide. Comparing these companies offers valuable insight into diverse strategies and market positions. Join me as we explore which presents a more compelling investment opportunity in 2026.

Table of contents
Companies Overview
I will begin the comparison between Intuit Inc. and Match Group, Inc. by providing an overview of these two companies and their main differences.
Intuit Inc. Overview
Intuit Inc. focuses on financial management and compliance products for consumers, small businesses, and accounting professionals across the US, Canada, and internationally. Its diverse offerings include QuickBooks for business accounting, TurboTax for tax preparation, and Credit Karma for personal finance. Founded in 1983 and headquartered in Mountain View, California, Intuit operates in four segments addressing small business, consumer, credit, and professional tax needs.
Match Group, Inc. Overview
Match Group, Inc. operates in the dating services sector, providing a portfolio of brands such as Tinder, Match, OkCupid, and Hinge worldwide. Incorporated in 1986 and based in Dallas, Texas, the company specializes exclusively in software applications for online dating. Match Group employs about 2,500 people and focuses on connecting people through digital platforms within the technology sector.
Key similarities and differences
Both companies operate within the technology sector and provide software application solutions, but their business models serve distinct markets. Intuit targets financial management with a broad product range for business and personal finance, while Match Group concentrates solely on digital dating services. Intuit’s market cap is substantially larger at approximately 151B USD compared to Match Group’s 7.4B USD, reflecting their different scales and market focuses.
Income Statement Comparison
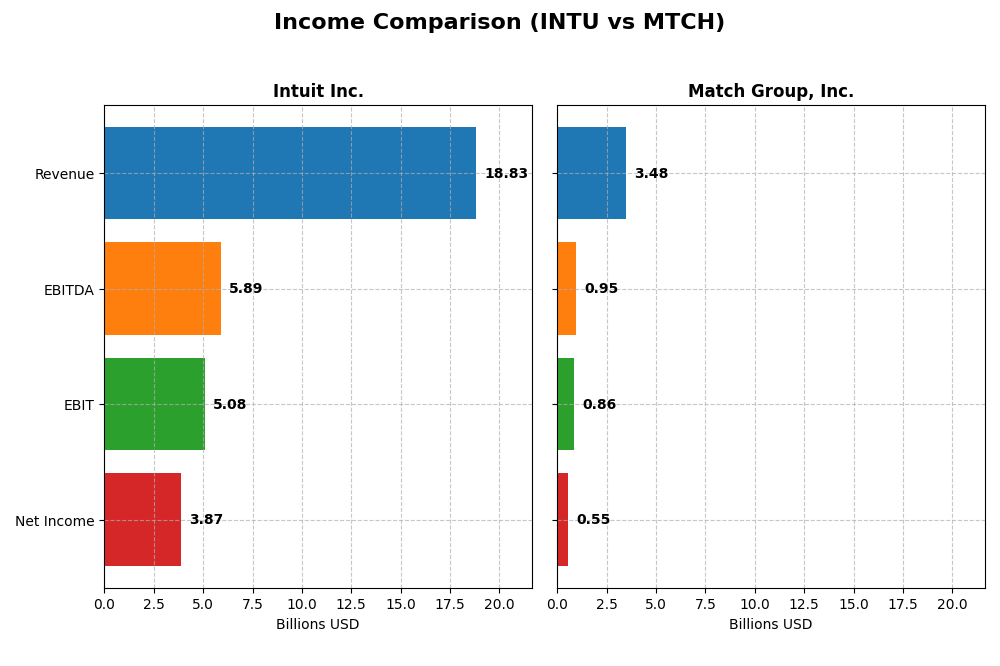
The table below provides a factual side-by-side comparison of key income statement metrics for Intuit Inc. and Match Group, Inc. for their most recent fiscal years.
| Metric | Intuit Inc. (INTU) | Match Group, Inc. (MTCH) |
|---|---|---|
| Market Cap | 151.5B | 7.4B |
| Revenue | 18.8B | 3.5B |
| EBITDA | 5.9B | 952M |
| EBIT | 5.1B | 864M |
| Net Income | 3.9B | 563M |
| EPS | 13.82 | 2.12 |
| Fiscal Year | 2025 | 2024 |
Income Statement Interpretations
Intuit Inc.
Intuit’s revenue and net income have shown consistent growth from 2021 to 2025, with revenue nearly doubling to $18.8B and net income increasing by 87.6% to $3.87B. Margins remain strong and mostly stable, with a gross margin of 80.76% and a net margin of 20.55% in 2025. The latest year saw favorable growth across revenue (+15.6%), EBIT (+34%), and EPS (+31%), signaling robust operating efficiency.
Match Group, Inc.
Match Group’s revenue rose steadily to $3.48B by 2024, with net income growing significantly over the longer term by 239.6% to $563.9M. Margins have been favorable, with a 71.5% gross margin and a 15.8% net margin in 2024. However, recent year growth slowed, with EBIT down 7.7% and net margin declining 18.2%, indicating some pressure on profitability despite overall positive trends.
Which one has the stronger fundamentals?
Intuit demonstrates stronger fundamentals with higher revenue scale, superior margin levels, and more consistent growth in profitability metrics. Its 2025 performance highlights solid margin expansion and efficient expense management. Match Group shows impressive net income growth over time but faces recent margin compression and slower earnings growth, reflecting less stability in its income statement fundamentals.
Financial Ratios Comparison
This table presents the most recent key financial ratios for Intuit Inc. and Match Group, Inc., enabling a direct comparison of their financial performance and position.
| Ratios | Intuit Inc. (INTU) | Match Group, Inc. (MTCH) |
|---|---|---|
| ROE | 19.6% | -865.98% |
| ROIC | 14.8% | 16.4% |
| P/E | 56.8 | 15.4 |
| P/B | 11.2 | -133.7 |
| Current Ratio | 1.36 | 2.54 |
| Quick Ratio | 1.36 | 2.54 |
| D/E | 0.34 | -62.1 |
| Debt-to-Assets | 18.0% | 88.5% |
| Interest Coverage | 19.9 | 5.1 |
| Asset Turnover | 0.51 | 0.78 |
| Fixed Asset Turnover | 12.5 | 22.0 |
| Payout ratio | 30.7% | 0% |
| Dividend yield | 0.54% | 0% |
Interpretation of the Ratios
Intuit Inc.
Intuit shows strong profitability with a 20.55% net margin and 19.63% ROE, supported by favorable returns on invested capital. Liquidity and leverage metrics are solid, though valuation multiples like P/E and P/B appear stretched. Dividend yield is low at 0.54%, reflecting a modest payout supported by stable free cash flow, with manageable risks related to distribution levels.
Match Group, Inc.
Match Group exhibits favorable profitability and return on invested capital but suffers from a severely negative ROE, indicating equity challenges. Liquidity ratios are strong, yet debt to assets is concerningly high at 88.51%. The company does not pay dividends, likely prioritizing reinvestment and growth, which aligns with its high free cash flow yield and ongoing operational investments.
Which one has the best ratios?
Both companies have a majority of favorable ratios, but Intuit’s superior profitability, healthier equity returns, and balanced leverage contrast with Match Group’s negative ROE and high debt ratio. While Match Group has stronger liquidity, Intuit’s overall risk profile and dividend support suggest more stable financial health based on these metrics.
Strategic Positioning
This section compares the strategic positioning of Intuit Inc. and Match Group, Inc., focusing on Market position, Key segments, and Exposure to technological disruption:
Intuit Inc.
- Leading financial management software provider with strong competitive presence in SMB and consumer markets.
- Diverse segments including Small Business, Consumer, Credit Karma, and Professional Tax driving revenue growth.
- Faces moderate disruption risk due to evolving financial tech but maintains cloud-based and digital service innovation.
Match Group, Inc.
- Major global dating service provider with dominant brands and competitive pressure in online dating industry.
- Concentrated focus on dating products with portfolio including Tinder, Match, and others as key revenue drivers.
- Exposed to disruption risks in digital matchmaking and social trends but leverages strong brand recognition.
Intuit Inc. vs Match Group, Inc. Positioning
Intuit has a diversified business model across multiple segments including SMB and consumer finance, providing resilience and multiple growth drivers. Match Group is concentrated in online dating services, focusing on brand portfolio strength but with less diversification.
Which has the best competitive advantage?
Both companies create value with ROIC above WACC but face declining profitability trends. Their economic moats are assessed as slightly favorable, indicating moderate but sustainable competitive advantages in their respective markets.
Stock Comparison
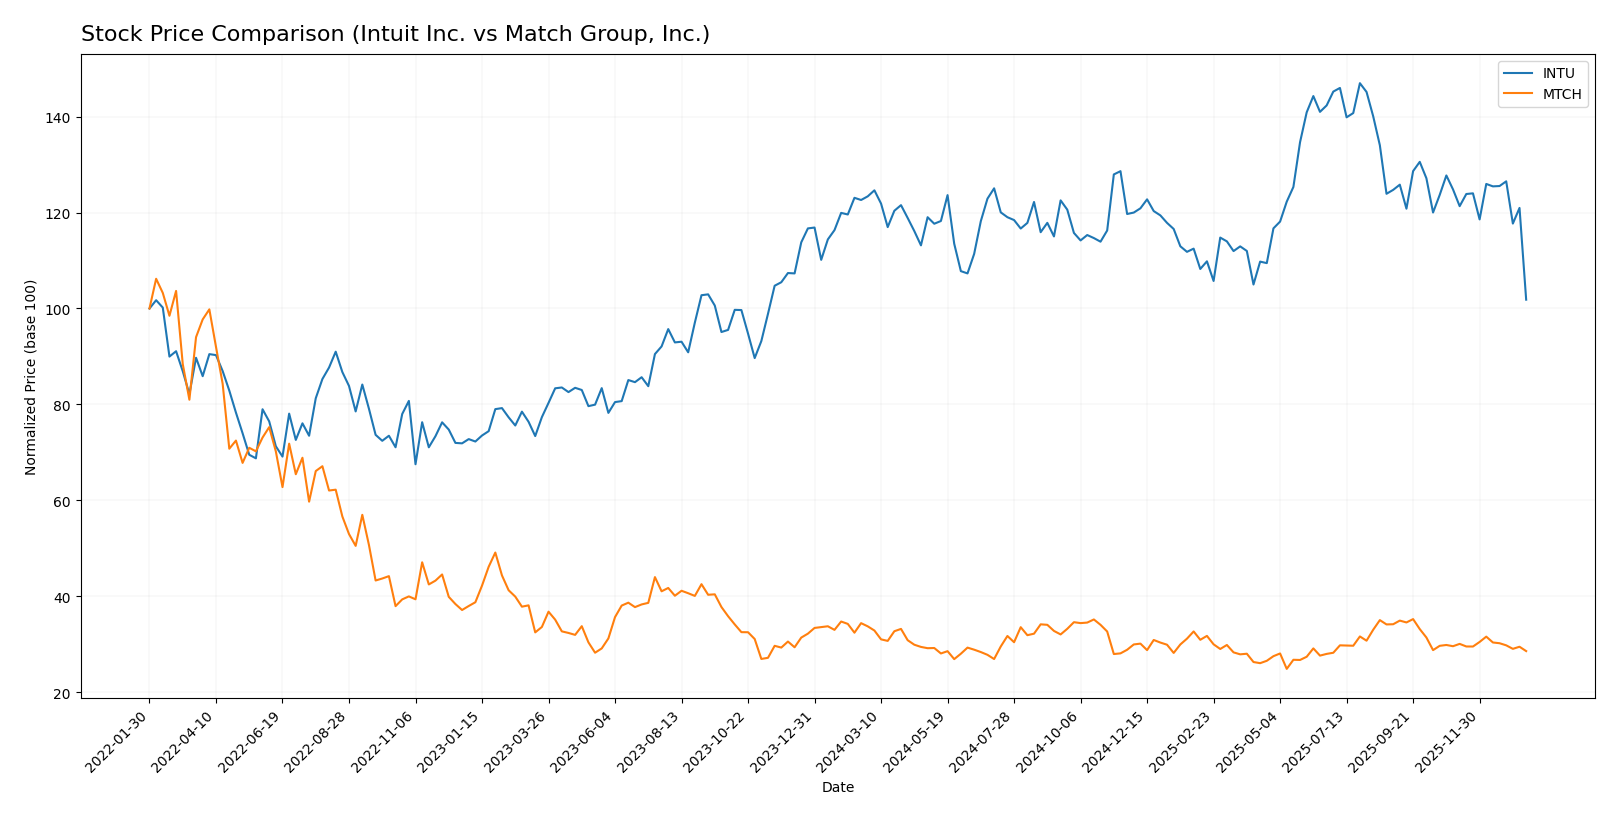
The past year reveals a bearish trend for both Intuit Inc. and Match Group, Inc., with Intuit experiencing a notable price decline and higher volatility compared to Match Group’s steadier but also negative performance.
Trend Analysis
Intuit Inc.’s stock declined by 17.46% over the past 12 months, indicating a bearish trend with deceleration. The stock showed high volatility, with prices ranging from 544.62 to 785.95 and a recent slope of -4.98.
Match Group, Inc. also posted a bearish trend, falling 15.28% over the same period with deceleration and far lower volatility. The stock traded between 27.18 and 38.51, with a recent slope of -0.08 showing mild downward pressure.
Comparing both stocks, Intuit delivered a slightly worse market performance than Match Group, with a larger percentage decline and greater price fluctuation over the past year.
Target Prices
Analysts show a positive target price consensus for Intuit Inc. and Match Group, Inc., indicating potential upside from current prices.
| Company | Target High | Target Low | Consensus |
|---|---|---|---|
| Intuit Inc. | 880 | 700 | 798.4 |
| Match Group, Inc. | 43 | 33 | 36.29 |
The consensus target prices for Intuit and Match Group suggest expected gains of roughly 47% and 16% respectively, compared to their current market prices of $544.22 and $31.23. This signals moderate optimism among analysts about their near-term performance.
Analyst Opinions Comparison
This section compares analysts’ ratings and grades for Intuit Inc. and Match Group, Inc.:
Rating Comparison
INTU Rating
- Rating: Both have a “B” rating, considered very favorable.
- Discounted Cash Flow Score: 4, favorable valuation outlook.
- ROE Score: 4, favorable profit generation from equity.
- ROA Score: 5, very favorable asset utilization.
- Debt To Equity Score: 2, moderate financial risk.
- Overall Score: 3, moderate overall financial standing.
MTCH Rating
- Rating: Both have a “B” rating, considered very favorable.
- Discounted Cash Flow Score: 5, very favorable valuation outlook.
- ROE Score: 1, very unfavorable profit generation from equity.
- ROA Score: 5, very favorable asset utilization.
- Debt To Equity Score: 1, very unfavorable financial risk.
- Overall Score: 3, moderate overall financial standing.
Which one is the best rated?
Both companies share the same overall rating and score of 3, but MTCH scores higher on discounted cash flow while INTU outperforms in return on equity and debt-to-equity metrics, indicating different strengths within a moderate rating framework.
Scores Comparison
Here is a comparison of the Altman Z-Score and Piotroski Score for Intuit Inc. and Match Group, Inc.:
INTU Scores
- Altman Z-Score: 9.35, indicating a safe financial zone and low bankruptcy risk.
- Piotroski Score: 9, reflecting very strong financial health and investment potential.
MTCH Scores
- Altman Z-Score: 0.52, indicating financial distress and high bankruptcy risk.
- Piotroski Score: 8, reflecting very strong financial health and investment potential.
Which company has the best scores?
Intuit Inc. exhibits a significantly higher Altman Z-Score than Match Group, indicating much lower bankruptcy risk. Both companies have very strong Piotroski Scores, but Intuit’s perfect score slightly outperforms Match Group’s.
Grades Comparison
Here is a detailed comparison of the recent grades assigned by reputable financial institutions for Intuit Inc. and Match Group, Inc.:
Intuit Inc. Grades
The following table summarizes Intuit’s latest grades from recognized grading companies:
| Grading Company | Action | New Grade | Date |
|---|---|---|---|
| Wells Fargo | Downgrade | Equal Weight | 2026-01-08 |
| Wells Fargo | Maintain | Overweight | 2025-11-21 |
| RBC Capital | Maintain | Outperform | 2025-11-21 |
| BMO Capital | Maintain | Outperform | 2025-11-21 |
| Evercore ISI Group | Maintain | Outperform | 2025-11-18 |
| RBC Capital | Maintain | Outperform | 2025-09-02 |
| RBC Capital | Maintain | Outperform | 2025-08-22 |
| UBS | Maintain | Neutral | 2025-08-22 |
| Morgan Stanley | Maintain | Overweight | 2025-08-22 |
| Barclays | Maintain | Overweight | 2025-08-22 |
Intuit’s grades predominantly trend towards Outperform and Overweight, with a recent slight downgrade from Wells Fargo to Equal Weight, indicating mostly positive analyst sentiment.
Match Group, Inc. Grades
The following table presents Match Group’s recent grades from established grading firms:
| Grading Company | Action | New Grade | Date |
|---|---|---|---|
| Morgan Stanley | Maintain | Equal Weight | 2026-01-13 |
| Truist Securities | Maintain | Hold | 2025-11-05 |
| Evercore ISI Group | Maintain | In Line | 2025-11-05 |
| Wells Fargo | Maintain | Equal Weight | 2025-11-05 |
| Morgan Stanley | Maintain | Equal Weight | 2025-10-20 |
| Susquehanna | Maintain | Positive | 2025-08-07 |
| Evercore ISI Group | Maintain | In Line | 2025-08-06 |
| JP Morgan | Maintain | Neutral | 2025-08-06 |
| UBS | Maintain | Neutral | 2025-07-23 |
| Wells Fargo | Maintain | Equal Weight | 2025-06-27 |
Match Group’s ratings mostly cluster around Equal Weight, Hold, and Neutral, reflecting a more cautious or balanced outlook among analysts.
Which company has the best grades?
Intuit Inc. has received generally more favorable grades, including multiple Outperform and Overweight ratings, while Match Group’s consensus shows more Hold and Equal Weight grades. This difference suggests Intuit is viewed with higher growth or performance expectations, potentially influencing investor confidence and portfolio positioning.
Strengths and Weaknesses
Below is a comparative overview of key strengths and weaknesses for Intuit Inc. (INTU) and Match Group, Inc. (MTCH) based on the most recent data from 2024-2025.
| Criterion | Intuit Inc. (INTU) | Match Group, Inc. (MTCH) |
|---|---|---|
| Diversification | Highly diversified across consumer, business, and tax segments with steady revenue growth | Less diversified, mainly focused on dating and service segments |
| Profitability | Strong profitability: net margin 20.55%, ROIC 14.78%, ROE 19.63% | Moderate profitability: net margin 15.84%, ROIC 16.38%, but negative ROE due to financial structure |
| Innovation | Continuous innovation in financial software and credit services (e.g., Credit Karma) | Innovation focused on digital dating services and platform expansion |
| Global presence | Global business solutions contribute over $11B revenue, indicating broad international reach | Significant presence in multiple markets but smaller global business footprint |
| Market Share | Leading market share in financial software and tax preparation | Major market share in online dating, but competitive sector with pressure on margins |
Key takeaways: Intuit shows strength in diversification and profitability with a stable global presence, though profitability trends are slightly declining. Match Group maintains a strong niche in online dating with favorable ROIC but faces challenges in ROE and high debt levels, indicating higher financial risk. Both companies create value but require cautious monitoring of profitability trends.
Risk Analysis
The table below summarizes key risk metrics for Intuit Inc. (INTU) and Match Group, Inc. (MTCH) based on the most recent financial data available.
| Metric | Intuit Inc. (INTU) | Match Group, Inc. (MTCH) |
|---|---|---|
| Market Risk | Beta 1.25 (moderate volatility) | Beta 1.33 (moderate volatility) |
| Debt level | Debt-to-assets 18% (low, favorable) | Debt-to-assets 89% (high, unfavorable) |
| Regulatory Risk | Moderate; financial software compliance | Moderate; global data privacy laws impact |
| Operational Risk | Low; diversified financial products | Moderate; reliant on user engagement trends |
| Environmental Risk | Low; primarily software business | Low; primarily software business |
| Geopolitical Risk | Moderate; operates internationally | Moderate; global user base exposure |
Intuit’s primary risks relate to market volatility and high valuation multiples, while its solid balance sheet and strong financial scores mitigate debt concerns. Match Group faces substantial debt risk with a distress-level Altman Z-score, despite strong operational cash flow. Regulatory and geopolitical risks are moderate for both but critical to monitor given their international footprints.
Which Stock to Choose?
Intuit Inc. (INTU) has shown a strong income evolution with a 15.63% revenue growth in the last year and favorable profitability metrics, including a 20.55% net margin and a 19.63% ROE. Its debt levels are moderate with a net debt to EBITDA of 0.64, supported by a very favorable rating of B and a global favorable financial ratios opinion.
Match Group, Inc. (MTCH) presents a mixed income evolution with a modest 3.41% revenue growth and a 15.84% net margin. Despite favorable ROIC and other ratios, it struggles with negative ROE (-865.98%) and high debt to assets (88.51%), though it holds a similar B rating and a favorable global ratios evaluation.
Considering ratings and overall income and financial ratios, INTU could appear more stable and profitable, while MTCH might appeal to investors tolerant of higher risk due to its volatile profitability and leverage. Growth-focused investors may find INTU’s consistent value creation attractive, whereas risk-tolerant investors might see MTCH’s potential despite its challenges.
Disclaimer: Investment carries a risk of loss of initial capital. The past performance is not a reliable indicator of future results. Be sure to understand risks before making an investment decision.
Go Further
I encourage you to read the complete analyses of Intuit Inc. and Match Group, Inc. to enhance your investment decisions: