Home > Comparison > Technology > IBM vs ORCL
The strategic rivalry between International Business Machines Corporation (IBM) and Oracle Corporation drives innovation in the technology sector. IBM operates as a diversified technology services provider, balancing software, consulting, and infrastructure. Oracle focuses on high-margin software infrastructure, cloud solutions, and enterprise applications. This analysis pits IBM’s broad-based model against Oracle’s specialized growth to identify the superior risk-adjusted investment for a diversified portfolio in 2026.
Table of contents
Companies Overview
International Business Machines Corporation and Oracle Corporation stand as titans in the global technology market, shaping enterprise IT solutions with distinct approaches.
International Business Machines Corporation: Integrated IT Solutions Leader
IBM dominates through its hybrid cloud platform and software solutions, leveraging acquisitions like Red Hat to drive its core revenue. Its strategic focus in 2026 centers on expanding hybrid cloud infrastructure and AI-driven software, while maintaining strong consulting and financing arms. This multi-segment approach underpins IBM’s position in integrated technology services.
Oracle Corporation: Cloud Software and Infrastructure Powerhouse
Oracle leads with a comprehensive cloud software-as-a-service portfolio, including Fusion cloud ERP and autonomous databases. In 2026, its strategy prioritizes cloud applications and infrastructure technologies, alongside hardware offerings tailored for enterprises. Oracle’s emphasis on cloud innovation and licensing services fuels its dominance in software infrastructure.
Strategic Collision: Similarities & Divergences
IBM and Oracle both target enterprise IT but diverge in their business philosophies. IBM embraces an open hybrid cloud ecosystem, balancing software, services, and infrastructure. Oracle opts for an integrated cloud software and infrastructure stack, focusing on proprietary solutions. Their primary battleground lies in cloud computing and enterprise software markets. Investors find distinct profiles: IBM offers diversified services with legacy strength, while Oracle emphasizes scalable cloud innovation.
Income Statement Comparison
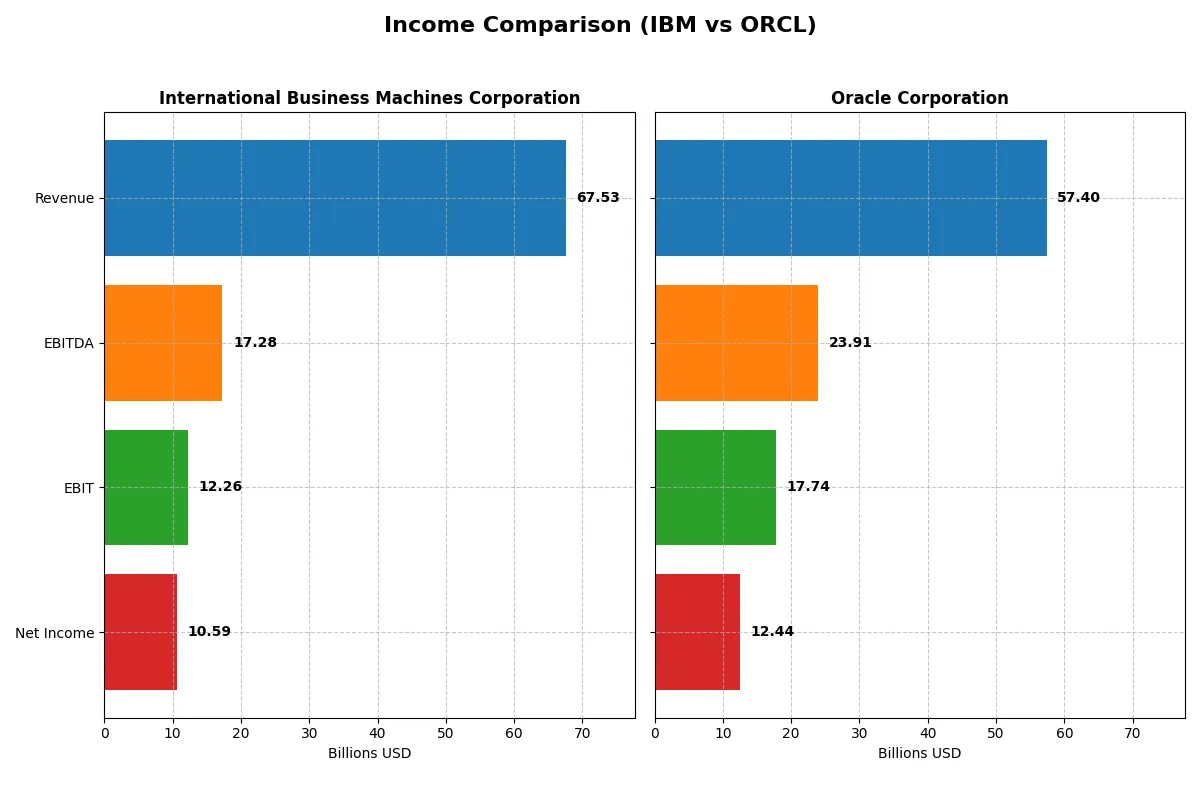
This data dissects the core profitability and scalability of both corporate engines to reveal who dominates the bottom line:
| Metric | International Business Machines Corporation (IBM) | Oracle Corporation (ORCL) |
|---|---|---|
| Revenue | 67.5B | 57.4B |
| Cost of Revenue | 27.4B | 16.9B |
| Operating Expenses | 29.9B | 22.8B |
| Gross Profit | 40.2B | 40.5B |
| EBITDA | 17.3B | 23.9B |
| EBIT | 12.3B | 17.7B |
| Interest Expense | 1.9B | 3.6B |
| Net Income | 10.6B | 12.4B |
| EPS | 11.36 | 4.46 |
| Fiscal Year | 2025 | 2025 |
Income Statement Analysis: The Bottom-Line Duel
This income statement comparison reveals which company operates its business with stronger efficiency and profitability under current market cycles.
International Business Machines Corporation (IBM) Analysis
IBM’s revenue rose steadily to $67.5B in 2025, with net income surging 76.7% year-over-year to $10.6B. Gross margin holds firm at 59.5%, while net margin expanded to 15.7%, signaling improved operational leverage. The 2025 results show robust earnings momentum despite moderate revenue growth, reflecting disciplined cost control and capital allocation.
Oracle Corporation (ORCL) Analysis
Oracle’s revenue climbed 8.4% to $57.4B in fiscal 2025, with net income reaching $12.4B, marking 9.7% net margin growth. Its superior gross margin of 70.5% and EBIT margin near 31% demonstrate strong profitability. However, net income fell nearly 9.5% over five years, indicating challenges in sustaining bottom-line growth despite revenue gains.
Margin Dominance vs. Bottom-Line Momentum
Oracle commands higher margins with a 21.7% net margin versus IBM’s 15.7%, showcasing operational efficiency. Yet, IBM’s net income growth of 84.5% over five years eclipses Oracle’s decline. For investors prioritizing earnings growth, IBM’s accelerating profitability may prove more attractive, while Oracle’s margin strength appeals to those valuing efficiency.
Financial Ratios Comparison
These vital ratios act as a diagnostic tool to expose the underlying fiscal health, valuation premiums, and capital efficiency of the companies compared below:
| Ratios | IBM (IBM) | Oracle (ORCL) |
|---|---|---|
| ROE | 22.1% | 60.8% |
| ROIC | 9.2% | 10.9% |
| P/E | 26.1 | 37.1 |
| P/B | 7.5 | 22.6 |
| Current Ratio | 1.04 | 0.75 |
| Quick Ratio | 1.00 | 0.75 |
| D/E (Debt-to-Equity) | 2.14 | 5.09 |
| Debt-to-Assets | 42.6% | 61.8% |
| Interest Coverage | 5.88 | 4.94 |
| Asset Turnover | – | 0.34 |
| Fixed Asset Turnover | – | 1.32 |
| Payout Ratio | 59.1% | 38.1% |
| Dividend Yield | 2.27% | 1.03% |
| Fiscal Year | 2025 | 2025 |
Efficiency & Valuation Duel: The Vital Signs
Ratios serve as a company’s DNA, exposing hidden risks and operational efficiency that raw numbers alone cannot reveal.
International Business Machines Corporation
IBM shows a moderate net margin at 15.7%, but zero return on equity and invested capital raise concerns about profitability efficiency. Its P/E ratio at 26.1 suggests a somewhat stretched valuation relative to earnings. The firm supports shareholders with a 2.3% dividend yield, balancing capital returns despite reinvestment questions.
Oracle Corporation
Oracle excels with a strong 21.7% net margin and an outstanding 60.8% return on equity, signaling operational excellence. However, its P/E ratio at 37.1 and a high P/B ratio of 22.6 indicate an expensive stock. Oracle’s modest 1.0% dividend yield suggests a growth-focused reinvestment strategy rather than immediate shareholder returns.
Premium Valuation vs. Operational Safety
IBM offers a more balanced valuation with steady dividends but weaker profitability metrics. Oracle delivers superior profitability but at a premium price and higher financial leverage. Investors seeking growth may prefer Oracle’s profile, while those favoring income and valuation discipline might lean toward IBM.
Which one offers the Superior Shareholder Reward?
I see IBM offers a 2.27% dividend yield with a high 59% payout ratio, well-covered by free cash flow at 2.1x. IBM also executes significant buybacks, enhancing shareholder returns. Oracle yields only 1.03% with a 38% payout ratio and negative free cash flow, signaling less sustainable dividends. Oracle reinvests aggressively in growth, but high debt and weak buybacks limit near-term rewards. Historically, IBM’s balanced distribution and buyback strategy deliver a more attractive total return profile in 2026. I favor IBM for superior, sustainable shareholder reward.
Comparative Score Analysis: The Strategic Profile
The radar chart reveals the fundamental DNA and trade-offs of International Business Machines Corporation and Oracle Corporation:
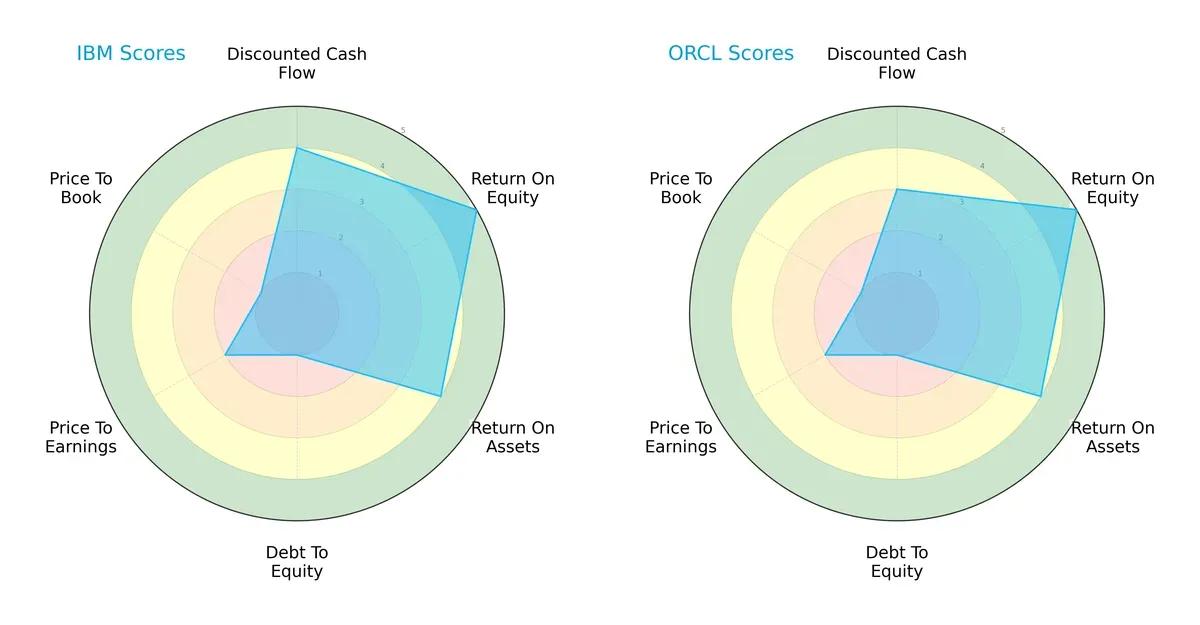
IBM and Oracle share a balanced profile with identical overall scores of 3. IBM edges Oracle slightly on discounted cash flow (4 vs. 3), signaling better future cash flow expectations. Both deliver strong return on equity (5) and return on assets (4), reflecting efficient profitability and asset utilization. Their debt-to-equity scores are alarmingly low (1), indicating high leverage risk. Valuation scores (P/E and P/B) remain moderate to unfavorable for both, suggesting cautious price appreciation potential.
Bankruptcy Risk: Solvency Showdown
IBM’s Altman Z-Score of 3.54 places it firmly in the safe zone, while Oracle’s 2.28 situates it in the grey zone, signaling higher bankruptcy risk:
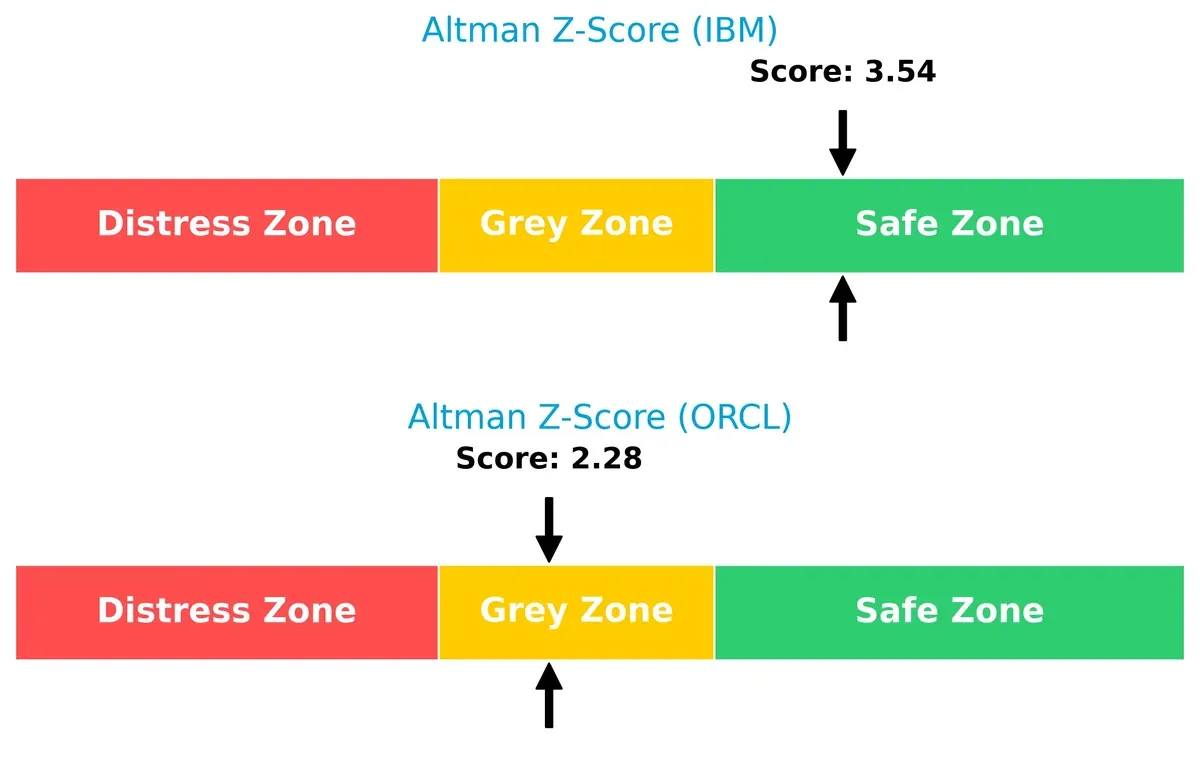
IBM demonstrates stronger financial resilience for long-term survival amid economic cycles. Oracle’s moderate distress signals warrant close monitoring, especially given their comparable leverage profiles.
Financial Health: Quality of Operations
Both IBM and Oracle score 5 on the Piotroski F-Score, reflecting average financial health with no immediate red flags:
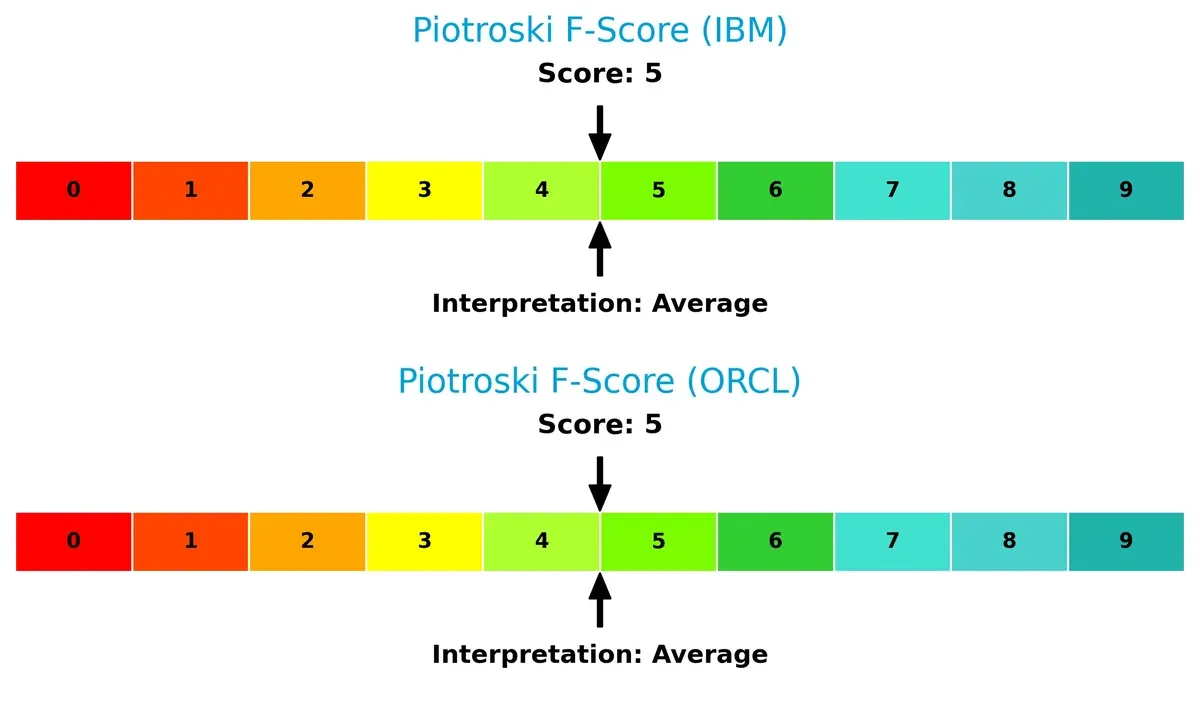
Neither company shows peak operational strength, but neither raises significant internal concerns. Investors should watch for improvements in profitability and efficiency metrics to confirm sustainable quality.
How are the two companies positioned?
This section dissects the operational DNA of IBM and ORCL by comparing their revenue distribution and internal dynamics, including strengths and weaknesses. The goal is to confront their economic moats to identify which model offers the most resilient, sustainable competitive advantage today.
Revenue Segmentation: The Strategic Mix
This visual comparison dissects how International Business Machines Corporation and Oracle Corporation diversify their income streams and where their primary sector bets lie:
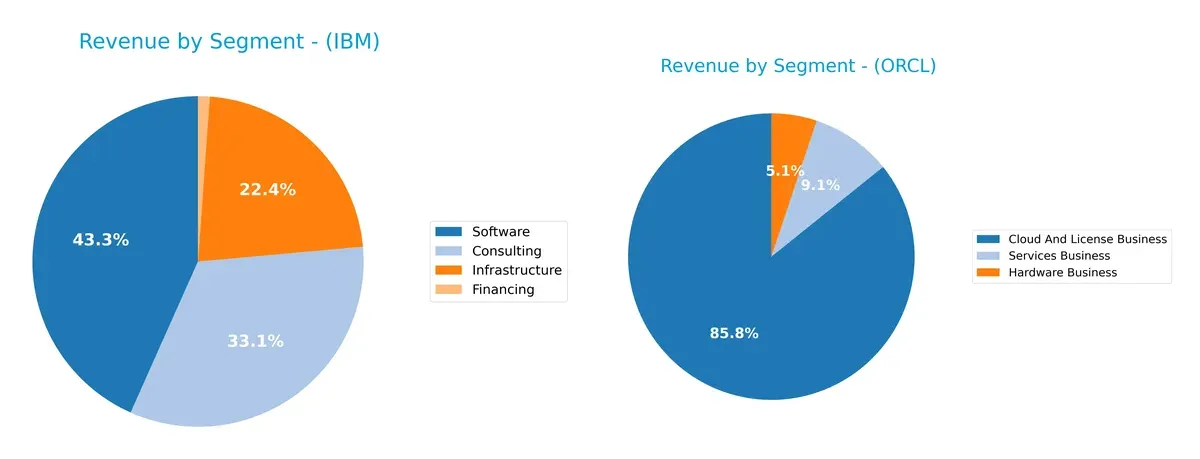
IBM displays a balanced revenue mix with Software at $27B and Consulting at $20.7B, complemented by $14B in Infrastructure. Oracle’s revenue pivots heavily on Cloud and License Business, which dwarfs its $4.9B Hardware and $5.2B Services segments. IBM’s diversified approach reduces concentration risk, while Oracle’s focus on cloud licenses anchors its ecosystem dominance but elevates dependency on a single segment.
Strengths and Weaknesses Comparison
This table compares the Strengths and Weaknesses of IBM and Oracle based on diversification, profitability, financials, innovation, global presence, and market share:
IBM Strengths
- Diversified revenue streams including Software, Consulting, and Infrastructure
- Favorable net margin at 15.69%
- Strong interest coverage at 6.34x
- Lower debt-to-assets ratio indicating financial prudence
- Broad global presence with significant Americas and EMEA revenues
Oracle Strengths
- Higher net margin at 21.68% and ROE at 60.84% indicating strong profitability
- Positive ROIC at 10.86% above WACC
- Large Cloud and License Business revenue dominance
- Consistent global presence in Americas, EMEA, and Asia Pacific
- Strong market share in cloud and license sectors
IBM Weaknesses
- Zero ROE and ROIC indicate operational inefficiencies
- Unfavorable liquidity ratios (current and quick ratios at 0) pose short-term risks
- Unavailable WACC limits capital cost assessment
- Weak asset turnover ratios suggest lower operational efficiency
- PE ratio of 26.07 considered unfavorable
Oracle Weaknesses
- Higher debt-to-assets ratio at 61.83% increases financial risk
- Unfavorable PE and PB ratios indicate valuation concerns
- Current and quick ratios below 1 signal liquidity constraints
- Interest coverage ratio neutral at 4.96x, lower than IBM
- Asset turnover and fixed asset turnover weak or neutral
Overall, IBM exhibits a balanced revenue diversification and solid financial stability with conservative leverage, though operational efficiency and liquidity remain concerns. Oracle shows superior profitability metrics and strong market focus but carries higher leverage and liquidity risks. Each company’s financial profile suggests distinct strategic priorities in managing growth and risk.
The Moat Duel: Analyzing Competitive Defensibility
A structural moat alone shields long-term profits from relentless competition erosion. Let’s dissect how IBM and Oracle protect their turf:
International Business Machines Corporation (IBM): Hybrid Cloud & Consulting Expertise
IBM’s moat stems from its integrated hybrid cloud platform and consulting services, yielding stable margins and 15.7% net margin in 2025. However, its declining ROIC trend signals pressure on capital efficiency. Expansion in AI-driven automation could either deepen or strain its moat in 2026.
Oracle Corporation (ORCL): Database Dominance & Cloud Ecosystem
Oracle leverages strong network effects in database technology and cloud infrastructure, reflected in a superior 21.7% net margin and 30.9% EBIT margin. Despite a slightly unfavorable ROIC versus WACC and declining ROIC, Oracle’s cloud SaaS growth offers a promising runway for moat reinforcement and market disruption.
The Moat Face-off: Hybrid Cloud Integration vs. Database Ecosystem Lock-in
Oracle’s higher margins and entrenched database ecosystem suggest a wider moat than IBM’s hybrid cloud consulting model. Yet both face declining capital returns, placing Oracle in a stronger position to defend and expand market share in 2026.
Which stock offers better returns?
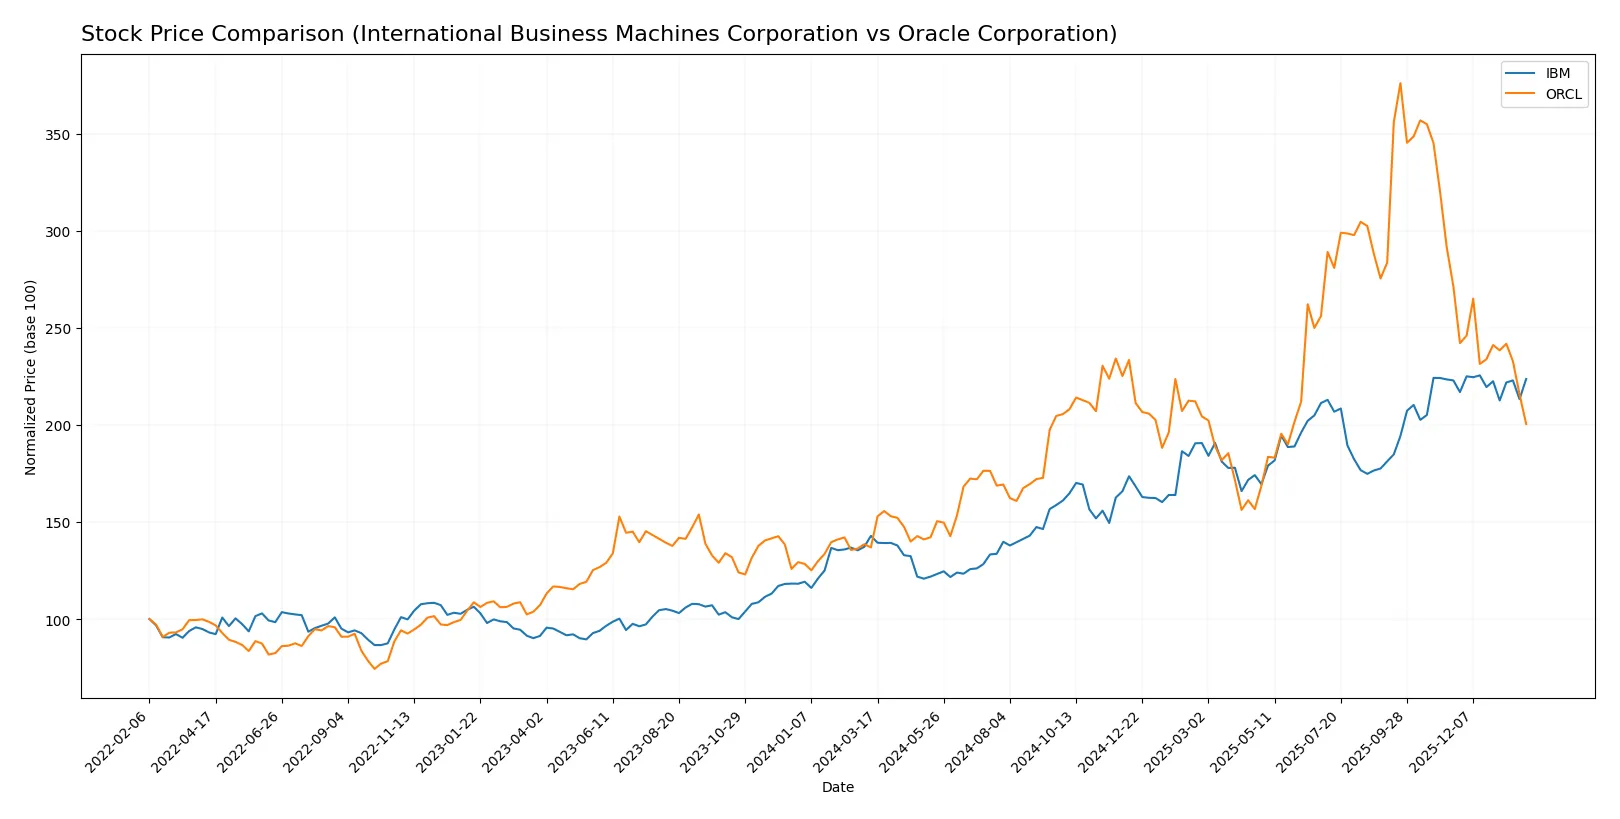
Over the past 12 months, IBM and Oracle showed significant price appreciation, but recent trading dynamics reveal diverging momentum and buyer-seller dominance patterns.
Trend Comparison
IBM’s stock gained 56.52% over the past year, marking a bullish trend with decelerating acceleration. The price ranged from 165.71 to 309.24, showing high volatility (43.36 std dev).
Oracle’s stock increased 46.4% over the year, also bullish but with deceleration. It experienced wider volatility (48.15 std dev) and a low of 112.42, with a high near 308.66.
Comparing trends, IBM outperformed Oracle by 10.12 percentage points over 12 months, delivering the highest market performance despite recent neutral short-term movement.
Target Prices
Analysts present a robust target price consensus for IBM and Oracle, reflecting strong confidence in both names.
| Company | Target Low | Target High | Consensus |
|---|---|---|---|
| International Business Machines Corporation | 304 | 380 | 349.5 |
| Oracle Corporation | 175 | 400 | 310.33 |
The target consensus for IBM at 349.5 sits well above its current 307 price, indicating upside potential. Oracle’s consensus of 310.33 also substantially exceeds its 165 stock price, suggesting significant market optimism.

Don’t Let Luck Decide Your Entry Point
Optimize your entry points with our advanced ProRealTime indicators. You’ll get efficient buy signals with precise price targets for maximum performance. Start outperforming now!
How do institutions grade them?
Here are the latest institutional grades for International Business Machines Corporation and Oracle Corporation:
International Business Machines Corporation Grades
This table summarizes recent grades from major financial institutions for IBM:
| Grading Company | Action | New Grade | Date |
|---|---|---|---|
| Wedbush | Maintain | Outperform | 2026-01-29 |
| RBC Capital | Maintain | Outperform | 2026-01-29 |
| Stifel | Maintain | Buy | 2026-01-29 |
| JP Morgan | Maintain | Neutral | 2026-01-29 |
| UBS | Maintain | Sell | 2026-01-29 |
| Evercore ISI Group | Maintain | Outperform | 2026-01-29 |
| Jefferies | Maintain | Buy | 2026-01-29 |
| JP Morgan | Maintain | Neutral | 2026-01-21 |
| Evercore ISI Group | Maintain | Outperform | 2026-01-20 |
| B of A Securities | Maintain | Buy | 2026-01-13 |
Oracle Corporation Grades
This table captures the most recent institutional grades for Oracle:
| Grading Company | Action | New Grade | Date |
|---|---|---|---|
| Morgan Stanley | Maintain | Equal Weight | 2026-01-23 |
| UBS | Maintain | Buy | 2026-01-05 |
| Jefferies | Maintain | Buy | 2026-01-05 |
| RBC Capital | Maintain | Sector Perform | 2026-01-05 |
| Goldman Sachs | Maintain | Neutral | 2025-12-12 |
| UBS | Maintain | Buy | 2025-12-11 |
| Piper Sandler | Maintain | Overweight | 2025-12-11 |
| Keybanc | Maintain | Overweight | 2025-12-11 |
| Stifel | Maintain | Buy | 2025-12-11 |
| JP Morgan | Maintain | Neutral | 2025-12-11 |
Which company has the best grades?
IBM consistently receives higher grades such as Outperform and Buy from multiple firms, while Oracle’s grades cluster around Buy and Neutral. IBM’s stronger consensus may indicate greater confidence from analysts, potentially attracting more investor interest.
Risks specific to each company
The following categories identify the critical pressure points and systemic threats facing both firms in the 2026 market environment:
1. Market & Competition
International Business Machines Corporation
- Faces intense competition in hybrid cloud and AI services, requiring constant innovation to maintain relevance.
Oracle Corporation
- Operates in a highly competitive cloud software market, pressured by rapid technological shifts and strong peers.
2. Capital Structure & Debt
International Business Machines Corporation
- Exhibits a favorable debt profile with strong interest coverage and low leverage, reducing financial risk.
Oracle Corporation
- Carries high debt levels with unfavorable debt-to-equity and debt-to-assets ratios, increasing financial vulnerability.
3. Stock Volatility
International Business Machines Corporation
- Shows low beta (0.698), indicating less price volatility and more stable stock performance.
Oracle Corporation
- Has significantly higher beta (1.651), exposing shareholders to increased market risk and price swings.
4. Regulatory & Legal
International Business Machines Corporation
- Operates under strict data security and privacy regulations across diverse global markets, posing compliance costs.
Oracle Corporation
- Faces regulatory scrutiny in cloud services and database licensing, with ongoing litigation risks in various jurisdictions.
5. Supply Chain & Operations
International Business Machines Corporation
- Relies on complex hybrid cloud infrastructure, sensitive to supply disruptions and technology integration challenges.
Oracle Corporation
- Depends on seamless software delivery and hardware support, vulnerable to component shortages and operational delays.
6. ESG & Climate Transition
International Business Machines Corporation
- Advances sustainability in data centers and promotes social governance, aligning with growing investor ESG demands.
Oracle Corporation
- ESG initiatives are developing but face pressure to meet increasing environmental and social responsibility standards.
7. Geopolitical Exposure
International Business Machines Corporation
- Global operations expose it to geopolitical tensions, especially in US-China tech relations affecting supply chains.
Oracle Corporation
- Also globally exposed with reliance on international clients, sensitive to tariffs, sanctions, and political instability.
Which company shows a better risk-adjusted profile?
IBM’s strongest risk lies in fierce market competition, yet its conservative capital structure and low stock volatility anchor its stability. Oracle’s most pressing risk is its heavy debt burden, which elevates financial risk amid volatile stock behavior. IBM’s safer debt profile and lower beta suggest a better risk-adjusted position in 2026, despite competitive pressures. Oracle’s high leverage and market volatility warrant cautious risk management.
Final Verdict: Which stock to choose?
International Business Machines Corporation (IBM) demonstrates a superpower in steady operational cash flow and disciplined capital allocation, underpinning its role as a resilient cash machine. Its point of vigilance lies in a somewhat constrained liquidity profile, which could challenge short-term flexibility. IBM suits portfolios targeting stable income with measured growth, particularly those favoring value-oriented plays.
Oracle Corporation (ORCL) boasts a strategic moat through its dominant position in cloud infrastructure and recurring revenue streams, fueling robust profitability. Relative to IBM, it presents higher risk due to elevated leverage and valuation premiums but offers growth potential backed by innovation. ORCL fits investors seeking Growth at a Reasonable Price (GARP) with a tolerance for market volatility.
If you prioritize stable cash generation and a conservative risk profile, IBM is the compelling choice due to its operational resilience and income reliability. However, if you seek growth driven by cloud dominance and can withstand valuation pressures, Oracle offers superior expansion prospects despite its leverage concerns. Both cases require careful risk management given their contrasting financial structures.
Disclaimer: Investment carries a risk of loss of initial capital. The past performance is not a reliable indicator of future results. Be sure to understand risks before making an investment decision.
Go Further
I encourage you to read the complete analyses of International Business Machines Corporation and Oracle Corporation to enhance your investment decisions: