Home > Comparison > Technology > IBM vs LDOS
The strategic rivalry between International Business Machines Corporation (IBM) and Leidos Holdings, Inc. shapes the competitive landscape of the technology services sector. IBM operates as a diversified technology powerhouse, blending software, consulting, and infrastructure services. In contrast, Leidos focuses on specialized defense and government IT solutions. This analysis will evaluate which company’s distinct business model offers a superior risk-adjusted return for a diversified portfolio navigating evolving technological demands.
Table of contents
Companies Overview
International Business Machines Corporation and Leidos Holdings, Inc. stand as pivotal players in the technology services sector with distinct market roles.
International Business Machines Corporation: Hybrid Cloud and Enterprise IT Leader
IBM operates as a global technology services giant specializing in integrated solutions. Its core revenue stems from software, consulting, infrastructure, and financing services, with a strong emphasis on hybrid cloud platforms and AI-driven software. In 2026, IBM strategically focuses on expanding its hybrid cloud ecosystem and accelerating AI integration across industries.
Leidos Holdings, Inc.: Defense and Government IT Solutions Specialist
Leidos commands a critical niche as a defense and intelligence services provider serving U.S. government sectors and allies. Its revenue engine revolves around national security solutions, systems integration, and health IT services. In 2026, Leidos concentrates on enhancing cybersecurity, cloud modernization, and digital transformation within defense and civil markets.
Strategic Collision: Similarities & Divergences
Both companies excel in technology services but diverge in philosophy: IBM pursues an open hybrid cloud platform while Leidos emphasizes specialized government and defense contracts. Their competition centers on IT modernization and cybersecurity solutions. IBM’s broader enterprise approach contrasts with Leidos’s focused government segment, defining unique investment profiles with differing risk and growth dynamics.
Income Statement Comparison
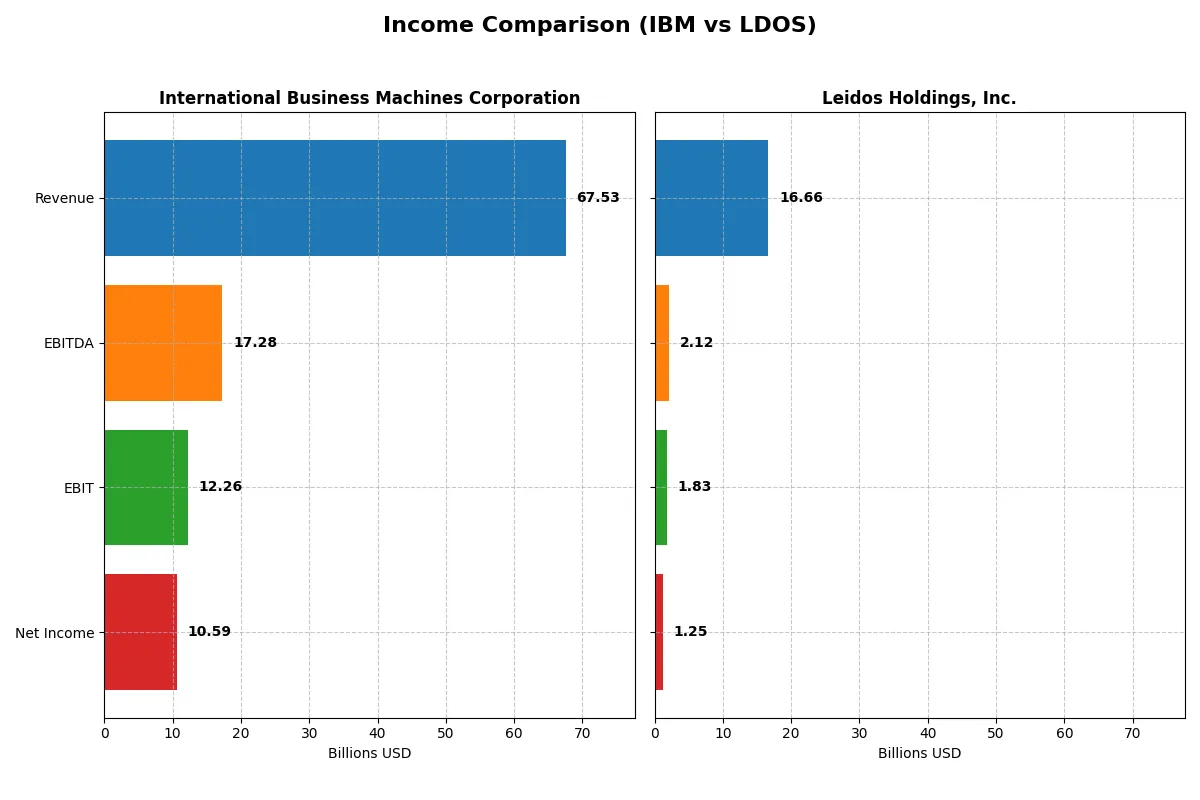
This data dissects the core profitability and scalability of both corporate engines to reveal who dominates the bottom line:
| Metric | International Business Machines Corporation (IBM) | Leidos Holdings, Inc. (LDOS) |
|---|---|---|
| Revenue | 67.5B | 16.7B |
| Cost of Revenue | 27.4B | 13.9B |
| Operating Expenses | 29.9B | 971M |
| Gross Profit | 40.2B | 2.8B |
| EBITDA | 17.3B | 2.1B |
| EBIT | 12.3B | 1.8B |
| Interest Expense | 1.9B | 193M |
| Net Income | 10.6B | 1.3B |
| EPS | 11.36 | 9.36 |
| Fiscal Year | 2025 | 2024 |
Income Statement Analysis: The Bottom-Line Duel
This income statement comparison reveals how efficiently IBM and Leidos convert revenue into profit amid evolving market conditions.
International Business Machines Corporation Analysis
IBM’s revenue steadily climbs, reaching $67.5B in 2025, with net income surging to $10.6B, reflecting strong momentum. Its gross margin holds firm at 59.5%, while the net margin improves to 15.7%. Operational efficiency shines with EBIT growth of 63% year-over-year, signaling robust profitability expansion despite increased operating expenses.
Leidos Holdings, Inc. Analysis
Leidos grows revenue to $16.7B in fiscal 2024, nearly doubling net income to $1.25B from prior years. Gross margin remains modest at 16.8%, but net margin advances to 7.5%. EBIT skyrockets 198% year-over-year, driven by disciplined expense management and favorable cost control, highlighting a rapid improvement in operational leverage.
Margin Strength vs. Growth Trajectory
IBM delivers superior margin quality and higher absolute profits, underpinned by a broad revenue base and consistent margin expansion. Leidos impresses with faster margin improvement and earnings growth percentages, though on a smaller scale. For investors, IBM’s profile offers stable, high-margin cash flow, while Leidos presents a growth-oriented opportunity with accelerating profitability.
Financial Ratios Comparison
These vital ratios act as a diagnostic tool to expose the underlying fiscal health, valuation premiums, and capital efficiency of the companies compared below:
| Ratios | International Business Machines Corporation (IBM) | Leidos Holdings, Inc. (LDOS) |
|---|---|---|
| ROE | 22.1% (2024) | 28.4% (2024) |
| ROIC | 9.2% (2024) | 13.9% (2024) |
| P/E | 34.2 (2024) | 15.7 (2024) |
| P/B | 7.54 (2024) | 4.47 (2024) |
| Current Ratio | 1.04 (2024) | 1.21 (2024) |
| Quick Ratio | 1.00 (2024) | 1.13 (2024) |
| D/E | 2.14 (2024) | 1.20 (2024) |
| Debt-to-Assets | 42.6% (2024) | 40.4% (2024) |
| Interest Coverage | 5.88 (2024) | 9.47 (2024) |
| Asset Turnover | 0.46 (2024) | 1.27 (2024) |
| Fixed Asset Turnover | 7.03 (2024) | 10.74 (2024) |
| Payout ratio | 102% (2024) | 16.6% (2024) |
| Dividend yield | 2.98% (2024) | 1.05% (2024) |
| Fiscal Year | 2024 | 2024 |
Efficiency & Valuation Duel: The Vital Signs
Financial ratios serve as a company’s DNA, exposing hidden risks and operational strengths critical for investor scrutiny.
International Business Machines Corporation
IBM posts a solid net margin of 15.7%, signaling operational efficiency despite zero reported ROE and ROIC, which raises concerns about capital returns. Its P/E of 26.1 suggests the stock is stretched relative to earnings. The company offers a 2.27% dividend yield, rewarding shareholders amid limited reinvestment data.
Leidos Holdings, Inc.
Leidos commands a favorable ROE of 28.4% and a strong ROIC of 13.9%, reflecting efficient capital use. Its P/E stands at a neutral 15.7, indicating reasonable valuation. While dividends yield a modest 1.05%, the firm supports growth with robust asset turnover and solid interest coverage ratios.
Operational Efficiency Meets Valuation Discipline
Leidos balances attractive profitability with moderate valuation and efficient asset use, presenting a compelling risk-reward profile. IBM’s operational margins impress, but zero returns on equity and a stretched P/E flag caution. Growth-oriented investors may prefer Leidos’ capital efficiency, while income seekers might focus on IBM’s dividend yield.
Which one offers the Superior Shareholder Reward?
I compare International Business Machines Corporation (IBM) and Leidos Holdings, Inc. (LDOS) on dividend yields, payout ratios, and buybacks. IBM yields 2.3%–4.9% with a high payout ratio near 60%, backed by strong free cash flow coverage (2.1x). IBM also maintains consistent buybacks, enhancing total returns. LDOS pays a modest 1.1% yield with a low payout ratio around 16%, retaining cash for growth and acquisitions. Its buyback program is less aggressive but supported by solid free cash flow. Historically, IBM’s high yield and buybacks offer more immediate shareholder reward. LDOS’s reinvestment strategy targets longer-term growth but risks lower near-term payouts. I find IBM’s distribution model more sustainable and attractive for total return in 2026.
Comparative Score Analysis: The Strategic Profile
The radar chart reveals the fundamental DNA and trade-offs of both IBM and Leidos Holdings, highlighting their strategic financial profiles side by side:
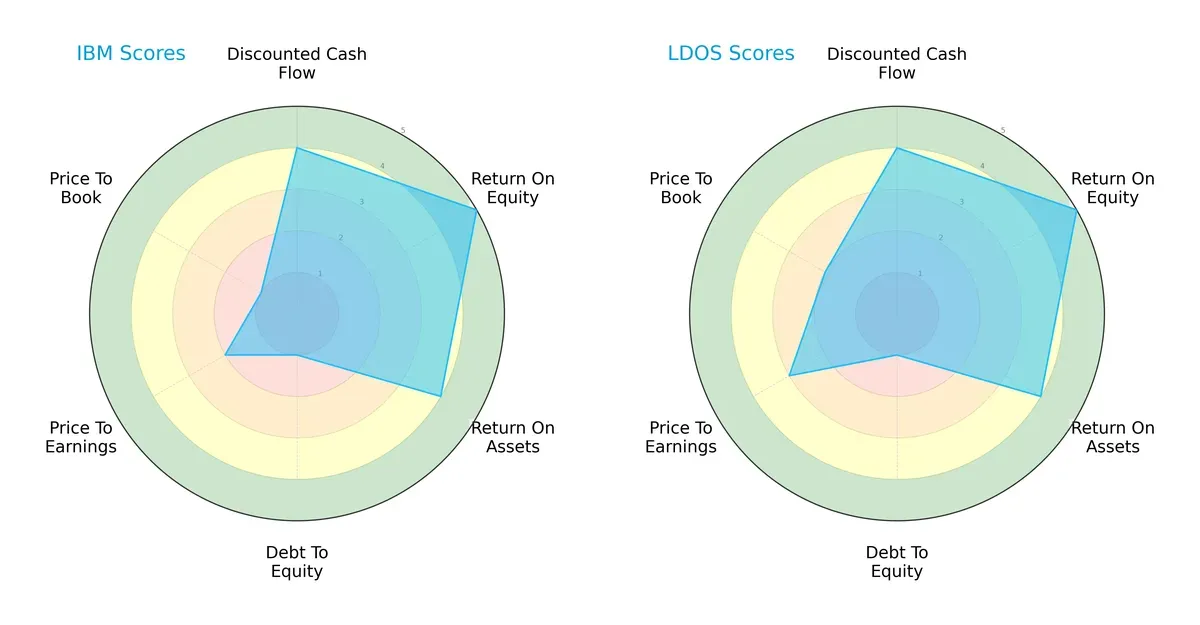
Both companies share strong discounted cash flow and profitability metrics, scoring 4 in DCF and 5 in ROE, signaling efficient capital use. Their asset utilization is equally solid at a score of 4. However, both suffer from very unfavorable debt-to-equity scores of 1, indicating elevated financial leverage risks. Leidos edges IBM on valuation metrics (P/E and P/B), suggesting it may be a slightly better value play. Overall, Leidos presents a more balanced scorecard, while IBM relies heavily on operational efficiency despite valuation and leverage weaknesses.
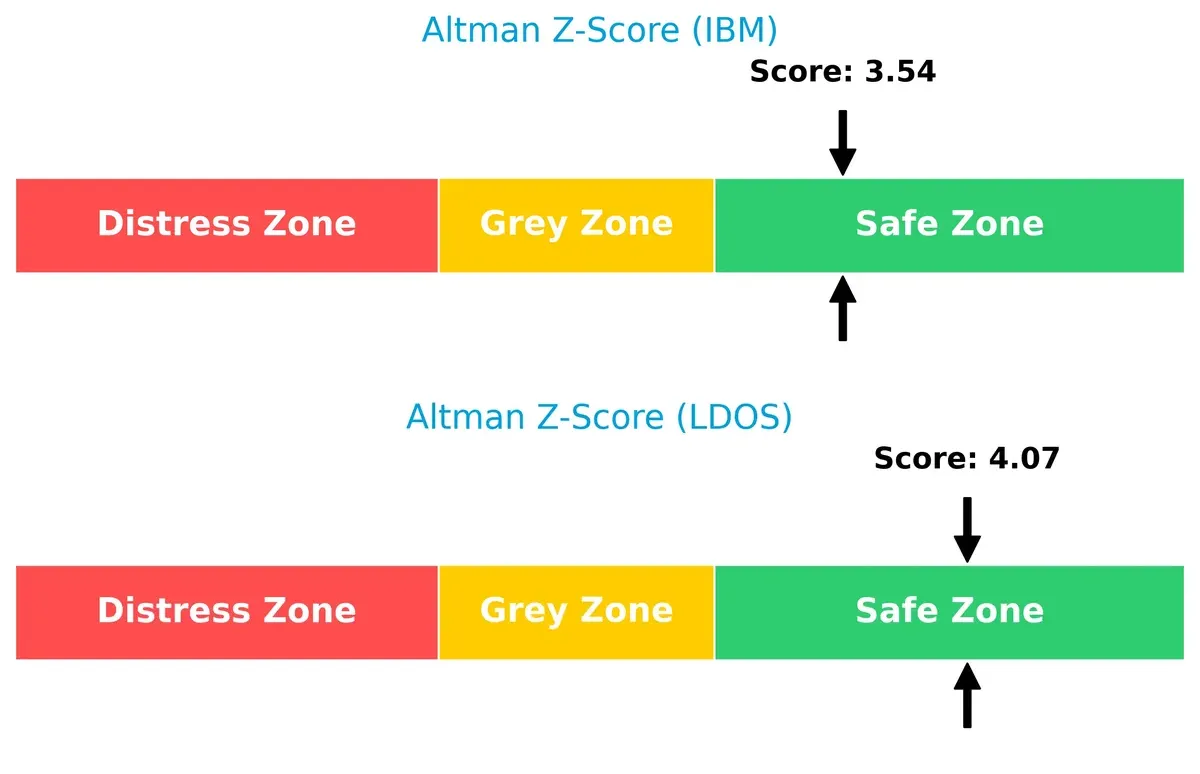
Bankruptcy Risk: Solvency Showdown
Leidos’ Altman Z-Score of 4.07 surpasses IBM’s 3.54, placing both safely above distress thresholds but giving Leidos a clearer margin for long-term survival in this cycle:
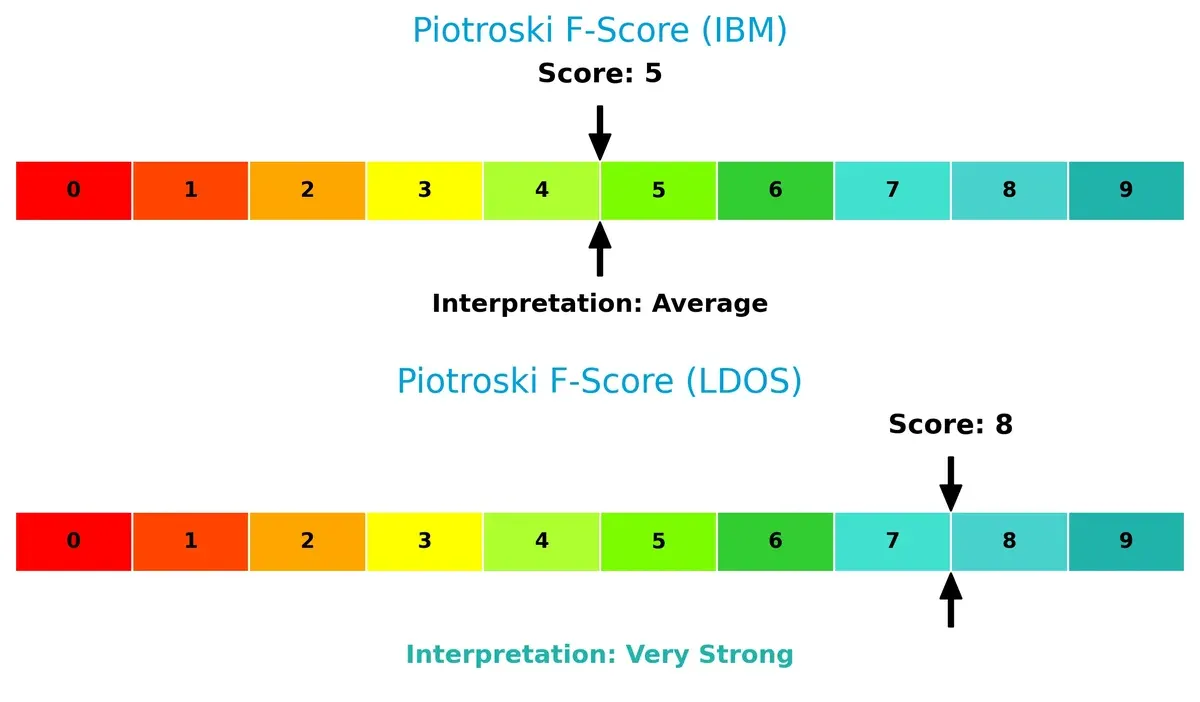
Financial Health: Quality of Operations
Leidos outperforms IBM with a Piotroski F-Score of 8 versus 5, signaling stronger internal financial health and operational quality. IBM’s average score raises caution on its internal metrics compared to Leidos’ very strong standing:
How are the two companies positioned?
This section dissects IBM and LDOS’s operational DNA by comparing revenue distribution and internal strengths and weaknesses. The goal is to confront their economic moats to reveal which model offers the most resilient, sustainable advantage today.
Revenue Segmentation: The Strategic Mix
This visual comparison dissects how International Business Machines Corporation and Leidos Holdings, Inc. diversify their income streams and where their primary sector bets lie:
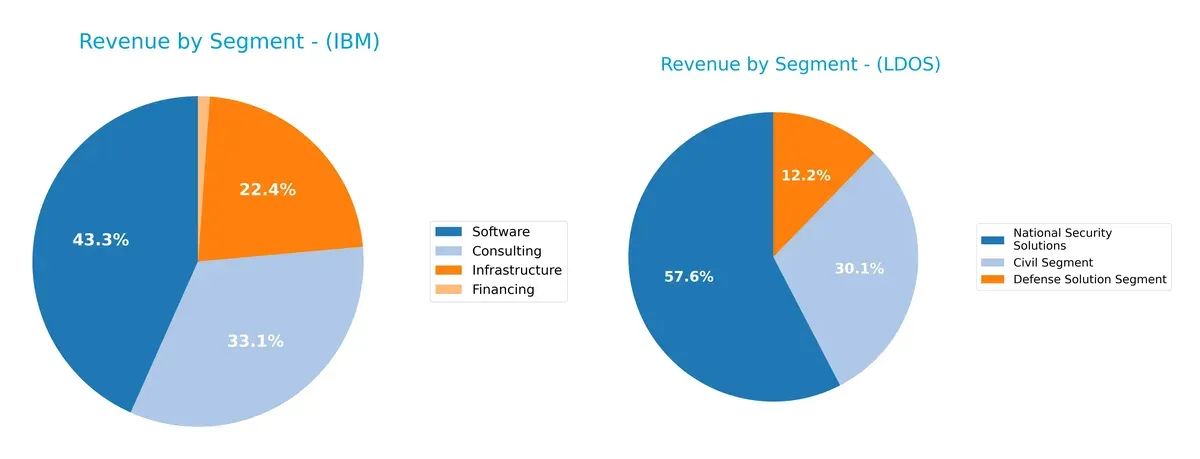
IBM’s revenue mix anchors heavily on Software at $27B and Consulting at $20.7B, showing a strong focus on high-margin, service-based offerings. Leidos pivots around National Security Solutions with $9.55B, but also draws $5B from Civil and $2B from Defense segments, reflecting a more balanced but defense-centric portfolio. IBM’s concentration in software signals ecosystem lock-in, while Leidos faces typical sector concentration risk with government contracts dominating.
Strengths and Weaknesses Comparison
This table compares the strengths and weaknesses of IBM and LDOS based on diversification, profitability, financials, innovation, global presence, and market share:
IBM Strengths
- Diverse revenue streams across software, consulting, infrastructure, and financing
- Strong net margin at 15.69%
- Favorable debt-to-equity and interest coverage ratios
- Global presence with significant Americas, EMEA, and Asia Pacific sales
LDOS Strengths
- Strong ROE at 28.42% and ROIC at 13.85% exceeding WACC of 5.93%
- Favorable asset turnover and fixed asset turnover ratios
- Healthy quick ratio and interest coverage
- Focused segments in defense, civil, and health with growing revenue
IBM Weaknesses
- Zero ROE and ROIC indicate weak capital efficiency
- Unfavorable current and quick ratios imply liquidity concerns
- High P/E ratio of 26.07 suggests overvaluation risk
- Asset turnover ratios unfavorable, signaling operational inefficiency
LDOS Weaknesses
- Higher debt-to-equity ratio at 1.2 implies leverage risk
- Unfavorable price-to-book ratio at 4.47
- Net margin modest at 7.53% with some neutral financial ratios
- Concentrated US revenue with limited international diversification
IBM shows strength in diversification and stable profitability but struggles with liquidity and capital returns. LDOS delivers superior capital efficiency and operational metrics but faces risks from leverage and limited geographic reach. Each company’s profile highlights distinct strategic challenges and competitive positioning.
The Moat Duel: Analyzing Competitive Defensibility
A structural moat is the only shield preserving long-term profits from relentless competitive pressure. Here’s how IBM and Leidos stack up:
IBM: Intangible Assets Powerhouse
IBM’s moat stems from its extensive intangible assets, including hybrid cloud and AI software. This drives margin stability and strong EBIT margins near 18%. Yet, declining ROIC signals risks to its competitive edge in 2026.
Leidos: Defense Sector Cost Advantage
Leidos leverages cost advantages and specialized defense contracts, reflected in growing ROIC and rapidly improving net margins. Its expanding government and health segments position it for durable gains and market disruption.
Verdict: Intangible Assets vs. Cost Leadership
Leidos boasts the deeper moat with a 7.9% ROIC premium over WACC and rising profitability. IBM’s intangible assets remain valuable but face erosion from declining capital returns. Leidos is better positioned to defend and grow market share.
Which stock offers better returns?
The past year shows strong price gains for both stocks, with notable highs and a decelerating upward momentum in their trends.
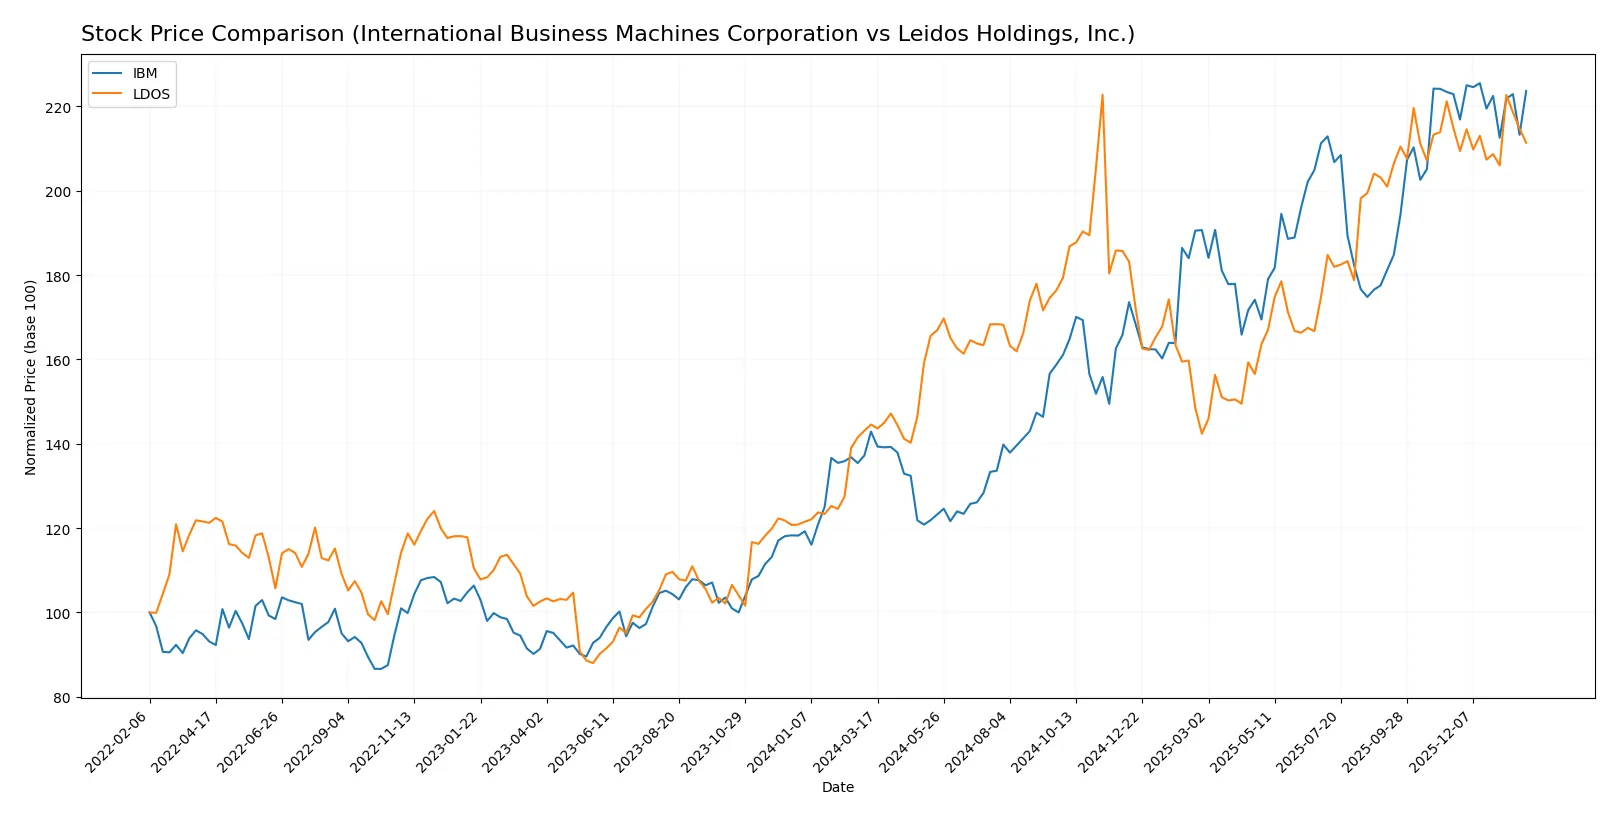
Trend Comparison
International Business Machines Corporation (IBM) posted a 56.52% price increase over 12 months, signaling a bullish trend with decelerating momentum and a high volatility level (std dev 43.36). The recent period shows a neutral 0.33% change with slight downward slope.
Leidos Holdings, Inc. (LDOS) gained 46.23% over the same period, also bullish but with deceleration and lower volatility (std dev 20.68). The recent trend is neutral to slightly bearish at -1.64%, though the slope indicates minor upward pressure.
Comparing both, IBM delivered the highest market performance over 12 months with larger gains and volatility, while LDOS showed solid but more moderate appreciation.
Target Prices
Analysts present a robust target consensus for IBM and Leidos Holdings, reflecting optimism in their growth trajectories.
| Company | Target Low | Target High | Consensus |
|---|---|---|---|
| International Business Machines Corporation | 304 | 380 | 349.5 |
| Leidos Holdings, Inc. | 204 | 230 | 219.8 |
The consensus targets exceed current prices—IBM trades near 307 USD, signaling ~14% upside potential. Leidos, at 188 USD, implies a ~17% gain, showing strong analyst confidence.

Don’t Let Luck Decide Your Entry Point
Optimize your entry points with our advanced ProRealTime indicators. You’ll get efficient buy signals with precise price targets for maximum performance. Start outperforming now!
How do institutions grade them?
International Business Machines Corporation Grades
The table below shows recent grades assigned by reputable institutions:
| Grading Company | Action | New Grade | Date |
|---|---|---|---|
| Wedbush | Maintain | Outperform | 2026-01-29 |
| RBC Capital | Maintain | Outperform | 2026-01-29 |
| Stifel | Maintain | Buy | 2026-01-29 |
| JP Morgan | Maintain | Neutral | 2026-01-29 |
| UBS | Maintain | Sell | 2026-01-29 |
| Evercore ISI Group | Maintain | Outperform | 2026-01-29 |
| Jefferies | Maintain | Buy | 2026-01-29 |
| JP Morgan | Maintain | Neutral | 2026-01-21 |
| Evercore ISI Group | Maintain | Outperform | 2026-01-20 |
| B of A Securities | Maintain | Buy | 2026-01-13 |
Leidos Holdings, Inc. Grades
The table below presents recent credible grading actions by well-known firms:
| Grading Company | Action | New Grade | Date |
|---|---|---|---|
| UBS | Maintain | Neutral | 2026-01-15 |
| Citigroup | Maintain | Buy | 2026-01-13 |
| Stifel | Downgrade | Hold | 2026-01-08 |
| B of A Securities | Maintain | Buy | 2025-11-07 |
| Truist Securities | Maintain | Buy | 2025-11-05 |
| UBS | Maintain | Neutral | 2025-11-05 |
| Cantor Fitzgerald | Maintain | Overweight | 2025-10-31 |
| Argus Research | Maintain | Buy | 2025-09-24 |
| RBC Capital | Upgrade | Outperform | 2025-09-04 |
| B of A Securities | Maintain | Buy | 2025-09-04 |
Which company has the best grades?
International Business Machines Corporation holds stronger consensus with multiple “Outperform” and “Buy” ratings from top firms. Leidos Holdings has mixed grades including a recent downgrade. This divergence may influence investor confidence and portfolio positioning.
Risks specific to each company
The following categories identify critical pressure points and systemic threats facing International Business Machines Corporation (IBM) and Leidos Holdings, Inc. amid the 2026 market environment:
1. Market & Competition
International Business Machines Corporation
- Faces intense competition in hybrid cloud and AI sectors; legacy business segments under pressure.
Leidos Holdings, Inc.
- Operates in defense and civil IT markets with strong government contracts but exposed to budget shifts.
2. Capital Structure & Debt
International Business Machines Corporation
- Favorable debt-to-assets ratio but very unfavorable debt-to-equity score signals reliance on debt.
Leidos Holdings, Inc.
- Higher debt-to-equity ratio and neutral debt-to-assets; interest coverage strong but leverage remains a risk.
3. Stock Volatility
International Business Machines Corporation
- Beta of 0.698 indicates moderate sensitivity to market swings, offering relative stability.
Leidos Holdings, Inc.
- Lower beta of 0.592 denotes less volatility, appealing for risk-averse investors.
4. Regulatory & Legal
International Business Machines Corporation
- Subject to global data privacy and security regulations impacting software and consulting segments.
Leidos Holdings, Inc.
- Faces complex defense procurement rules and potential export controls affecting international contracts.
5. Supply Chain & Operations
International Business Machines Corporation
- Hybrid cloud infrastructure depends on hardware supply chains vulnerable to geopolitical tensions.
Leidos Holdings, Inc.
- Operational risks tied to large-scale government projects and IT system integrations.
6. ESG & Climate Transition
International Business Machines Corporation
- Strong initiatives in sustainable technology but legacy operations create transition challenges.
Leidos Holdings, Inc.
- ESG efforts growing, especially in environmental services, but defense sector exposure complicates perception.
7. Geopolitical Exposure
International Business Machines Corporation
- Global footprint exposes IBM to trade tensions and regulatory shifts across major markets.
Leidos Holdings, Inc.
- Heavy reliance on U.S. government contracts limits international geopolitical risks but increases domestic policy sensitivity.
Which company shows a better risk-adjusted profile?
Leidos’ primary risk lies in its elevated leverage and dependency on government budgets. IBM faces competitive disruption amid transformation and debt-related balance sheet pressures. Leidos scores higher on financial strength and operational efficiency, reflecting a stronger risk-adjusted position. IBM’s moderate stock volatility contrasts with its weaker capital structure. The recent data reveals Leidos’ superior Altman Z-Score and Piotroski Score, underscoring healthier financial resilience.
Final Verdict: Which stock to choose?
International Business Machines Corporation (IBM) stands out as a cash machine with a strong ability to generate free cash flow and maintain a solid dividend yield. Its main point of vigilance is its declining ROIC trend, which suggests pressure on capital efficiency. IBM fits well in portfolios seeking aggressive growth with income stability.
Leidos Holdings, Inc. (LDOS) impresses with a durable moat driven by growing ROIC well above its cost of capital, signaling efficient capital allocation and expanding profitability. It offers better financial stability and operational agility than IBM. LDOS suits investors favoring GARP—growth at a reasonable price—with a tilt toward quality growth.
If you prioritize robust free cash flow and dividend income, IBM is the compelling choice due to its cash generation prowess and income profile. However, if you seek durable competitive advantage and improving capital returns, LDOS offers better stability and growth potential with a more favorable moat. Each stock aligns with distinct investor profiles and risk appetites.
Disclaimer: Investment carries a risk of loss of initial capital. The past performance is not a reliable indicator of future results. Be sure to understand risks before making an investment decision.
Go Further
I encourage you to read the complete analyses of International Business Machines Corporation and Leidos Holdings, Inc. to enhance your investment decisions: