Home > Comparison > Technology > IBM vs JKHY
The strategic rivalry between International Business Machines Corporation and Jack Henry & Associates, Inc. shapes the technology services sector’s evolution. IBM operates as a global technology giant, offering integrated software, consulting, and infrastructure solutions. Conversely, Jack Henry & Associates specializes in niche financial technology services, focusing on payment processing and core banking software. This analysis contrasts their distinct growth models to identify which offers superior risk-adjusted returns for a diversified portfolio in 2026.
Table of contents
Companies Overview
International Business Machines Corporation and Jack Henry & Associates, Inc. stand as influential players in the technology services sector.
International Business Machines Corporation: Global IT Services Giant
IBM dominates with its integrated solutions and services globally. Its revenues stem from four key segments: Software, Consulting, Infrastructure, and Financing. In 2026, IBM strategically focuses on hybrid cloud platforms and enterprise software, emphasizing open-source solutions like Red Hat to drive growth in business automation and AI-powered analytics.
Jack Henry & Associates, Inc.: Specialized Financial Technology Provider
Jack Henry & Associates commands a niche in technology solutions for financial institutions in the U.S. It generates revenue via core data processing, payments, and complementary services tailored for banks and credit unions. In 2026, its strategic priority lies in enhancing digital payment solutions and integrated applications to meet evolving customer demands in financial services.
Strategic Collision: Similarities & Divergences
Both companies excel in IT services but diverge sharply in scale and client focus. IBM embraces an open hybrid cloud ecosystem targeting global enterprises, while Jack Henry opts for specialized, closed fintech solutions within U.S. financial institutions. Their primary battle unfolds in digital transformation services for financial sectors. Investors find IBM’s broad diversification contrasts with Jack Henry’s focused, stable financial niche.
Income Statement Comparison
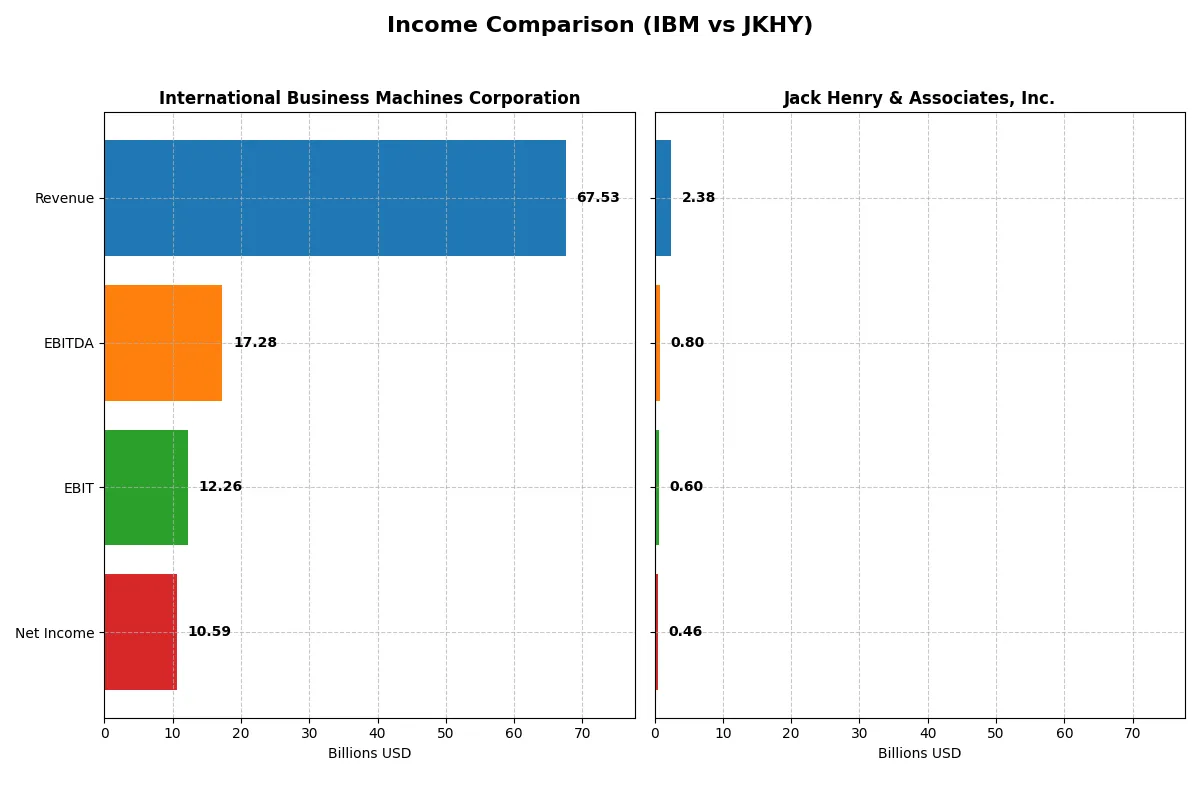
The following data dissects the core profitability and scalability of both corporate engines to reveal who dominates the bottom line:
| Metric | International Business Machines Corporation (IBM) | Jack Henry & Associates, Inc. (JKHY) |
|---|---|---|
| Revenue | 67.5B | 2.38B |
| Cost of Revenue | 27.4B | 1.36B |
| Operating Expenses | 29.9B | 446M |
| Gross Profit | 40.2B | 1.01B |
| EBITDA | 17.3B | 801M |
| EBIT | 12.3B | 596M |
| Interest Expense | 1.94B | 10.4M |
| Net Income | 10.6B | 456M |
| EPS | 11.36 | 6.24 |
| Fiscal Year | 2025 | 2025 |
Income Statement Analysis: The Bottom-Line Duel
The upcoming income statement comparison reveals which company runs a more efficient and profitable business engine amidst evolving market dynamics.
International Business Machines Corporation Analysis
IBM’s revenue climbed steadily from $57.4B in 2021 to $67.5B in 2025, reflecting a 17.8% growth over five years. Net income surged impressively, reaching $10.6B in 2025, up 84.5% since 2021. The company maintains strong margin discipline, with a gross margin near 59.5% and net margin expanding to 15.7%. Recent years show accelerating EBIT and EPS growth, signaling robust operational momentum.
Jack Henry & Associates, Inc. Analysis
Jack Henry’s revenue increased from $1.76B in 2021 to $2.38B in 2025, a 35.1% growth over the period. Net income rose 46.3%, hitting $456M in 2025. The firm boasts a notably higher net margin at 19.2%, despite a lower gross margin of 42.7%. EBIT margin stands strong at 25.1%, underlining operational efficiency. Recent growth in EBIT and EPS also reflects steady profitability gains, supported by disciplined expense management.
Margin Strength vs. Revenue Scale
IBM dominates in absolute revenue and net income, with impressive margin expansion and accelerating profitability. Jack Henry, however, outperforms on margin ratios and operational efficiency, delivering higher net and EBIT margins despite smaller scale. For investors, IBM offers scale-driven growth and margin recovery, while Jack Henry presents a leaner, high-margin profile attractive for those prioritizing profitability over size.
Financial Ratios Comparison
These vital ratios act as a diagnostic tool to expose the underlying fiscal health, valuation premiums, and capital efficiency of each company:
| Ratios | International Business Machines Corporation (IBM) | Jack Henry & Associates, Inc. (JKHY) |
|---|---|---|
| ROE | 22.1% (2024) | 21.4% (2025) |
| ROIC | 9.2% (2024) | 17.6% (2025) |
| P/E | 34.2 (2024) | 28.9 (2025) |
| P/B | 7.54 (2024) | 6.18 (2025) |
| Current Ratio | 1.04 (2024) | 1.27 (2025) |
| Quick Ratio | 1.00 (2024) | 1.27 (2025) |
| D/E | 2.14 (2024) | 0 (2025) |
| Debt-to-Assets | 42.6% (2024) | 0 (2025) |
| Interest Coverage | 5.88 (2024) | 54.5 (2025) |
| Asset Turnover | 0.46 (2024) | 0.78 (2025) |
| Fixed Asset Turnover | 7.03 (2024) | 10.7 (2025) |
| Payout ratio | 102.1% (2024) | 36.1% (2025) |
| Dividend yield | 2.98% (2024) | 1.25% (2025) |
| Fiscal Year | 2024 | 2025 |
Efficiency & Valuation Duel: The Vital Signs
Financial ratios serve as a company’s DNA, exposing hidden risks and operational strengths that shape investment decisions.
International Business Machines Corporation
IBM posts a favorable net margin of 15.7% but shows zero return on equity and invested capital, signaling operational challenges. Its P/E at 26.1 appears stretched compared to sector peers. The company maintains a 2.27% dividend yield, rewarding shareholders steadily despite reinvestment needs implied by mixed profitability.
Jack Henry & Associates, Inc.
Jack Henry delivers robust profitability with a 21.4% ROE and a 19.2% net margin, reflecting operational efficiency. Its P/E of 28.9 is high, indicating premium valuation. The firm balances growth and returns with a 1.25% dividend yield and strong reinvestment into R&D, fueling sustained competitive advantage and cash flow strength.
Premium Valuation vs. Operational Safety
Jack Henry exhibits superior profitability and healthier ratios, justifying its premium valuation better than IBM’s stretched multiples and weaker returns. Investors favoring growth with operational safety may find Jack Henry’s profile more compelling, whereas IBM suits those prioritizing income and established market presence.
Which one offers the Superior Shareholder Reward?
I compare IBM and Jack Henry & Associates on dividends, payout ratios, and buybacks to find the superior shareholder reward in 2026. IBM yields 2.27% with a 59% payout ratio and robust buybacks, sustaining returns via strong free cash flow. Jack Henry yields just 1.25%, with a conservative 36% payout and moderate buybacks, focusing on growth reinvestment. IBM’s model offers higher immediate income and solid buybacks, but Jack Henry’s lower payout supports long-term expansion. For 2026 investors seeking total return, I find IBM’s balanced income and buyback strategy delivers superior shareholder reward.
Comparative Score Analysis: The Strategic Profile
The radar chart reveals the fundamental DNA and trade-offs of International Business Machines Corporation and Jack Henry & Associates, Inc.:
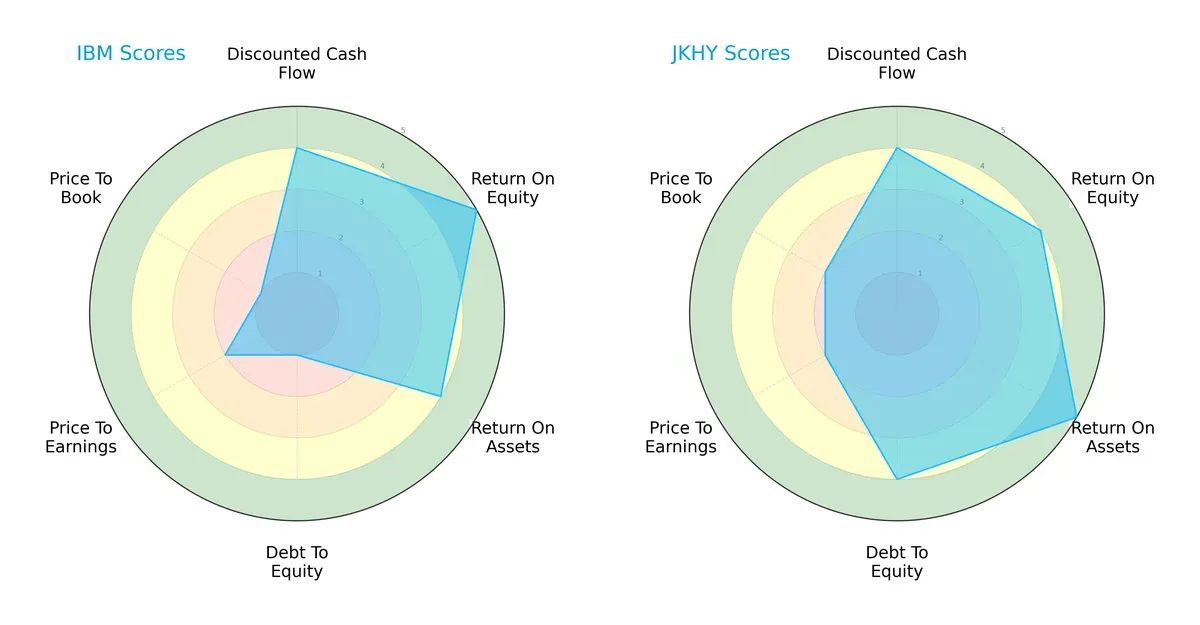
Jack Henry displays a more balanced financial profile, excelling in debt management (Debt/Equity score 4 vs. 1) and asset efficiency (ROA score 5 vs. 4). IBM leads in profitability metrics, boasting a higher ROE (5 vs. 4) but struggles with leverage and valuation, reflected in weak Debt/Equity (1) and Price-to-Book scores (1). Jack Henry’s moderate but consistent scores across categories suggest steadier operational footing, while IBM relies heavily on its profitability edge.
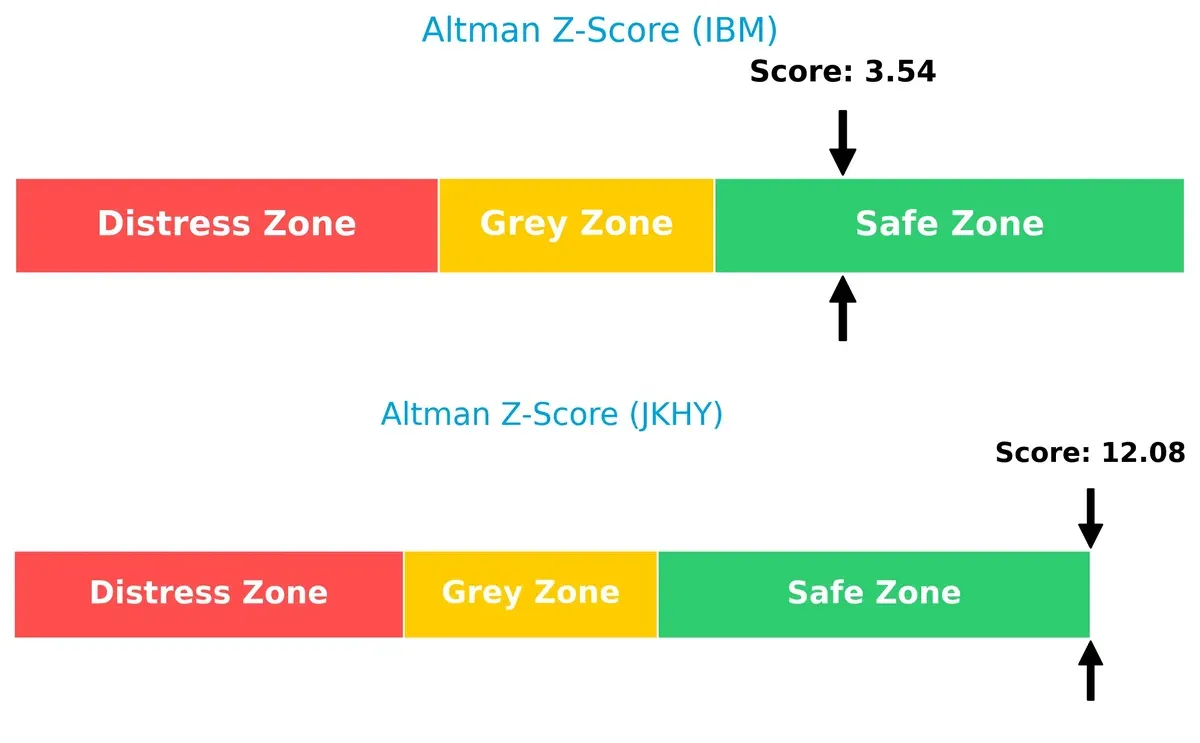
Bankruptcy Risk: Solvency Showdown
The Altman Z-Score gap favors Jack Henry, scoring 12.08 against IBM’s 3.54, signaling a much stronger solvency position and lower bankruptcy risk in this cycle:
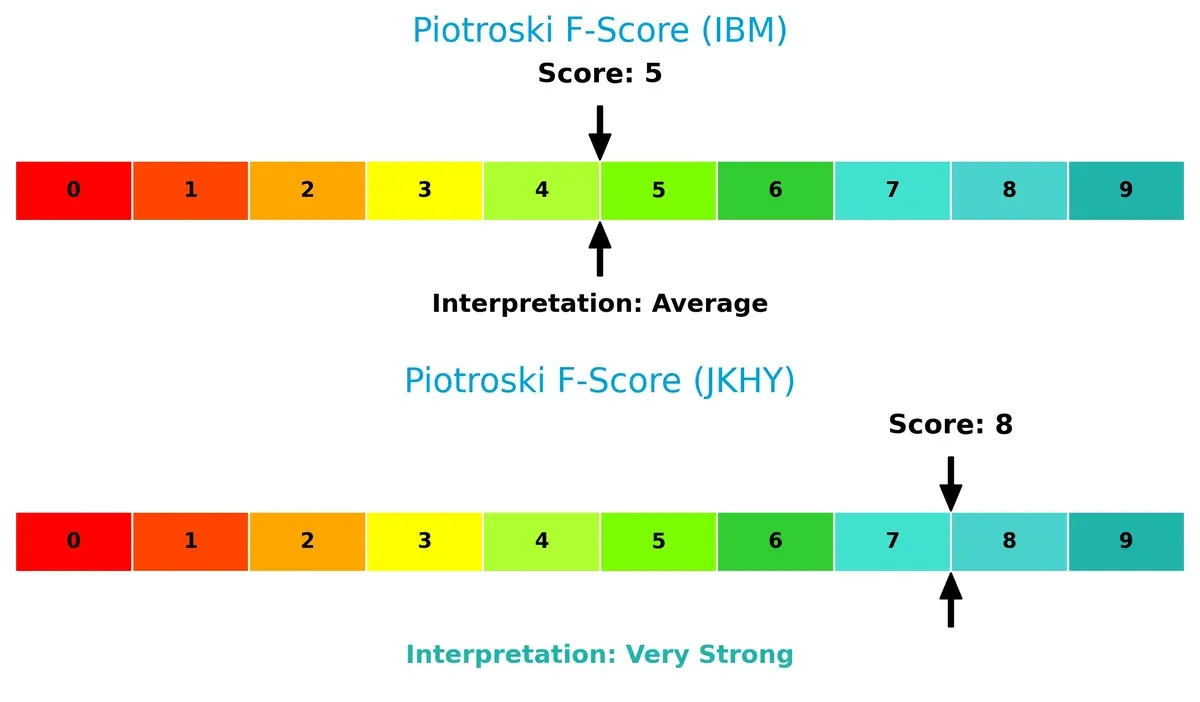
Financial Health: Quality of Operations
Jack Henry’s Piotroski score of 8 significantly outperforms IBM’s 5, indicating superior internal financial strength and fewer red flags in operational efficiency and liquidity:
How are the two companies positioned?
This section dissects the operational DNA of IBM and JKHY by comparing revenue distribution and internal dynamics. The goal is to confront their economic moats and identify which model offers the most resilient, sustainable advantage today.
Revenue Segmentation: The Strategic Mix
This visual comparison dissects how International Business Machines Corporation and Jack Henry & Associates, Inc. diversify their income streams and where their primary sector bets lie:
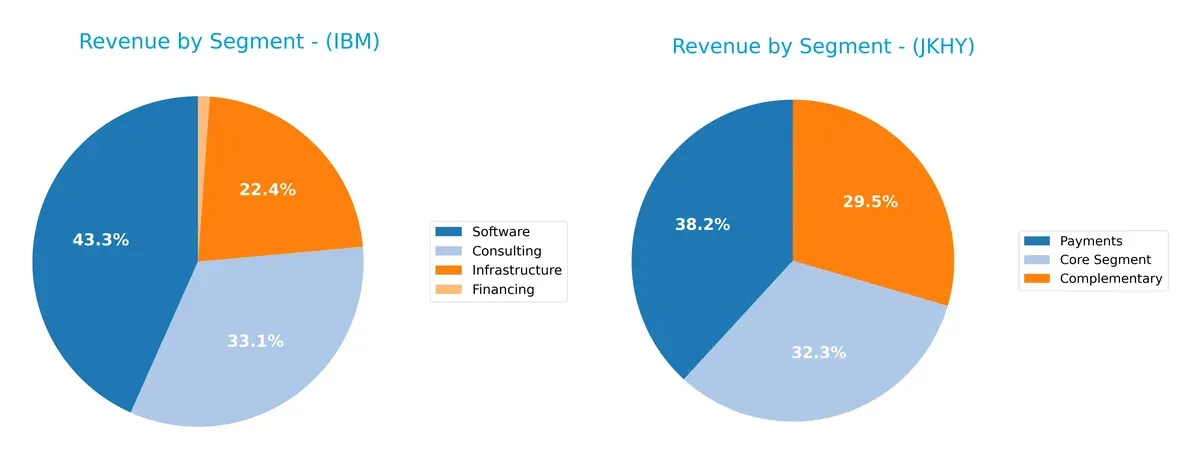
IBM’s revenue dwarfs JKHY’s, anchored by Software at $27B and Consulting at $20.7B in 2024. IBM exhibits a diversified portfolio with Infrastructure ($14B) and Financing ($713M) segments. Conversely, JKHY’s 2025 revenue is more evenly split among Payments ($873M), Core Segment ($739M), and Complementary ($675M). IBM’s broad mix signals an ecosystem lock-in strategy, while JKHY’s concentrated segments reflect focused niche dominance but higher concentration risk.
Strengths and Weaknesses Comparison
This table compares the strengths and weaknesses of IBM and JKHY based on diversification, profitability, financials, innovation, global presence, and market share:
IBM Strengths
- Diverse revenue streams across software, consulting, infrastructure, and financing
- Strong global presence with significant Americas, EMEA, and Asia Pacific sales
- Favorable net margin at 15.69%
- Low debt-to-assets and favorable interest coverage at 6.34
- Dividend yield of 2.27% supports shareholder returns
JKHY Strengths
- High profitability with net margin 19.19%, ROE 21.39%, and ROIC 17.63%
- Strong capital efficiency with ROIC above WACC (7.24%)
- Favorable quick ratio and interest coverage at 57.14
- Efficient asset turnover and fixed asset turnover
- Growing payments segment complements core banking systems
IBM Weaknesses
- Unfavorable ROE and ROIC at 0% indicate weak capital returns
- Unfavorable liquidity ratios (current and quick ratio at 0) signal short-term risk
- Unfavorable P/E at 26.07 suggests valuation pressure
- Weak asset turnover metrics
- Global ratios evaluation slightly unfavorable with 50% unfavorable ratios
JKHY Weaknesses
- Unfavorable P/E of 28.88 and high PB at 6.18 indicate expensive valuation
- Neutral current ratio at 1.27 implies moderate liquidity
- Dividend yield lower at 1.25%
- Limited global presence data restricts geographic diversification analysis
- 21.43% neutral ratios suggest some financial metrics lack strength
Overall, IBM demonstrates strong global diversification and stable profitability but suffers from poor capital efficiency and liquidity concerns. JKHY shows superior profitability and capital allocation but faces valuation challenges and less visibility on geographic diversification. These contrasting profiles highlight differing strategic priorities: IBM’s broad market reach versus JKHY’s focused operational efficiency.
The Moat Duel: Analyzing Competitive Defensibility
A structural moat is the only reliable shield protecting long-term profits from relentless competition erosion. Let’s dissect the competitive moats of two tech firms:
International Business Machines Corporation (IBM): Intangible Assets and Scale Moat
IBM’s competitive edge stems from its vast intangible assets and global scale. This translates into stable margins and strong EBIT growth, despite a recent declining ROIC trend. In 2026, hybrid cloud and AI innovations could deepen its moat but must counter agile rivals.
Jack Henry & Associates, Inc. (JKHY): Switching Costs and Niche Focus
JKHY’s moat lies in high switching costs embedded in its financial services software. It drives superior ROIC growth and margin expansion, outperforming IBM’s efficiency. Its focused client base and scalable payments tech position it well for steady market disruption in 2026.
Moat Depth Battle: Intangible Scale vs. Switching Cost Resilience
JKHY exhibits a wider and more durable moat with a growing ROIC and clear value creation, unlike IBM’s declining capital efficiency. Jack Henry is better equipped to defend and expand its market share in the coming years.
Which stock offers better returns?
Over the past 12 months, IBM’s stock surged sharply but slowed recently, while Jack Henry & Associates showed steady gains with accelerating momentum.
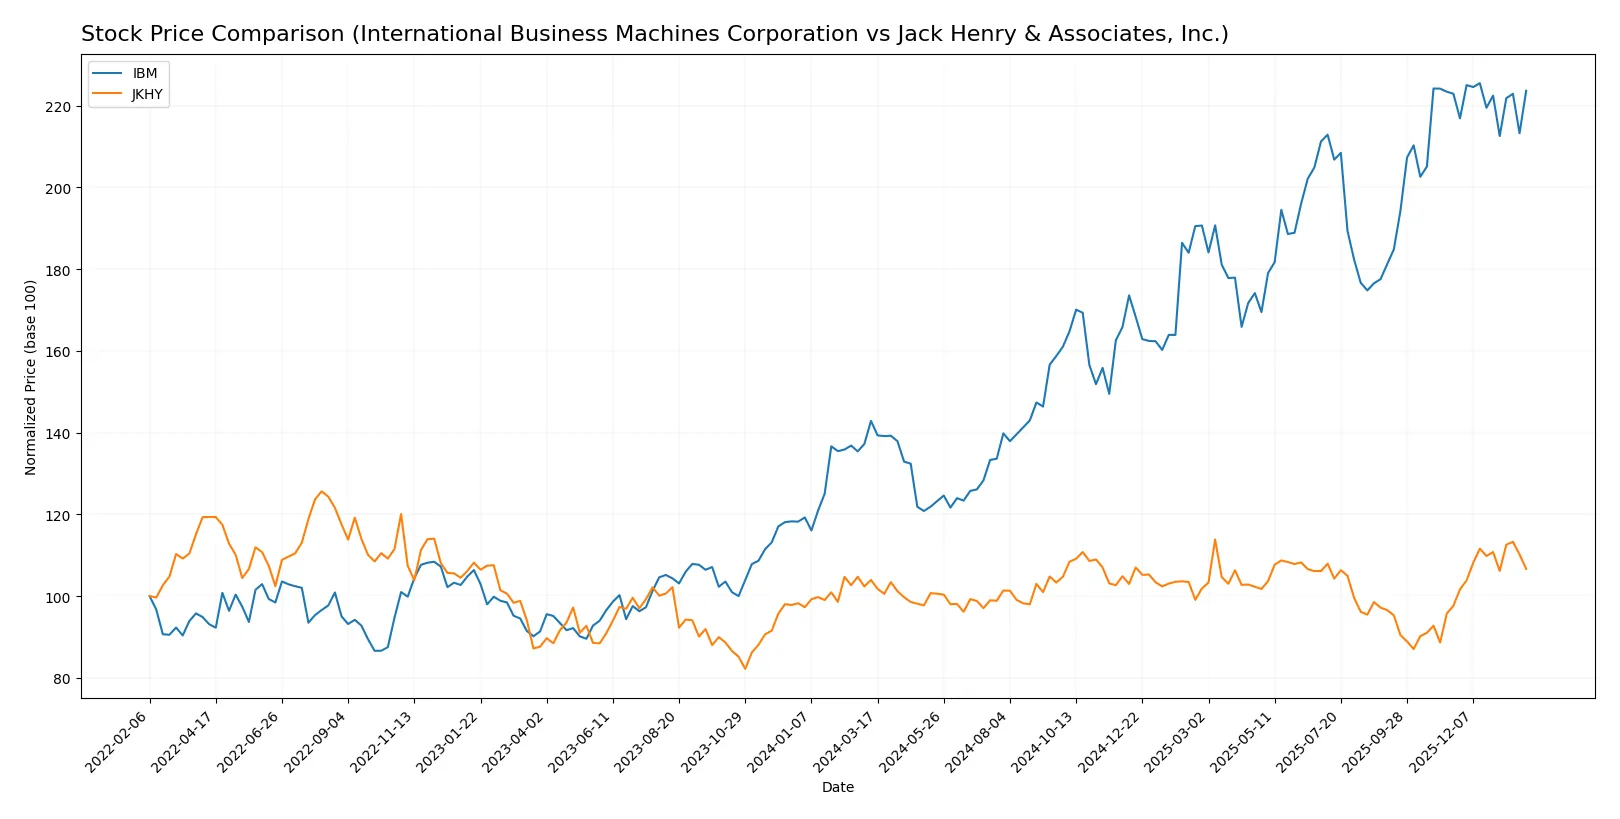
Trend Comparison
IBM’s stock rose 56.52% over the past year, indicating a strong bullish trend despite decelerating gains and high volatility. The price ranged from 166 to 309.
Jack Henry’s shares gained 2.61% over the last 12 months with accelerating momentum and moderate volatility, reaching a high of 191 and low of 146.
IBM delivered higher overall market performance, though Jack Henry’s recent acceleration contrasts IBM’s recent mild decline.
Target Prices
Analysts show a positive outlook for both IBM and Jack Henry & Associates with well-defined target price ranges.
| Company | Target Low | Target High | Consensus |
|---|---|---|---|
| International Business Machines Corporation | 304 | 380 | 349.5 |
| Jack Henry & Associates, Inc. | 181 | 220 | 203.14 |
The consensus target prices for IBM and Jack Henry exceed their current prices by 14% and 13%, respectively. This suggests moderate upside potential reflecting confidence in their business models.

Don’t Let Luck Decide Your Entry Point
Optimize your entry points with our advanced ProRealTime indicators. You’ll get efficient buy signals with precise price targets for maximum performance. Start outperforming now!
How do institutions grade them?
Here is a summary of recent institutional grades for International Business Machines Corporation and Jack Henry & Associates, Inc.:
International Business Machines Corporation Grades
The following table lists recent grades from major financial institutions for IBM:
| Grading Company | Action | New Grade | Date |
|---|---|---|---|
| Wedbush | maintain | Outperform | 2026-01-29 |
| RBC Capital | maintain | Outperform | 2026-01-29 |
| Stifel | maintain | Buy | 2026-01-29 |
| JP Morgan | maintain | Neutral | 2026-01-29 |
| UBS | maintain | Sell | 2026-01-29 |
| Evercore ISI Group | maintain | Outperform | 2026-01-29 |
| Jefferies | maintain | Buy | 2026-01-29 |
| JP Morgan | maintain | Neutral | 2026-01-21 |
| Evercore ISI Group | maintain | Outperform | 2026-01-20 |
| B of A Securities | maintain | Buy | 2026-01-13 |
Jack Henry & Associates, Inc. Grades
Below are recent institutional grades for Jack Henry & Associates, Inc.:
| Grading Company | Action | New Grade | Date |
|---|---|---|---|
| Wells Fargo | maintain | Equal Weight | 2026-01-30 |
| DA Davidson | maintain | Buy | 2026-01-29 |
| DA Davidson | maintain | Buy | 2026-01-28 |
| Wolfe Research | upgrade | Outperform | 2026-01-08 |
| UBS | maintain | Neutral | 2026-01-08 |
| RBC Capital | upgrade | Outperform | 2025-12-16 |
| Baird | maintain | Neutral | 2025-12-15 |
| Keefe, Bruyette & Woods | upgrade | Outperform | 2025-12-08 |
| Goldman Sachs | maintain | Neutral | 2025-11-07 |
| Compass Point | upgrade | Buy | 2025-11-06 |
Which company has the best grades?
Jack Henry & Associates, Inc. shows a stronger upward trend with multiple upgrades to Outperform and Buy. IBM’s ratings are more mixed, including Sell and Neutral grades. Investors may interpret Jack Henry’s improving outlook as potentially more favorable.
Risks specific to each company
The following categories identify the critical pressure points and systemic threats facing both firms in the 2026 market environment:
1. Market & Competition
International Business Machines Corporation
- Faces intense competition in hybrid cloud and AI sectors from large tech peers.
Jack Henry & Associates, Inc.
- Operates in a niche fintech space but faces growing competition from emerging fintech startups.
2. Capital Structure & Debt
International Business Machines Corporation
- Strong debt management with favorable debt ratios but unclear WACC data raises questions.
Jack Henry & Associates, Inc.
- Maintains low debt with strong interest coverage, reflecting robust financial health.
3. Stock Volatility
International Business Machines Corporation
- Beta at 0.698 indicates moderate stock volatility, less sensitive to market swings.
Jack Henry & Associates, Inc.
- Beta at 0.731 suggests slightly higher volatility but still below market average.
4. Regulatory & Legal
International Business Machines Corporation
- Subject to extensive global regulatory scrutiny, especially on data privacy and software compliance.
Jack Henry & Associates, Inc.
- Faces regulatory challenges primarily in U.S. financial services sector compliance.
5. Supply Chain & Operations
International Business Machines Corporation
- Complex global supply chain for infrastructure hardware risks operational disruption.
Jack Henry & Associates, Inc.
- More streamlined operations focused on software and services reduce supply chain risks.
6. ESG & Climate Transition
International Business Machines Corporation
- Committed to climate goals but heavy legacy infrastructure impacts carbon footprint.
Jack Henry & Associates, Inc.
- Smaller footprint with growing ESG initiatives aligned to fintech sector expectations.
7. Geopolitical Exposure
International Business Machines Corporation
- Significant global presence exposes IBM to trade tensions and geopolitical risks.
Jack Henry & Associates, Inc.
- Primarily U.S.-focused, limiting direct exposure but vulnerable to domestic policy shifts.
Which company shows a better risk-adjusted profile?
IBM’s largest risk lies in its complex global operations and legacy infrastructure, which heighten geopolitical and operational vulnerabilities. Jack Henry faces its greatest threat from rising fintech competition and regulatory pressures in a narrower market. Jack Henry’s superior financial ratios and strong Altman Z-Score demonstrate a more robust risk-adjusted profile. Notably, Jack Henry’s very strong Piotroski score signals solid financial health, contrasting with IBM’s average score, reinforcing my caution toward IBM’s balance sheet risks.
Final Verdict: Which stock to choose?
International Business Machines Corporation (IBM) stands out as a resilient cash machine with a solid income quality and improving profitability metrics. Its main point of vigilance lies in a declining ROIC trend, which could signal challenges in capital efficiency. IBM suits investors focused on steady income and value-oriented long-term holdings.
Jack Henry & Associates, Inc. (JKHY) commands a durable moat through its robust return on invested capital exceeding its cost of capital, reflecting effective capital allocation and competitive strength. It also offers a safer financial profile with strong liquidity and very strong financial health scores. JKHY fits growth investors seeking a blend of profitability and stability.
If you prioritize steady cash flow and income stability, IBM is the compelling choice due to its strong earnings quality and dividend yield. However, if you seek long-term growth backed by a durable competitive advantage and superior capital returns, JKHY offers better stability and value creation potential. Both present analytical scenarios tailored to distinct investor profiles.
Disclaimer: Investment carries a risk of loss of initial capital. The past performance is not a reliable indicator of future results. Be sure to understand risks before making an investment decision.
Go Further
I encourage you to read the complete analyses of International Business Machines Corporation and Jack Henry & Associates, Inc. to enhance your investment decisions: