Home > Comparison > Financial Services > SPGI vs ICE
The strategic rivalry between S&P Global Inc. and Intercontinental Exchange, Inc. shapes the financial data and exchange sector’s future. S&P Global operates as a diversified financial information powerhouse, offering analytics, credit ratings, and benchmarks. In contrast, Intercontinental Exchange focuses on regulated exchanges, clearinghouses, and mortgage technology platforms. This analysis examines their contrasting business models to determine which offers superior risk-adjusted returns for a diversified portfolio in an evolving market landscape.
Table of contents
Companies Overview
S&P Global and Intercontinental Exchange dominate the financial data and exchange landscape with distinct strategic models.
S&P Global Inc.: Data-Driven Market Intelligence Leader
S&P Global Inc. commands the financial data and analytics market through credit ratings, benchmarks, and workflow solutions. Its diversified revenue stems from six divisions, including credit ratings and market intelligence. In 2026, the company sharpened its focus on delivering end-to-end data and sustainability solutions to empower investor decisions.
Intercontinental Exchange, Inc.: Exchange and Clearing Powerhouse
Intercontinental Exchange operates a network of regulated exchanges and clearinghouses, generating revenue from trading venues and data services across multiple asset classes. Its 2026 strategy prioritizes expanding its mortgage technology platform and enhancing fixed income analytics to support diverse financial markets globally.
Strategic Collision: Similarities & Divergences
While both companies excel in financial services, S&P Global emphasizes comprehensive data and analytics, contrasting ICE’s focus on exchange infrastructure and clearing services. They compete primarily in the market data and trading technology arena. S&P Global offers a data-centric investment profile, whereas ICE presents a more transaction-driven growth model.
Income Statement Comparison
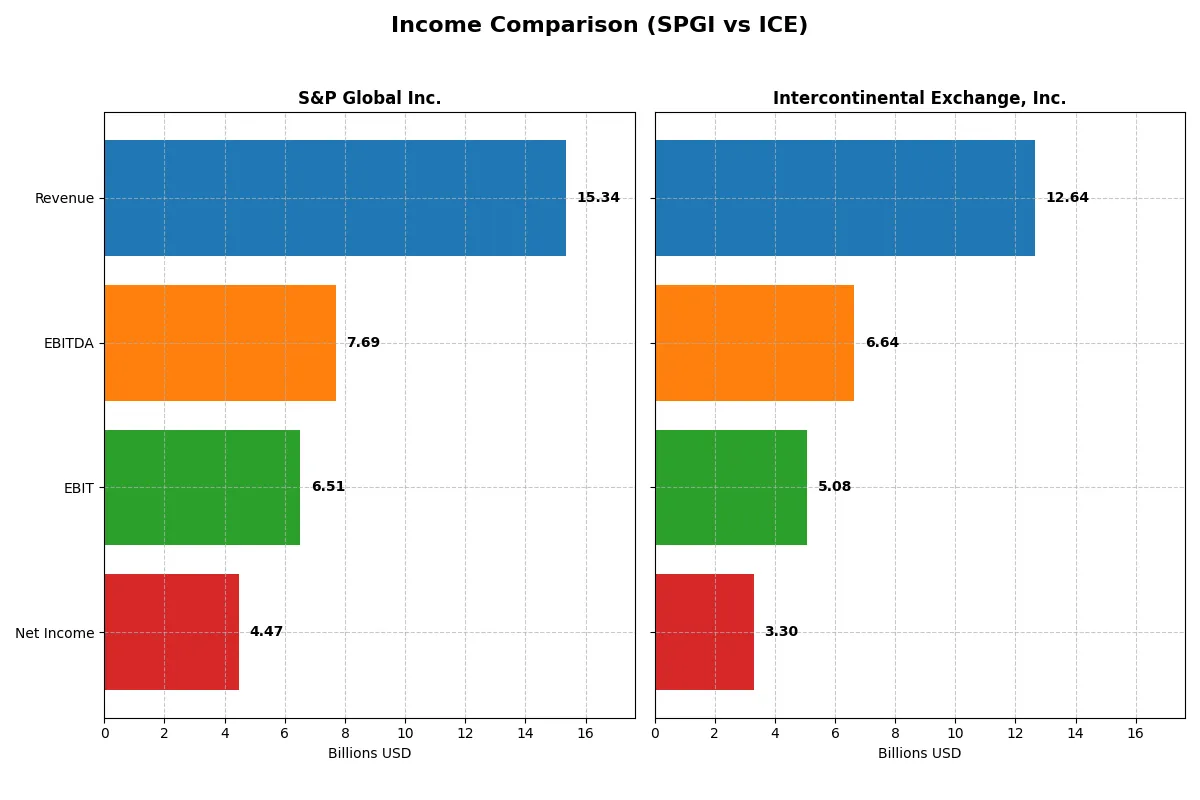
This data dissects the core profitability and scalability of both corporate engines to reveal who dominates the bottom line:
| Metric | S&P Global Inc. (SPGI) | Intercontinental Exchange, Inc. (ICE) |
|---|---|---|
| Revenue | 15.3B | 12.6B |
| Cost of Revenue | 9.2B | 4.8B |
| Operating Expenses | 0 | 2.9B |
| Gross Profit | 6.2B | 7.8B |
| EBITDA | 7.7B | 6.6B |
| EBIT | 6.5B | 5.1B |
| Interest Expense | 287M | 781M |
| Net Income | 4.5B | 3.3B |
| EPS | 14.67 | 5.80 |
| Fiscal Year | 2025 | 2025 |
Income Statement Analysis: The Bottom-Line Duel
This income statement comparison reveals which company runs a more efficient and profitable corporate engine through recent financial performance.
S&P Global Inc. Analysis
S&P Global’s revenue grew steadily from $8.3B in 2021 to $15.3B in 2025, with net income rising from $3B to $4.5B. Its gross margin remains strong at 40.3%, and net margin improved to 29.2% in 2025, reflecting excellent cost control. The 2025 EBIT margin of 42.5% highlights rising operational efficiency and solid momentum.
Intercontinental Exchange, Inc. Analysis
ICE’s revenue climbed from $9.2B in 2021 to $12.6B in 2025, with net income fluctuating, peaking at $4.1B in 2021 but declining to $3.3B by 2025. Its gross margin is notably higher at 61.9%, but net margin at 26.1% signals pressure from interest and other expenses. Despite 2025’s 12% EBIT growth, rising expenses dampen overall margin gains.
Margin Power vs. Revenue Scale
S&P Global outpaces ICE with superior net margin expansion and consistent revenue growth, reflecting robust profitability and operational discipline. ICE delivers higher gross margins but struggles with net income volatility and expense control. For investors prioritizing margin strength and steady earnings growth, S&P Global presents the more attractive profile.
Financial Ratios Comparison
These vital ratios act as a diagnostic tool to expose the underlying fiscal health, valuation premiums, and capital efficiency of the companies analyzed:
| Ratios | S&P Global Inc. (SPGI) | Intercontinental Exchange, Inc. (ICE) |
|---|---|---|
| ROE | 14.3% | 11.4% |
| ROIC | 9.2% | 7.0% |
| P/E | 35.6 | 28.0 |
| P/B | 5.10 | 3.20 |
| Current Ratio | 0.82 | 1.02 |
| Quick Ratio | 0.82 | 1.02 |
| D/E | 0.43 | 0.70 |
| Debt-to-Assets | 22.2% | 14.8% |
| Interest Coverage | 22.6 | 6.3 |
| Asset Turnover | 0.25 | 0.09 |
| Fixed Asset Turnover | 55.2 | 4.70 |
| Payout ratio | 26.2% | 33.4% |
| Dividend yield | 0.73% | 1.19% |
| Fiscal Year | 2025 | 2025 |
Efficiency & Valuation Duel: The Vital Signs
Ratios serve as a company’s DNA, unveiling hidden risks and operational strengths that influence long-term investor outcomes.
S&P Global Inc.
S&P Global shows strong profitability with a 29.15% net margin and 14.31% ROE, signaling solid core earnings. However, its valuation feels stretched, reflected in a high 35.63 P/E and 5.1 P/B ratios. Shareholder returns are modest, with a low 0.73% dividend yield, suggesting retained earnings likely fuel growth or innovation.
Intercontinental Exchange, Inc.
Intercontinental Exchange delivers a favorable 26.14% net margin but a lower 11.43% ROE, indicating efficient but less robust profitability. Its valuation is more reasonable at 28.0 P/E and 3.2 P/B, though still elevated. The 1.19% dividend yield supports shareholders, complemented by solid capital discipline and moderate leverage.
Valuation Discipline vs. Profitability Edge
S&P Global commands a premium for stronger profitability but risks valuation complacency. ICE offers a better balance, combining decent margins with a slightly more attractive valuation and shareholder yield. Investors favoring growth might lean toward S&P Global, while those prioritizing yield and valuation discipline may prefer ICE.
Which one offers the Superior Shareholder Reward?
I compare S&P Global Inc. (SPGI) and Intercontinental Exchange, Inc. (ICE) by their distribution models. SPGI yields 0.73% with a 29% payout ratio, supported by robust free cash flow coverage near 97%. It complements dividends with aggressive buybacks, signaling strong capital returns. ICE offers a higher 1.19% yield but pays out 33% of earnings, with slightly lower free cash flow coverage at 92%. Its buyback intensity is moderate given its higher leverage and lower operating cash flow ratio. SPGI’s balanced dividend plus high buybacks, combined with superior operating margins and free cash flow strength, forms a more sustainable shareholder reward model. I favor SPGI for total return leadership in 2026.
Comparative Score Analysis: The Strategic Profile
The radar chart reveals the fundamental DNA and trade-offs of S&P Global Inc. and Intercontinental Exchange, Inc.:
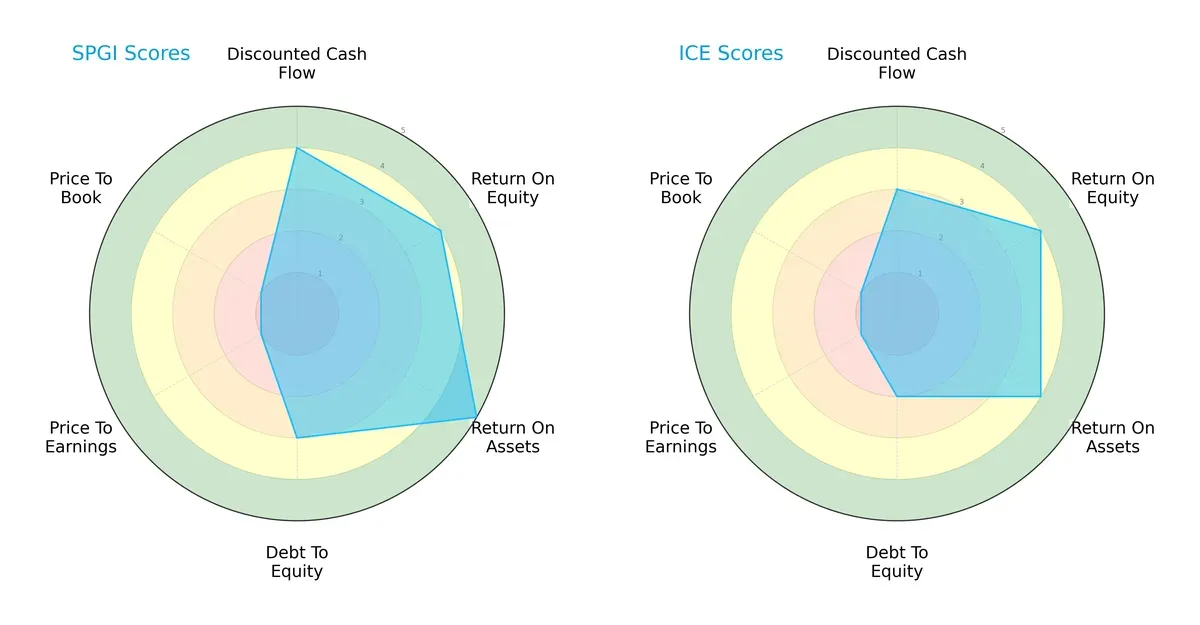
S&P Global boasts superior discounted cash flow and asset utilization scores, reflecting a strong operational moat. Intercontinental Exchange matches S&P Global on return on equity but lags on debt management, showing higher financial risk. Both firms share weak valuation scores, suggesting market skepticism. S&P Global offers a more balanced profile, while ICE leans on equity returns despite leverage concerns.
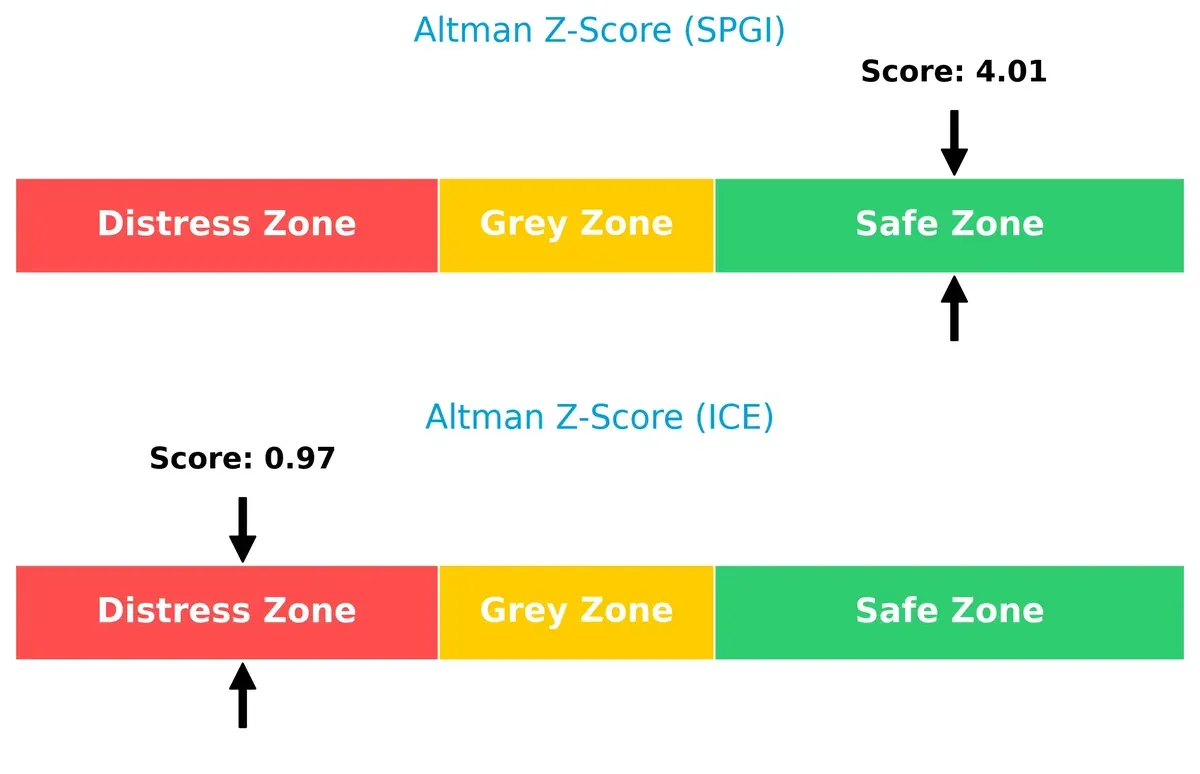
Bankruptcy Risk: Solvency Showdown
S&P Global’s Altman Z-Score of 4.01 places it securely in the safe zone, signaling robust long-term solvency. Intercontinental Exchange’s 0.97 score flags distress risk, indicating potential financial instability under current market conditions:
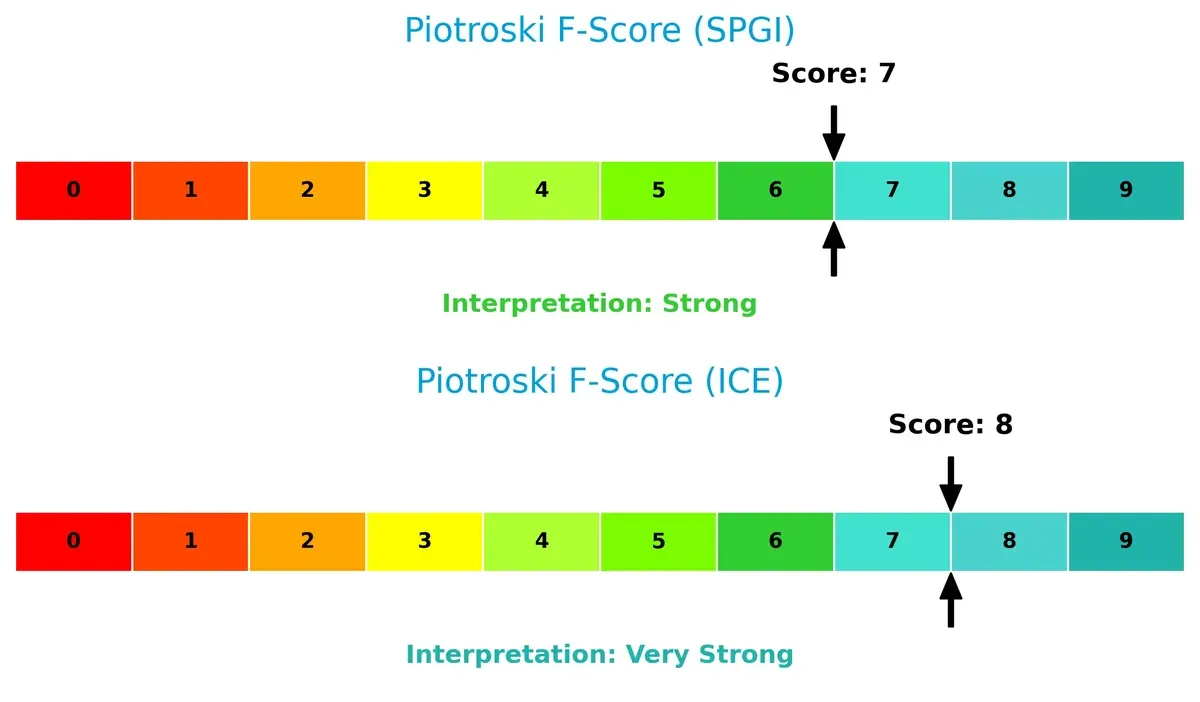
Financial Health: Quality of Operations
Intercontinental Exchange scores an impressive 8 on the Piotroski scale, reflecting very strong financial health and operational efficiency. S&P Global’s solid 7 still denotes strength but hints at minor red flags compared to ICE’s near-peak score:
How are the two companies positioned?
This section dissects the operational DNA of S&P Global and ICE by comparing their revenue distribution and internal strengths and weaknesses. The goal is to confront their economic moats and identify the more resilient, sustainable competitive advantage today.
Revenue Segmentation: The Strategic Mix
This visual comparison dissects how S&P Global Inc. and Intercontinental Exchange, Inc. diversify their income streams and where their primary sector bets lie:
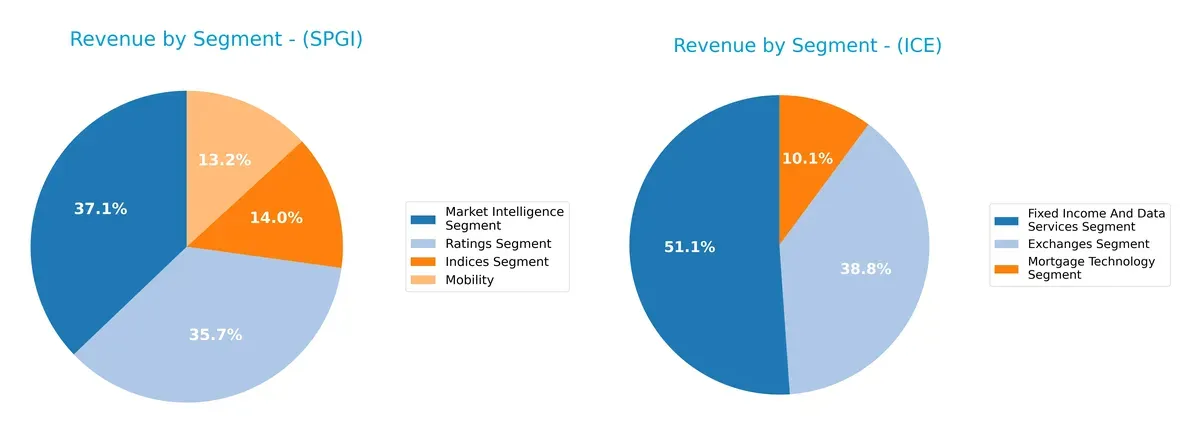
S&P Global anchors revenue in Market Intelligence at $4.9B and Ratings at $4.7B, with meaningful contributions from Indices ($1.85B) and Mobility ($1.75B). ICE pivots on Exchanges ($1.03B) and Fixed Income/Data Services ($1.36B), with Mortgage Technology smaller at $270M. S&P Global’s mix is broader, reducing concentration risk, while ICE’s focus on infrastructure-driven segments signals strong ecosystem lock-in but less diversification.
Strengths and Weaknesses Comparison
This table compares the Strengths and Weaknesses of S&P Global Inc. and Intercontinental Exchange, Inc.:
S&P Global Inc. Strengths
- Diverse revenue from four segments including Ratings and Market Intelligence
- Strong net margin at 29.15%
- Favorable debt-to-equity ratio at 0.43
- High interest coverage ratio at 22.7
- Significant US revenue of 9.3B
- Large European presence with 3.5B revenue
Intercontinental Exchange, Inc. Strengths
- Favorable WACC at 7.44% indicating efficient capital cost
- Diversified segments including Exchanges and Fixed Income Data
- Positive net margin at 26.14%
- Better liquidity ratios: current and quick ratios above 1.0
- Lower debt-to-assets ratio at 14.81%
- Strong US revenue at 6.3B and solid European presence at 3.6B
S&P Global Inc. Weaknesses
- Unfavorable valuation multiples: PE 35.63, PB 5.1
- Low current ratio at 0.82 signals liquidity risk
- Asset turnover low at 0.25
- Dividend yield low at 0.73%
- Moderate ROE and ROIC near WACC
- Concentrated US revenue exposure of 9.3B
Intercontinental Exchange, Inc. Weaknesses
- Unfavorable valuation multiples: PE 28.0, PB 3.2
- Low asset turnover at 0.09 limits efficiency
- Interest coverage lower than SPGI at 6.51
- Moderate ROE and ROIC near WACC
- Dividend yield moderate at 1.19%
- Revenue more concentrated in US and Europe with less diversification
Both companies show strengths in profitability and geographic presence, particularly in the US and Europe. SPGI exhibits higher leverage efficiency and interest coverage, while ICE maintains better liquidity and capital cost management. However, each faces challenges in valuation levels and asset efficiency that could impact strategic flexibility.
The Moat Duel: Analyzing Competitive Defensibility
A structural moat is the only true defense against competitors eroding long-term profits. Let’s explore how each firm protects its turf:
S&P Global Inc.: Intangible Assets and Data Dominance
S&P Global leverages unparalleled intangible assets, including proprietary data and benchmarks. This sustains high margins and a 42% EBIT margin. However, declining ROIC signals caution amid market shifts in 2026.
Intercontinental Exchange, Inc.: Network Effects and Market Infrastructure
ICE’s moat stems from its extensive exchange network and clearinghouses, driving robust revenue growth and improving ROIC trends. Despite value destruction, expanding market access could deepen its competitive edge.
Data Depth vs. Network Breadth: The Moat Showdown
S&P Global commands a wider moat through intellectual property and data exclusivity. Conversely, ICE’s growing ROIC hints at a potentially deeper moat via expanding network effects. S&P Global remains better positioned to defend market share in a competitive landscape.
Which stock offers better returns?
The past 12 months reveal contrasting trajectories: S&P Global Inc. shows a mild overall decline with recent acceleration in losses, while Intercontinental Exchange, Inc. records steady gains despite a brief recent pullback.
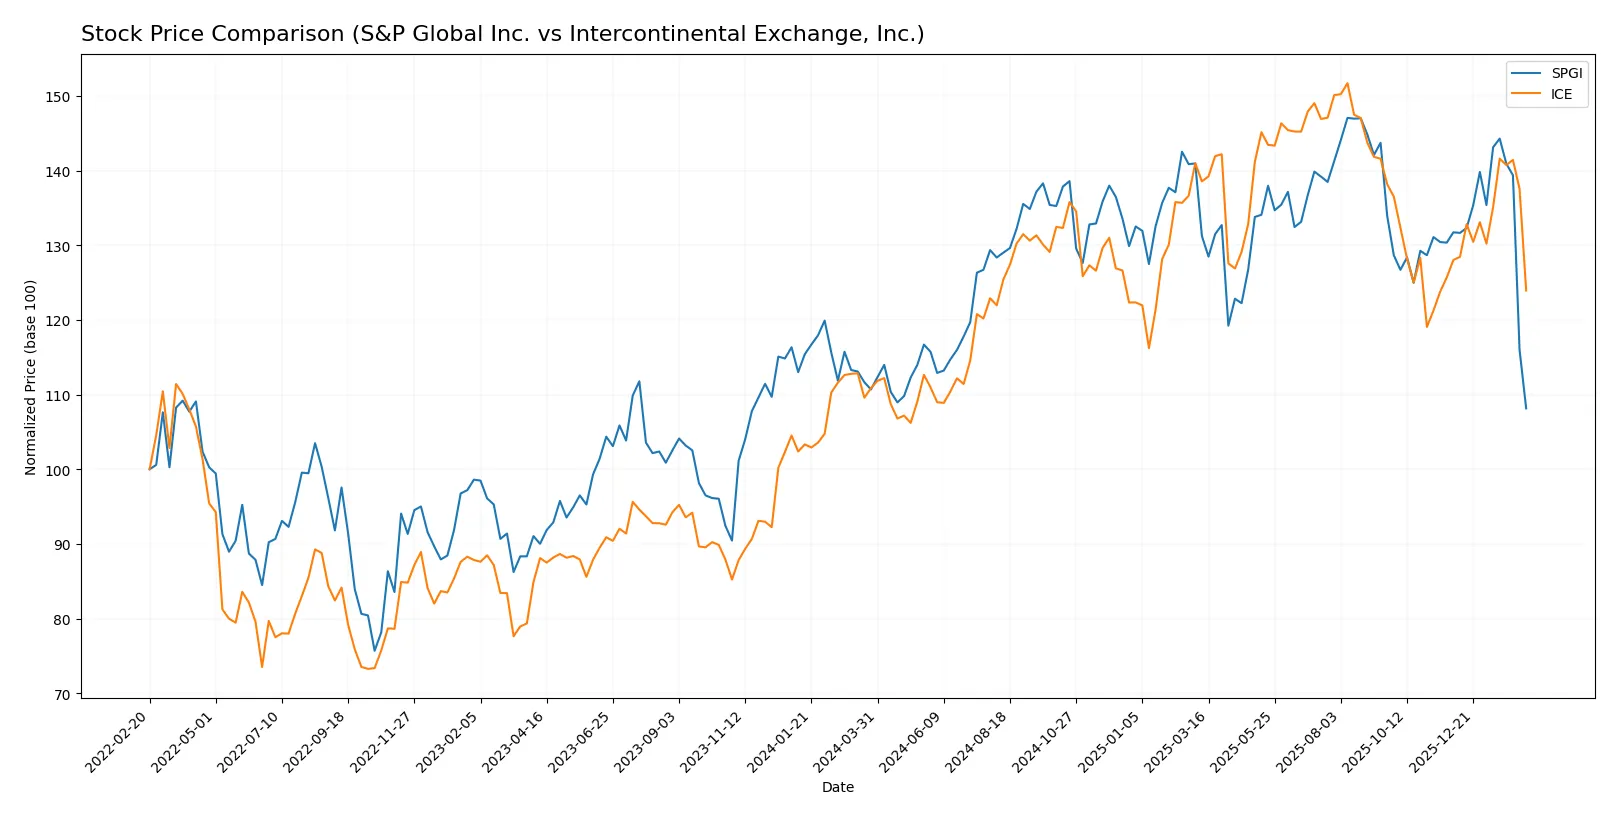
Trend Comparison
S&P Global Inc. posts a 2.29% price decline over the past year, signaling a bearish trend with decelerating losses and a recent sharper dip of 17.9%.
Intercontinental Exchange, Inc. gains 11.78% over the same period, confirming a bullish trend with accelerating momentum, despite a recent mild 3.19% decline.
ICE outperforms SPGI with a clear bullish trend and higher total returns over the past year.
Target Prices
Analysts show a positive consensus on both S&P Global Inc. and Intercontinental Exchange, Inc., indicating upside potential.
| Company | Target Low | Target High | Consensus |
|---|---|---|---|
| S&P Global Inc. | 482 | 627 | 544.75 |
| Intercontinental Exchange, Inc. | 180 | 211 | 193.67 |
The consensus targets for SPGI and ICE exceed their current prices by 33% and 27% respectively, signaling analyst confidence in substantial appreciation potential.

Don’t Let Luck Decide Your Entry Point
Optimize your entry points with our advanced ProRealTime indicators. You’ll get efficient buy signals with precise price targets for maximum performance. Start outperforming now!
How do institutions grade them?
Here is a summary of the latest institutional grades assigned to each company:
S&P Global Inc. Grades
The following table shows recent grades from reputable financial institutions for S&P Global Inc.:
| Grading Company | Action | New Grade | Date |
|---|---|---|---|
| BMO Capital | Maintain | Outperform | 2026-02-12 |
| Mizuho | Maintain | Outperform | 2026-02-12 |
| Stifel | Maintain | Buy | 2026-02-11 |
| Evercore ISI Group | Maintain | Outperform | 2026-02-11 |
| RBC Capital | Maintain | Outperform | 2026-02-11 |
| Goldman Sachs | Maintain | Buy | 2026-02-11 |
| Wells Fargo | Maintain | Overweight | 2026-02-11 |
| Goldman Sachs | Maintain | Buy | 2026-02-09 |
| Morgan Stanley | Maintain | Overweight | 2026-01-13 |
| Evercore ISI Group | Maintain | Outperform | 2026-01-08 |
Intercontinental Exchange, Inc. Grades
The following table shows recent grades from reputable financial institutions for Intercontinental Exchange, Inc.:
| Grading Company | Action | New Grade | Date |
|---|---|---|---|
| Morgan Stanley | Maintain | Equal Weight | 2026-02-10 |
| Barclays | Maintain | Overweight | 2026-02-06 |
| Morgan Stanley | Maintain | Equal Weight | 2026-01-15 |
| Piper Sandler | Maintain | Overweight | 2026-01-14 |
| TD Cowen | Maintain | Buy | 2026-01-14 |
| Barclays | Maintain | Overweight | 2026-01-08 |
| UBS | Maintain | Buy | 2026-01-07 |
| Morgan Stanley | Maintain | Equal Weight | 2025-12-22 |
| JP Morgan | Maintain | Overweight | 2025-10-31 |
| UBS | Maintain | Buy | 2025-10-31 |
Which company has the best grades?
S&P Global Inc. consistently earns higher-tier ratings such as “Outperform” and “Buy,” while Intercontinental Exchange, Inc. mostly receives “Overweight” and “Equal Weight” grades. This suggests stronger analyst confidence in S&P Global’s near-term prospects, which may influence investor sentiment and valuation multiples.
Risks specific to each company
The following categories identify critical pressure points and systemic threats facing both firms in the 2026 market environment:
1. Market & Competition
S&P Global Inc.
- Dominates multiple data and analytics niches but faces high valuation risk (PE 35.6).
Intercontinental Exchange, Inc.
- Strong in exchange operations with lower valuation but intense competition in mortgage tech.
2. Capital Structure & Debt
S&P Global Inc.
- Conservative leverage (D/E 0.43), strong interest coverage (22.7x).
Intercontinental Exchange, Inc.
- Higher leverage (D/E 0.7) with moderate interest coverage (6.5x) raises caution.
3. Stock Volatility
S&P Global Inc.
- Higher beta (1.20) indicates greater market sensitivity and volatility.
Intercontinental Exchange, Inc.
- Lower beta (1.03) suggests more stable price movements relative to market.
4. Regulatory & Legal
S&P Global Inc.
- Exposed to regulatory scrutiny in credit ratings and indices.
Intercontinental Exchange, Inc.
- Subject to complex regulations across multiple jurisdictions, especially in derivatives.
5. Supply Chain & Operations
S&P Global Inc.
- Relies on high-quality data inputs; operational risk in data integrity and tech infrastructure.
Intercontinental Exchange, Inc.
- Operational complexity from managing exchanges, clearinghouses, and mortgage platforms.
6. ESG & Climate Transition
S&P Global Inc.
- Developing ESG analytics offers growth but execution risk remains high.
Intercontinental Exchange, Inc.
- Increasing regulatory pressure on ESG disclosures impacts compliance costs.
7. Geopolitical Exposure
S&P Global Inc.
- Global footprint exposes it to geopolitical risks but diversified markets.
Intercontinental Exchange, Inc.
- Exposure concentrated in US, UK, EU, and select markets, vulnerable to policy shifts.
Which company shows a better risk-adjusted profile?
S&P Global’s chief risk lies in its stretched valuation and market volatility, while ICE faces leverage and regulatory complexity risks. ICE’s stronger operational diversification and lower stock volatility grant it a marginally better risk-adjusted profile despite financial leverage concerns. The Altman Z-Score divergence highlights ICE’s financial distress risks versus SPGI’s safer zone, demanding cautious monitoring.
Final Verdict: Which stock to choose?
S&P Global Inc. wields unmatched efficiency as its superpower, translating high margins into consistent cash flow. Its main point of vigilance remains a below-par current ratio, signaling liquidity risk. This stock suits portfolios aiming for aggressive growth with tolerance for operational leverage.
Intercontinental Exchange, Inc. commands a strategic moat through its recurring revenue streams and operational stability. Compared to S&P Global, it offers better liquidity and a slightly safer financial profile. ICE fits well within GARP portfolios seeking steady growth at a reasonable valuation.
If you prioritize aggressive growth and operational efficiency, S&P Global appears compelling due to superior cash flow generation. However, if you seek stability with moderate growth and a more balanced risk profile, Intercontinental Exchange offers better downside protection and recurring revenue advantages. Both stocks carry risks, demanding careful alignment with investor risk tolerance.
Disclaimer: Investment carries a risk of loss of initial capital. The past performance is not a reliable indicator of future results. Be sure to understand risks before making an investment decision.
Go Further
I encourage you to read the complete analyses of S&P Global Inc. and Intercontinental Exchange, Inc. to enhance your investment decisions: