Home > Comparison > Financial Services > ICE vs NDAQ
The strategic rivalry between Intercontinental Exchange, Inc. (ICE) and Nasdaq, Inc. defines the current trajectory of the financial data and stock exchanges sector. ICE operates as a diversified marketplace operator with a capital-intensive model spanning exchanges, clearing houses, and mortgage technology. Nasdaq focuses on technology-driven market services and SaaS solutions for compliance and investment intelligence. This analysis will determine which corporate strategy delivers superior risk-adjusted returns for a balanced portfolio.

Table of contents
Companies Overview
Intercontinental Exchange and Nasdaq dominate the global financial data and stock exchange landscape with robust market footprints.
Intercontinental Exchange, Inc.: Global Exchange and Data Powerhouse
Intercontinental Exchange, Inc. stands as a leading operator of regulated exchanges and clearing houses across multiple continents. Its core revenue derives from trading, clearing, and listing services spanning commodities, financial derivatives, and equity markets. In 2026, ICE strategically emphasizes expanding its fixed income and mortgage technology segments to diversify beyond traditional exchange revenues.
Nasdaq, Inc.: Technology-Driven Market Innovator
Nasdaq, Inc. identifies primarily as a technology company serving global capital markets. It generates income through market technology solutions, investment intelligence, and market services including trading and clearing across diverse asset classes. Nasdaq’s 2026 focus sharpens on enhancing anti-financial crime SaaS platforms and broadening its corporate platform services for investor relations and governance.
Strategic Collision: Similarities & Divergences
Both firms compete fiercely in financial markets infrastructure but diverge in approach: ICE relies on a regulated exchange and clearing ecosystem, while Nasdaq integrates cutting-edge technology solutions and SaaS offerings. Their battle centers on market data, trading volume, and clearing dominance. Investors face distinct profiles—ICE’s broad asset class exposure contrasts with Nasdaq’s innovation-driven growth model.
Income Statement Comparison
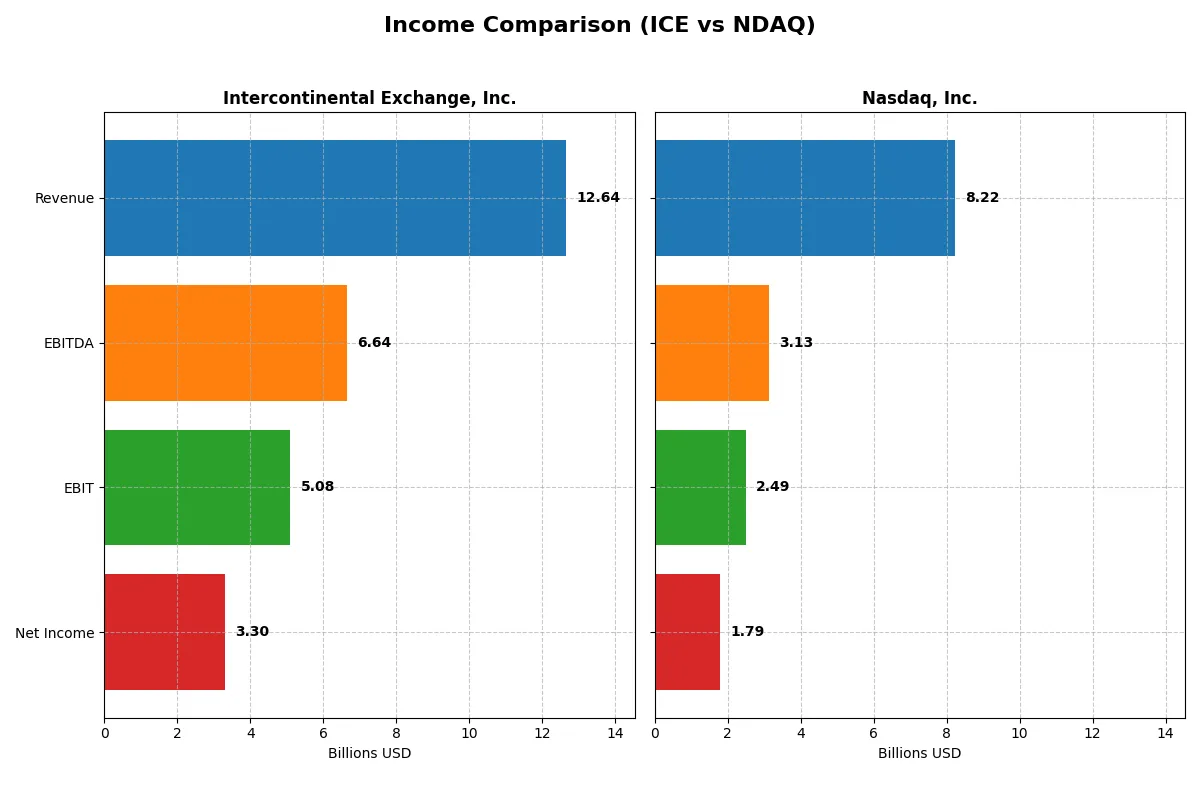
This table dissects the core profitability and scalability of both corporate engines to reveal who dominates the bottom line:
| Metric | Intercontinental Exchange (ICE) | Nasdaq (NDAQ) |
|---|---|---|
| Revenue | 12.6B | 8.2B |
| Cost of Revenue | 4.8B | 4.3B |
| Operating Expenses | 2.9B | 1.6B |
| Gross Profit | 7.8B | 3.9B |
| EBITDA | 6.6B | 3.1B |
| EBIT | 5.1B | 2.5B |
| Interest Expense | 781M | 88M |
| Net Income | 3.3B | 1.8B |
| EPS | 5.8 | 3.13 |
| Fiscal Year | 2025 | 2025 |
Income Statement Analysis: The Bottom-Line Duel
This income statement comparison reveals which company runs its business most efficiently and delivers superior profitability to shareholders.
Intercontinental Exchange, Inc. Analysis
ICE’s revenue climbed steadily from 9.2B in 2021 to 12.6B in 2025, showing solid top-line growth. Net income peaked at 4.1B in 2021 but declined to 3.3B by 2025. Its gross margin remains robust at nearly 62%, while net margin of 26% signals strong profitability. In 2025, ICE demonstrated momentum with a 12% EBIT growth and a 21% EPS surge, though overall net income fell over five years.
Nasdaq, Inc. Analysis
Nasdaq’s revenue rose from 5.9B in 2021 to 8.2B in 2025, reflecting faster growth than ICE. Net income expanded consistently, reaching 1.8B in 2025 from 1.2B in 2021. The company maintains a healthy gross margin of 48% and net margin near 22%. Nasdaq posted impressive momentum in 2025, with a 35% EBIT increase and a remarkable 60% jump in EPS, underscoring operational efficiency and accelerating profitability.
Margin Strength vs. Growth Momentum
ICE offers superior margins, with a 62% gross and 26% net margin, reflecting solid operational control. Nasdaq delivers faster top-line and bottom-line growth, with a 40% net income increase over five years versus ICE’s decline. Nasdaq’s sharp EPS and EBIT gains highlight stronger momentum. For investors, ICE’s margin strength suits stability seekers, while Nasdaq’s growth profile appeals to those favoring dynamic expansion.
Financial Ratios Comparison
These vital ratios act as a diagnostic tool to expose the underlying fiscal health, valuation premiums, and capital efficiency of the companies compared below:
| Ratios | Intercontinental Exchange (ICE) | Nasdaq, Inc. (NDAQ) |
|---|---|---|
| ROE | 11.4% | 14.6% |
| ROIC | 7.0% | 8.3% |
| P/E | 28.0 | 31.0 |
| P/B | 3.20 | 4.53 |
| Current Ratio | 1.02 | 1.01 |
| Quick Ratio | 1.02 | 1.01 |
| D/E | 0.70 | 0.81 |
| Debt-to-Assets | 14.8% | 32.0% |
| Interest Coverage | 6.27 | 26.5 |
| Asset Turnover | 0.092 | 0.26 |
| Fixed Asset Turnover | 4.70 | 6.99 |
| Payout Ratio | 33.4% | 33.6% |
| Dividend Yield | 1.19% | 1.08% |
| Fiscal Year | 2025 | 2025 |
Efficiency & Valuation Duel: The Vital Signs
Financial ratios act as the company’s DNA, uncovering hidden risks and spotlighting operational strengths critical to investment decisions.
Intercontinental Exchange, Inc.
ICE posts a solid net margin of 26.14% with a neutral 11.43% ROE and 7.03% ROIC, slightly above its 7.44% WACC. The stock trades at a stretched 28 P/E and 3.2 P/B ratios, signaling premium valuation. Shareholders receive a modest 1.19% dividend yield, reflecting steady income and balanced capital allocation.
Nasdaq, Inc.
NDAQ delivers a favorable 21.77% net margin and a higher 14.63% ROE, with an 8.26% ROIC also neutral relative to its 7.44% WACC. The valuation is stretched at nearly 31 P/E and 4.53 P/B. Its 1.08% dividend yield suggests modest shareholder returns amid a focus on efficient capital use and growth discipline.
Premium Valuation vs. Operational Safety
Both ICE and NDAQ display slightly favorable ratio profiles with stretched valuations above 28 P/E. ICE offers a stronger margin and lower debt burden, while NDAQ boasts better returns on equity and capital employed. Investors seeking income stability might prefer ICE’s dividend, while those favoring operational efficiency could lean toward NDAQ’s robust ROE.
Which one offers the Superior Shareholder Reward?
Intercontinental Exchange (ICE) offers a more balanced and sustainable shareholder reward compared to Nasdaq (NDAQ). ICE yields 1.2% with a moderate payout ratio (~33-38%) and robust free cash flow coverage (~92%). Its buyback activity is substantial, enhancing total returns. Nasdaq pays a slightly lower yield (~1.08-1.22%) with a similar payout ratio but shows less free cash flow coverage (~88%) and a smaller buyback footprint. ICE’s model blends dividends and buybacks with strong cash flow, making it superior for long-term value creation in 2026.
Comparative Score Analysis: The Strategic Profile
The radar chart reveals the fundamental DNA and trade-offs of Intercontinental Exchange and Nasdaq, highlighting their operational strengths and valuation challenges:
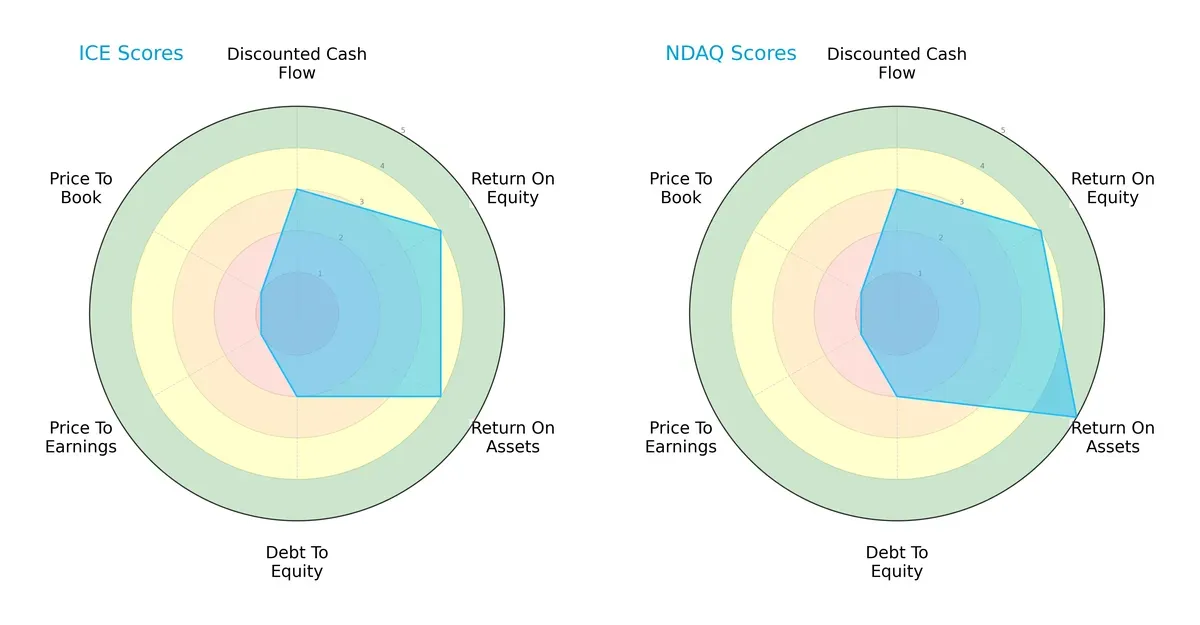
Both firms share moderate discounted cash flow scores and favorable return on equity. Nasdaq edges ahead with a superior return on assets score (5 vs. 4), signaling more efficient asset use. Both carry unfavorable debt-to-equity scores (2), suggesting elevated leverage risk. Valuation metrics (PE/PB) score very low (1) for both, indicating expensive pricing. Overall, Nasdaq offers a slightly more balanced profile, while ICE relies more heavily on equity and asset returns amid valuation pressures.
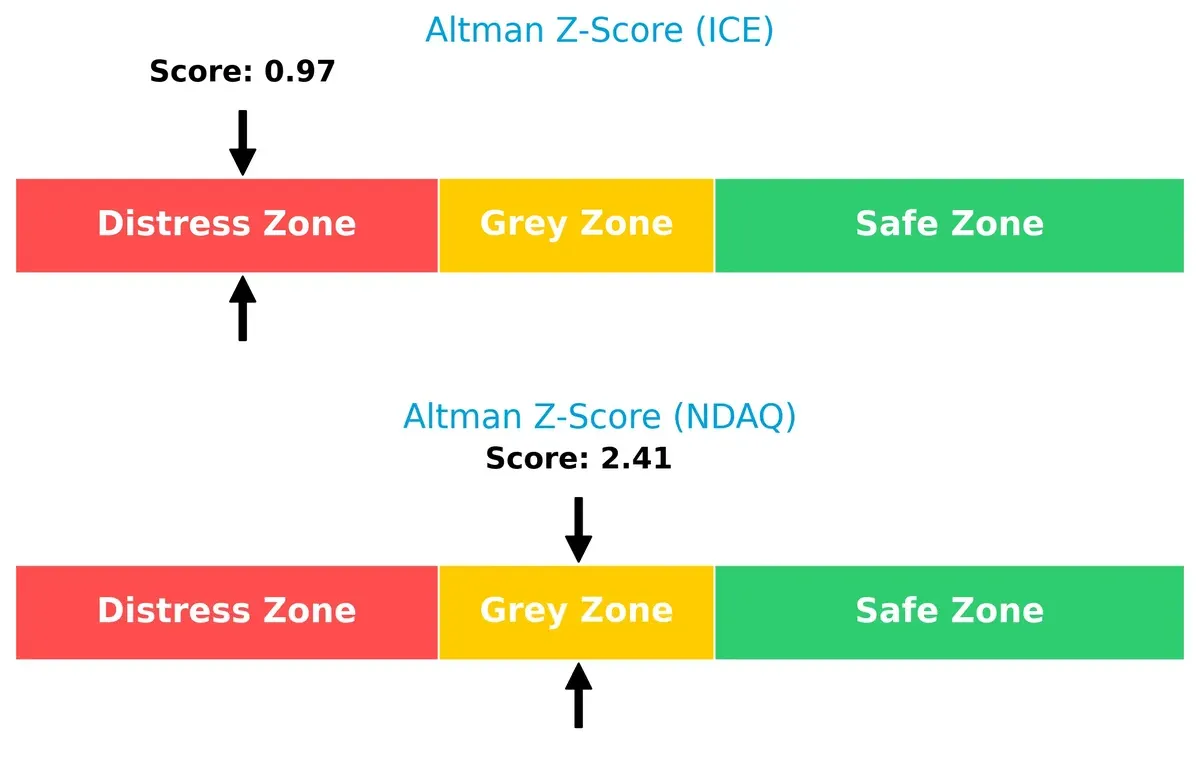
Bankruptcy Risk: Solvency Showdown
Nasdaq’s Altman Z-Score of 2.41 places it in the grey zone, indicating moderate bankruptcy risk, while ICE’s 0.97 signals distress and heightened insolvency risk in this cycle:
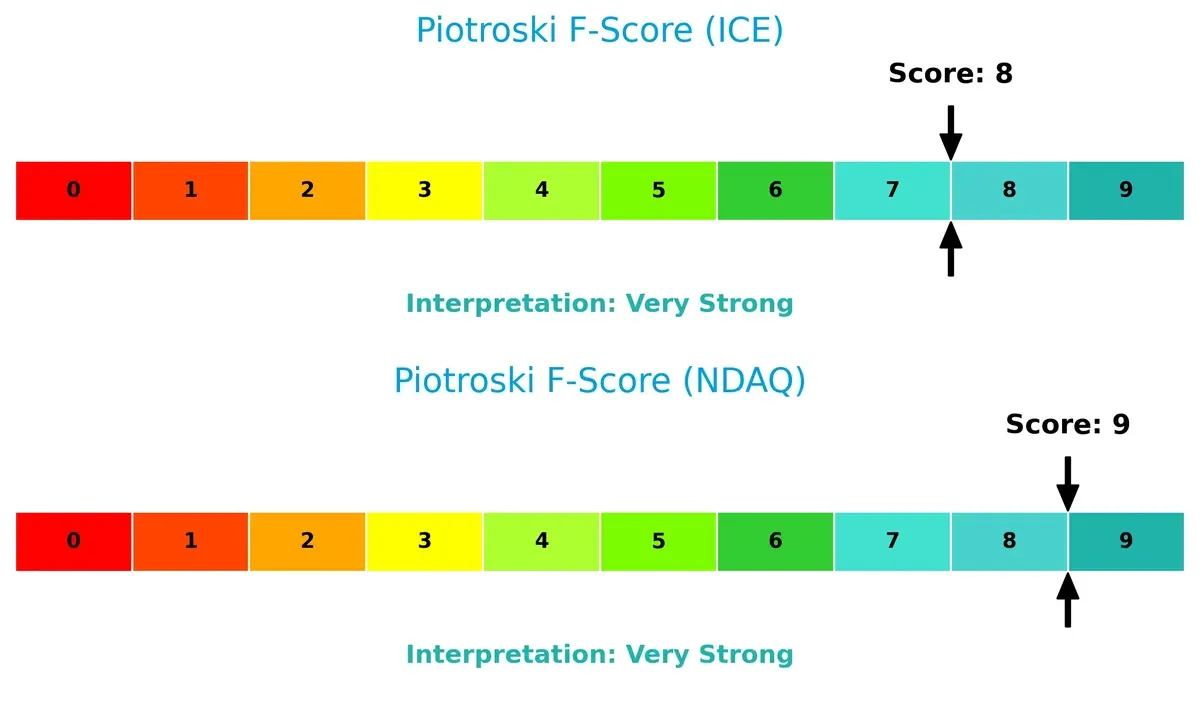
Financial Health: Quality of Operations
Both companies exhibit very strong Piotroski F-Scores, with Nasdaq at 9 and ICE at 8, reflecting robust internal financial health and operational quality. No immediate red flags emerge from their internal metrics:
How are the two companies positioned?
This section dissects ICE and NDAQ’s operational DNA by comparing revenue distribution and internal strengths and weaknesses. The goal is to confront their economic moats to reveal which business model offers the most resilient, sustainable advantage today.
Revenue Segmentation: The Strategic Mix
This comparison dissects how Intercontinental Exchange, Inc. and Nasdaq, Inc. diversify their income streams and reveals their dominant sector bets:
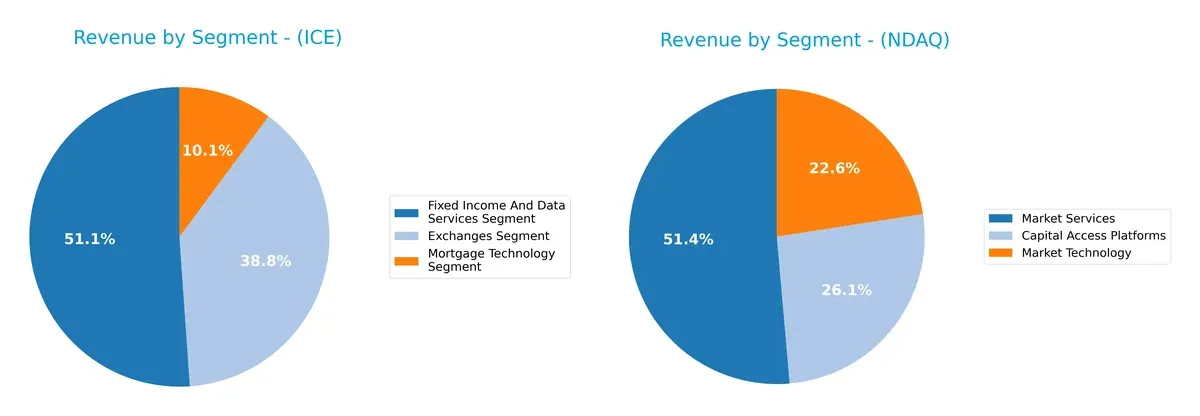
Intercontinental Exchange pivots on Fixed Income and Data Services at $1.36B, with Exchanges trailing at $1.03B and Mortgage Technology at $269M. Nasdaq anchors its revenue in Market Services at $4.21B, dwarfing Capital Access Platforms ($2.14B) and Market Technology ($1.85B). ICE’s balanced spread reduces concentration risk. Nasdaq’s heavy reliance on Market Services offers infrastructure dominance but increases vulnerability to that segment’s fluctuations.
Strengths and Weaknesses Comparison
This table compares the strengths and weaknesses of ICE and NDAQ based on diversification, profitability, financials, innovation, global presence, and market share:
ICE Strengths
- Diverse revenue streams across Exchanges, Fixed Income, and Mortgage Technology
- Favorable net margin at 26.14%
- Strong interest coverage at 6.51
- Favorable fixed asset turnover at 4.7
- Significant revenue from US and Europe combined
NDAQ Strengths
- Solid revenue diversification in Capital Access, Market Technology, and Services
- Favorable net margin at 21.77%
- Very strong interest coverage at 28.34
- Highest fixed asset turnover at 6.99
- Large US revenue base with notable non-US contribution
ICE Weaknesses
- Unfavorable P/E at 28.0 and P/B at 3.2
- Neutral ROIC below WACC at 7.03% vs 7.44%
- Low asset turnover at 0.09 limits operational efficiency
- Current ratio barely above 1.0, a neutral liquidity sign
- Debt-to-assets low but limits financial leverage
NDAQ Weaknesses
- Higher P/E and P/B ratios less attractive at 30.98 and 4.53
- Neutral ROIC at 8.26% close to WACC at 7.44%
- Asset turnover of 0.26 still low for sector standards
- Current ratio near 1.0, indicating tight liquidity
- Higher debt-to-assets ratio at 31.97%, increasing leverage risk
Both companies show slightly favorable financial profiles with diversified revenue bases and strong interest coverage ratios. ICE demonstrates a broader segment spread and European exposure, while NDAQ presents higher operational efficiency and leverage. Each faces valuation multiples above sector averages and modest liquidity, factors requiring monitoring within their strategic and capital allocation frameworks.
The Moat Duel: Analyzing Competitive Defensibility
A structural moat is the only shield protecting long-term profits from relentless competitive erosion. Let’s dissect the sources of competitive advantage for these two financial exchange giants:
Intercontinental Exchange, Inc. (ICE): Intangible Assets and Market Reach Moat
ICE leverages intangible assets and regulatory licenses to secure dominant exchange and clearing operations. Its high 40% EBIT margin reflects margin stability. Expansion into mortgage tech deepens this moat but competition in data services pressures growth in 2026.
Nasdaq, Inc. (NDAQ): Technology-Driven Network Effects Moat
Nasdaq’s moat centers on technology-enabled market platforms and anti-financial crime SaaS solutions, differentiating it from ICE’s asset-heavy model. It delivers strong revenue and net income growth, but a slight ROIC decline signals caution. Opportunities lie in expanding data analytics and global listings.
Market Access vs. Tech Innovation: The Moat Showdown
ICE’s moat is broader, supported by regulatory licenses across multiple asset classes and geographies. Nasdaq’s moat is narrower but benefits from scalable tech platforms. ICE is better positioned to defend market share long term, while Nasdaq must innovate aggressively to sustain its edge.
Which stock offers better returns?
The stock prices of Intercontinental Exchange, Inc. (ICE) and Nasdaq, Inc. (NDAQ) showed significant gains over the past 12 months, with recent downward corrections impacting short-term dynamics.
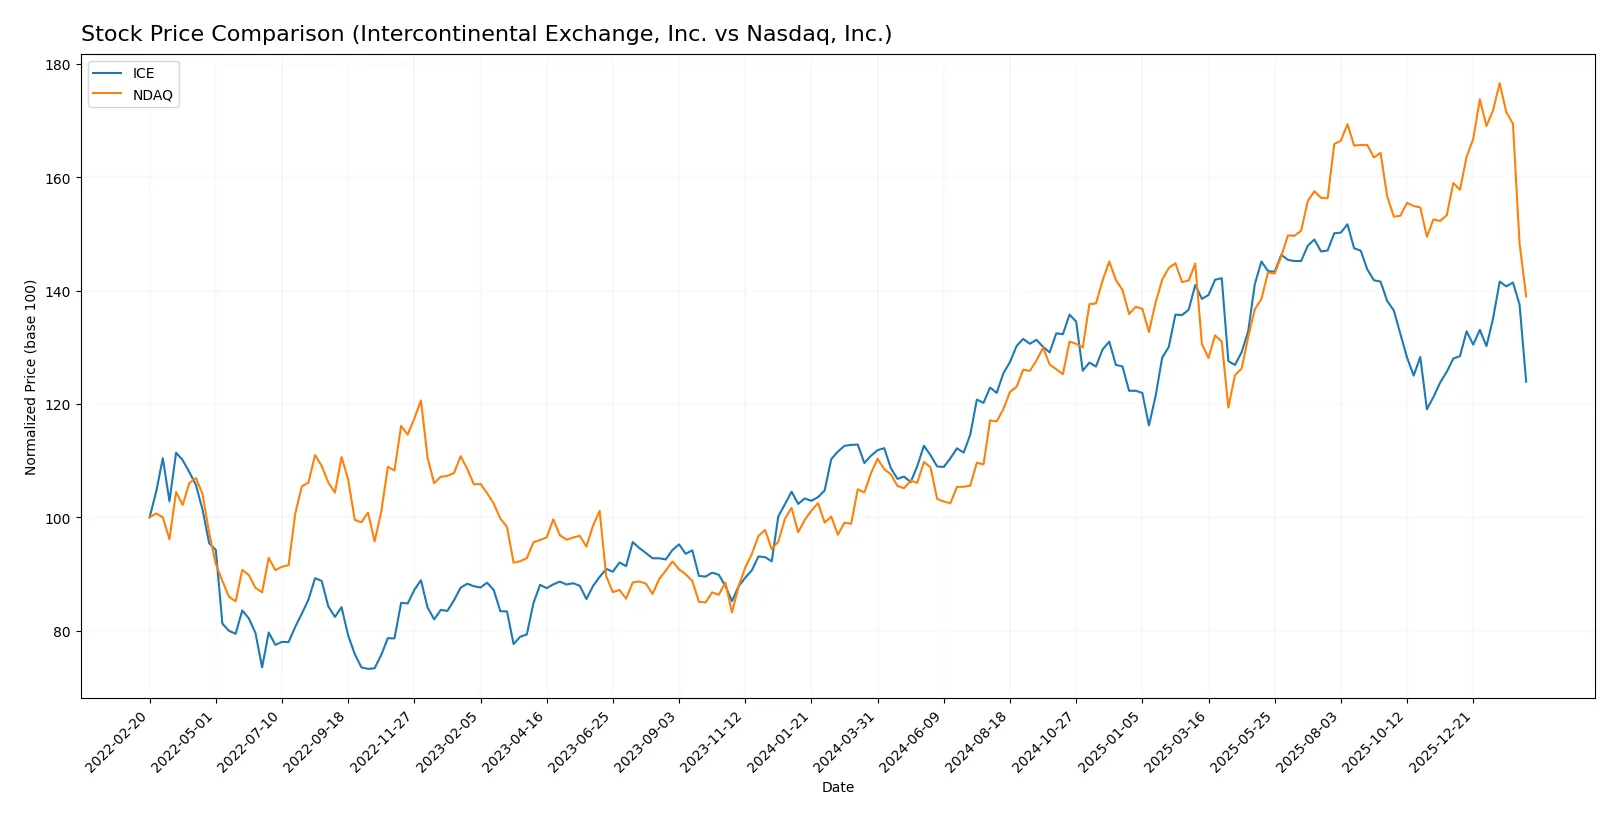
Trend Comparison
Intercontinental Exchange, Inc. (ICE) gained 11.78% over the past year, reflecting a bullish trend with accelerating momentum. The price fluctuated between 130.5 and 186.4, showing moderate volatility (std dev 14.63).
Nasdaq, Inc. (NDAQ) rose 28.95% over the same period, also bullish but with decelerating gains. The stock ranged from 58.6 to 100.98 and exhibited lower volatility (std dev 11.69) than ICE.
NDAQ outperformed ICE in total market returns despite decelerating momentum, delivering the highest gains over the last 12 months.
Target Prices
Analysts project moderate upside for both Intercontinental Exchange, Inc. and Nasdaq, Inc. based on current valuations.
| Company | Target Low | Target High | Consensus |
|---|---|---|---|
| Intercontinental Exchange, Inc. | 180 | 211 | 193.67 |
| Nasdaq, Inc. | 100 | 120 | 111.8 |
The target consensus for ICE stands roughly 27% above its current price of 152.28, indicating confidence in growth. Nasdaq’s consensus target is about 41% higher than its current 79.47 price, signaling strong analyst optimism.

Don’t Let Luck Decide Your Entry Point
Optimize your entry points with our advanced ProRealTime indicators. You’ll get efficient buy signals with precise price targets for maximum performance. Start outperforming now!
How do institutions grade them?
Intercontinental Exchange, Inc. Grades
The following table summarizes recent institutional grades for Intercontinental Exchange, Inc.:
| Grading Company | Action | New Grade | Date |
|---|---|---|---|
| Morgan Stanley | Maintain | Equal Weight | 2026-02-10 |
| Barclays | Maintain | Overweight | 2026-02-06 |
| Morgan Stanley | Maintain | Equal Weight | 2026-01-15 |
| Piper Sandler | Maintain | Overweight | 2026-01-14 |
| TD Cowen | Maintain | Buy | 2026-01-14 |
| Barclays | Maintain | Overweight | 2026-01-08 |
| UBS | Maintain | Buy | 2026-01-07 |
| Morgan Stanley | Maintain | Equal Weight | 2025-12-22 |
| JP Morgan | Maintain | Overweight | 2025-10-31 |
| UBS | Maintain | Buy | 2025-10-31 |
Nasdaq, Inc. Grades
Below is the table showing recent institutional grades for Nasdaq, Inc.:
| Grading Company | Action | New Grade | Date |
|---|---|---|---|
| Barclays | Maintain | Overweight | 2026-01-30 |
| Morgan Stanley | Maintain | Overweight | 2026-01-30 |
| RBC Capital | Maintain | Outperform | 2026-01-30 |
| TD Cowen | Maintain | Hold | 2026-01-30 |
| JP Morgan | Maintain | Overweight | 2026-01-30 |
| Morgan Stanley | Maintain | Overweight | 2026-01-15 |
| TD Cowen | Maintain | Hold | 2026-01-14 |
| UBS | Maintain | Buy | 2026-01-12 |
| JP Morgan | Maintain | Overweight | 2026-01-12 |
| Barclays | Maintain | Overweight | 2026-01-08 |
Which company has the best grades?
Nasdaq, Inc. holds generally higher grades, including “Outperform” and multiple “Overweight” ratings, compared to Intercontinental Exchange’s mix of “Equal Weight,” “Overweight,” and “Buy.” Investors may interpret Nasdaq’s stronger consensus as a signal of greater institutional confidence.
Risks specific to each company
The following categories identify the critical pressure points and systemic threats facing both firms in the 2026 market environment:
1. Market & Competition
Intercontinental Exchange, Inc. (ICE)
- Operates multiple regulated exchanges and diversified market segments, facing intense competition in derivatives and fixed income.
Nasdaq, Inc. (NDAQ)
- Strong in technology-driven market services with broad global listings, competing aggressively in market tech and data analytics.
2. Capital Structure & Debt
Intercontinental Exchange, Inc. (ICE)
- Moderate debt-to-equity ratio (0.7) with favorable interest coverage (6.51), indicating manageable leverage.
Nasdaq, Inc. (NDAQ)
- Higher debt-to-equity ratio (0.81) and stronger interest coverage (28.34), reflecting heavier but well-covered debt load.
3. Stock Volatility
Intercontinental Exchange, Inc. (ICE)
- Beta of 1.033 suggests slightly above-market volatility, consistent with sector norms.
Nasdaq, Inc. (NDAQ)
- Beta of 1.024 shows near-market volatility, marginally more stable than ICE.
4. Regulatory & Legal
Intercontinental Exchange, Inc. (ICE)
- Subject to extensive regulation across multiple jurisdictions, increasing compliance costs and legal risks.
Nasdaq, Inc. (NDAQ)
- Faces complex regulatory environments globally, with added scrutiny on technology-driven financial services.
5. Supply Chain & Operations
Intercontinental Exchange, Inc. (ICE)
- Operations spread over multiple asset classes and regions, exposing it to operational interruptions.
Nasdaq, Inc. (NDAQ)
- Relies heavily on technology platforms, making it vulnerable to cyber risks and tech disruptions.
6. ESG & Climate Transition
Intercontinental Exchange, Inc. (ICE)
- Increasing ESG pressures on commodity and energy markets it operates; transition risks are notable.
Nasdaq, Inc. (NDAQ)
- Faces ESG scrutiny primarily on governance and data privacy, with growing climate transition demands.
7. Geopolitical Exposure
Intercontinental Exchange, Inc. (ICE)
- Exposure to US, UK, EU, and Asian markets subjects it to geopolitical tensions and regulatory divergences.
Nasdaq, Inc. (NDAQ)
- Global footprint with major listings in the US and Europe exposes it to geopolitical and economic policy risks.
Which company shows a better risk-adjusted profile?
ICE’s most impactful risk is its fragile financial distress signal via a low Altman Z-score, despite strong operational breadth. Nasdaq’s primary concern lies in its heavier debt load, albeit with excellent interest coverage and stronger asset efficiency. Nasdaq edges ICE with a more balanced risk profile, supported by superior financial strength scores and operational leverage. Recent Altman Z-score data underlines ICE’s vulnerability to financial distress, demanding cautious risk monitoring.
Final Verdict: Which stock to choose?
Intercontinental Exchange, Inc. (ICE) excels as a cash-generating powerhouse with robust operating margins and improving profitability. Its growing ROIC signals potential value creation despite currently shedding value. A point of vigilance remains its moderate leverage and distressed Altman Z-score. ICE suits portfolios focused on resilient income and selective growth.
Nasdaq, Inc. (NDAQ) boasts a strategic moat through strong asset utilization and superior interest coverage, reflecting efficient capital management. Its favorable free cash flow growth and very strong Piotroski score highlight financial strength. Compared to ICE, NDAQ offers better stability but faces challenges in declining ROIC. It fits well with GARP investors seeking balanced growth and safety.
If you prioritize durable cash flow and improving profitability, ICE is the compelling choice due to its rising returns and operational strength. However, if you seek steadier financial health and superior asset efficiency, NDAQ offers better stability and a stronger safety profile. Both stocks demand caution given their signs of value destruction and valuation premiums.
Disclaimer: Investment carries a risk of loss of initial capital. The past performance is not a reliable indicator of future results. Be sure to understand risks before making an investment decision.
Go Further
I encourage you to read the complete analyses of Intercontinental Exchange, Inc. and Nasdaq, Inc. to enhance your investment decisions: