Home > Comparison > Financial Services > ICE vs MSCI
The strategic rivalry between Intercontinental Exchange, Inc. and MSCI Inc. shapes the landscape of financial data and market infrastructure. ICE operates as a capital-intensive exchange and clearing powerhouse, while MSCI delivers high-margin, technology-driven investment analytics and indices. This clash highlights a contrast between physical market operations and digital asset intelligence. This analysis aims to identify which business model offers superior risk-adjusted returns for a diversified portfolio in financial services.
Table of contents
Companies Overview
Intercontinental Exchange and MSCI stand as pivotal players in the financial data and exchange sector, shaping global investment landscapes.
Intercontinental Exchange, Inc.: Exchange and Clearing Powerhouse
Intercontinental Exchange dominates as an operator of regulated exchanges and clearing houses across multiple continents. It generates revenue through trading venues, futures and options products, and data services spanning commodities, equities, fixed income, and mortgage technology. In 2026, its strategic focus centers on expanding its fixed income and mortgage technology platforms to deepen market penetration and diversify income streams.
MSCI Inc.: Premier Investment Decision Support Provider
MSCI leads as a provider of investment decision tools worldwide, with revenue driven by indexes, analytics, ESG, and private asset data services. Its core products support portfolio construction, risk management, and ESG integration for institutional investors. The company’s 2026 strategy emphasizes enhancing ESG and climate-related offerings to meet rising regulatory demands and investor preferences.
Strategic Collision: Similarities & Divergences
Both firms excel in financial data but diverge in their business models: Intercontinental Exchange focuses on market infrastructure and trading, while MSCI prioritizes analytics and ESG insights. They compete primarily in serving institutional investors’ needs but target distinct segments—ICE commands trading and clearing dominance; MSCI leads in risk analytics and sustainable investing tools. Their investment profiles reflect this split between transaction-based revenues and subscription-based model stability.
Income Statement Comparison
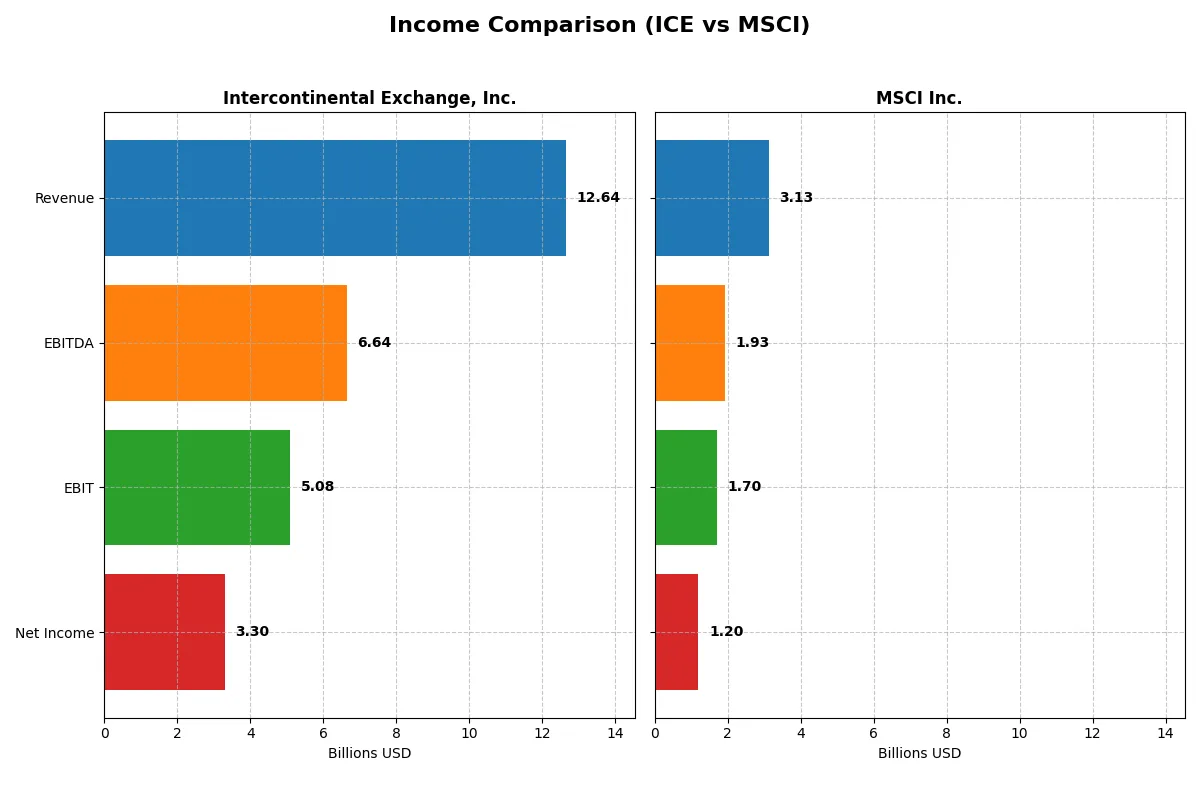
This data dissects the core profitability and scalability of both corporate engines to reveal who dominates the bottom line:
| Metric | Intercontinental Exchange (ICE) | MSCI Inc. (MSCI) |
|---|---|---|
| Revenue | 12.6B | 3.13B |
| Cost of Revenue | 4.82B | 550M |
| Operating Expenses | 2.93B | 871M |
| Gross Profit | 7.82B | 2.58B |
| EBITDA | 6.64B | 1.93B |
| EBIT | 5.08B | 1.70B |
| Interest Expense | 781M | 210M |
| Net Income | 3.30B | 1.20B |
| EPS | 5.8 | 15.58 |
| Fiscal Year | 2025 | 2025 |
Income Statement Analysis: The Bottom-Line Duel
This income statement comparison reveals how efficiently Intercontinental Exchange and MSCI convert revenue into profit, showcasing their operational strength.
Intercontinental Exchange, Inc. Analysis
ICE’s revenue rose steadily from 9.2B in 2021 to 12.6B in 2025, a 38% increase. Net income, however, dipped overall, ending at 3.3B in 2025. Its gross margin holds strong at 61.9%, with a net margin of 26.1%, reflecting solid profitability despite some margin contraction over five years. The 2025 year showed efficiency gains, with a 12% EBIT increase and a 20.7% EPS jump, signaling momentum.
MSCI Inc. Analysis
MSCI’s revenue surged from 2B in 2021 to 3.1B in 2025, growing 53%. Net income jumped 66% to 1.2B, supported by a robust gross margin of 82.4% and a healthy net margin of 38.4%. Operating expenses scaled well with revenue growth, boosting EBIT by over 10% in 2025. Despite a slight 1.2% dip in net margin last year, its EPS rose 10.8%, sustaining strong profitability momentum.
Margin Power vs. Revenue Scale
MSCI outperforms ICE on margin efficiency and net income growth, with superior profitability ratios and a sharper EPS rise. ICE shows impressive revenue scale and solid margin levels but struggles with net income consistency. Investors seeking margin dominance and earnings growth might prefer MSCI’s profile, while ICE appeals more to those valuing revenue expansion with moderate margin trade-offs.
Financial Ratios Comparison
These vital ratios act as a diagnostic tool to expose the underlying fiscal health, valuation premiums, and capital efficiency of the companies compared below:
| Ratios | Intercontinental Exchange (ICE) | MSCI Inc. (MSCI) |
|---|---|---|
| ROE | 11.4% | -45.3% |
| ROIC | 7.0% | 35.6% |
| P/E | 28.0 | 36.8 |
| P/B | 3.20 | -16.7 |
| Current Ratio | 1.02 | 0.90 |
| Quick Ratio | 1.02 | 0.90 |
| D/E | 0.70 | -2.42 |
| Debt-to-Assets | 14.8% | 113% |
| Interest Coverage | 6.27 | 8.16 |
| Asset Turnover | 0.09 | 0.55 |
| Fixed Asset Turnover | 4.70 | 15.7 |
| Payout ratio | 33.4% | 46.3% |
| Dividend yield | 1.19% | 1.26% |
| Fiscal Year | 2025 | 2025 |
Efficiency & Valuation Duel: The Vital Signs
Ratios act as a company’s DNA, revealing hidden risks and operational excellence that define its true market stance.
Intercontinental Exchange, Inc.
ICE shows solid profitability with an 11.43% ROE and a strong 26.14% net margin, reflecting efficient operations. However, its P/E of 28.0 signals a somewhat stretched valuation. ICE balances this with a 1.19% dividend yield, offering steady shareholder returns alongside prudent capital management.
MSCI Inc.
MSCI posts a robust 38.36% net margin and an impressive 35.6% ROIC, yet a deeply negative ROE of -45.29% flags financial distress. Its P/E of 36.82 implies it trades at a premium. MSCI maintains shareholder value through a modest 1.26% dividend despite elevated debt levels, suggesting riskier capital structure.
Premium Valuation vs. Operational Safety
Both firms present slightly favorable ratios, but ICE offers a more balanced risk-reward profile with stable returns and moderate leverage. MSCI’s high margins contrast sharply with its negative ROE and stretched balance sheet. Investors prioritizing operational safety may lean toward ICE; those chasing growth might consider MSCI’s riskier profile.
Which one offers the Superior Shareholder Reward?
I observe Intercontinental Exchange (ICE) pays a consistent dividend yield around 1.2% with a moderate payout ratio ~33-38%. Its buyback activity remains steady, supporting total returns sustainably. MSCI offers a slightly higher yield near 1.25% but with a payout ratio above 45%, leaning more on dividends. MSCI’s free cash flow per share (~20.1) far exceeds ICE’s (~7.5), enabling robust buybacks that amplify returns. MSCI’s aggressive capital allocation to share repurchases and dividends offers superior total shareholder reward over ICE in 2026, despite higher leverage risks.
Comparative Score Analysis: The Strategic Profile
The radar chart reveals the fundamental DNA and trade-offs of Intercontinental Exchange, Inc. (ICE) and MSCI Inc., highlighting their core financial strengths and weaknesses:
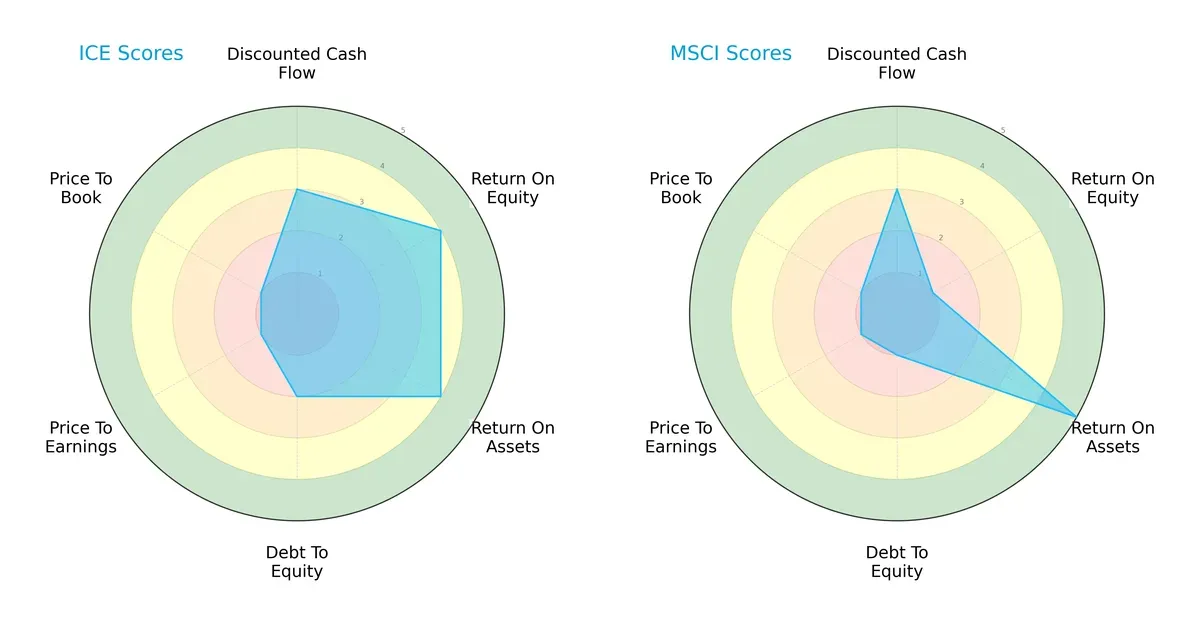
ICE shows a more balanced profile, excelling in return on equity (4) and return on assets (4), while MSCI scores higher on asset utilization (5) but lags significantly in equity returns (1). Both firms face valuation challenges with very unfavorable PE and PB scores (1 each). ICE carries more financial risk with a debt-to-equity score of 2 versus MSCI’s weaker 1, indicating MSCI’s heavier leverage burden.
Bankruptcy Risk: Solvency Showdown
The Altman Z-Score delta between ICE (0.97, distress zone) and MSCI (5.84, safe zone) underscores stark contrasts in solvency risk:
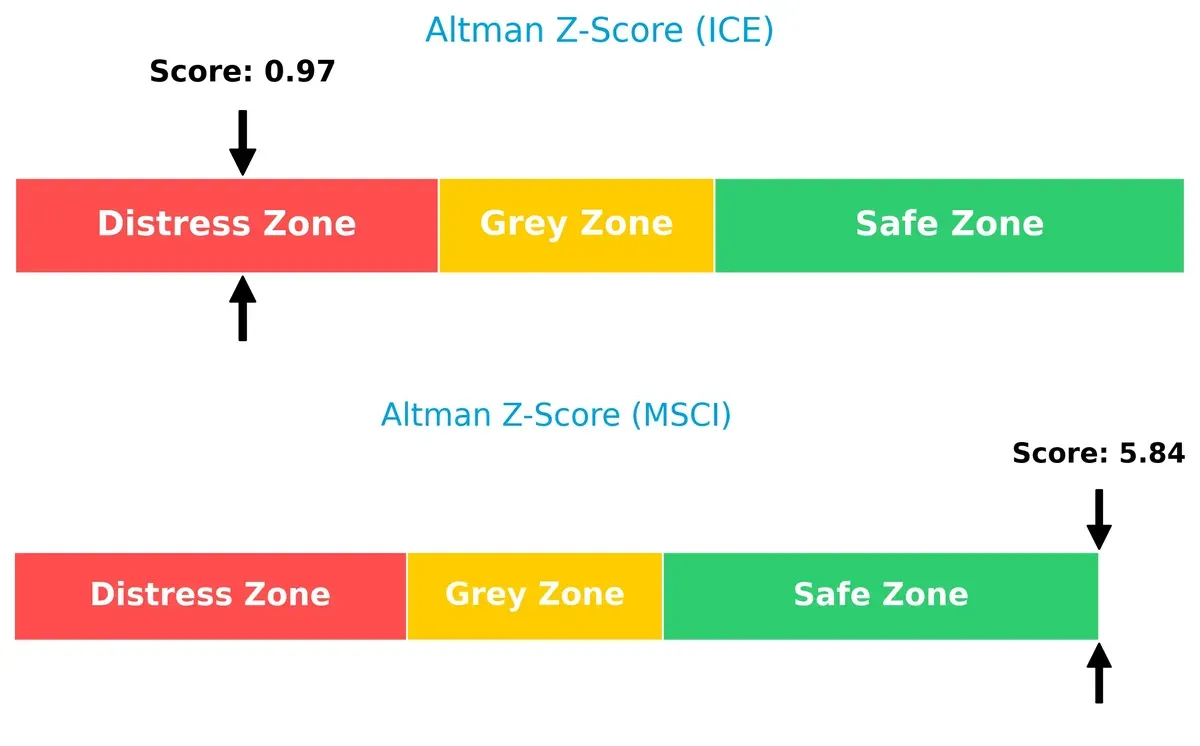
MSCI stands far safer from bankruptcy risk, while ICE signals financial distress, raising red flags for investors wary of long-term survival amid market volatility.
Financial Health: Quality of Operations
Both ICE and MSCI boast strong Piotroski F-Scores of 8, indicating very strong internal financial health and operational quality:
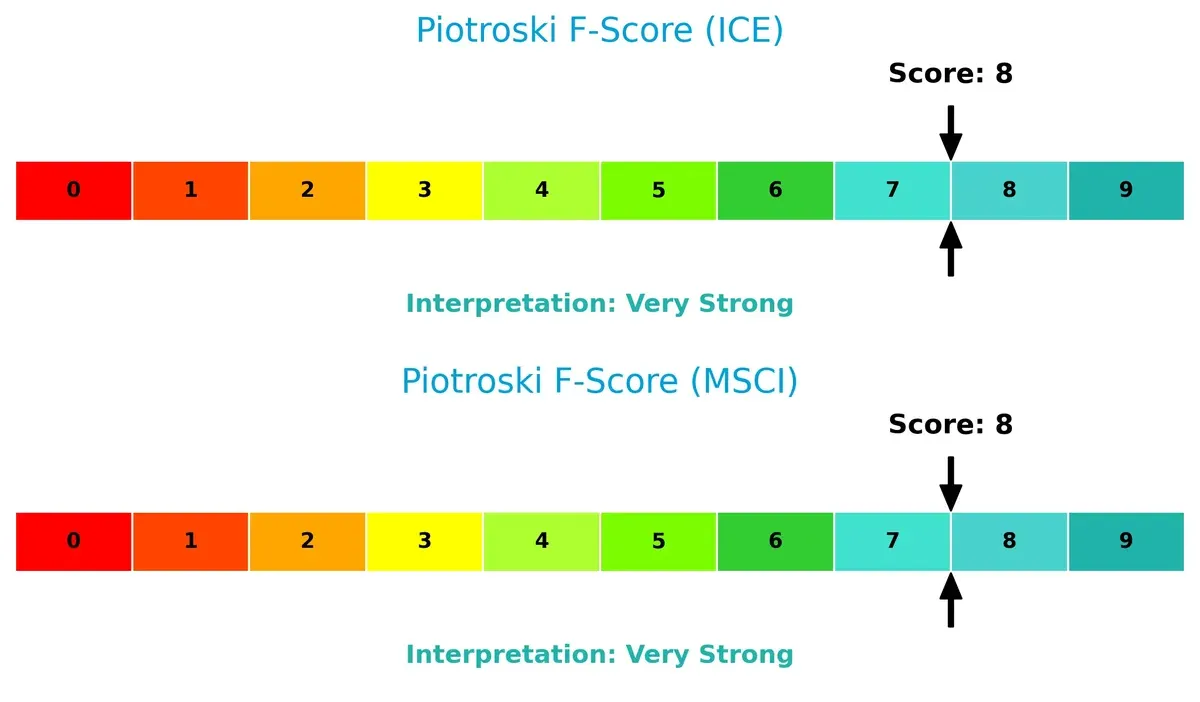
Despite ICE’s solvency concerns, both companies demonstrate robust profitability, liquidity, and efficiency metrics. Neither shows immediate red flags internally, suggesting operational resilience amid differing external financial risk profiles.
How are the two companies positioned?
This section dissects ICE and MSCI’s operational DNA by comparing their revenue distribution and internal dynamics. The goal is to confront their economic moats and reveal which model delivers the most resilient competitive advantage today.
Revenue Segmentation: The Strategic Mix
The following visual comparison dissects how Intercontinental Exchange, Inc. and MSCI Inc. diversify their income streams and where their primary sector bets lie:
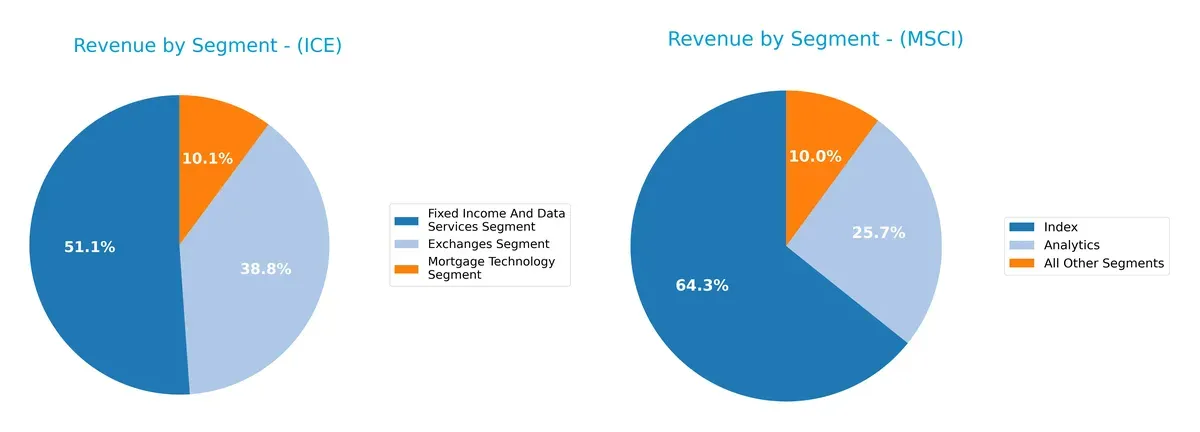
Intercontinental Exchange anchors revenue in Fixed Income and Data Services at $1.36B, followed by Exchanges at $1.03B, showing a balanced yet data-heavy base. MSCI pivots on its Index segment with $1.79B, significantly larger than its Analytics at $714M, revealing a more concentrated model. ICE’s diversification in trading infrastructure and technology reduces risk, while MSCI’s reliance on indexing underscores its strong ecosystem lock-in but elevates concentration risk.
Strengths and Weaknesses Comparison
This table compares the Strengths and Weaknesses of ICE and MSCI based on diversification, profitability, financials, innovation, global presence, and market share:
ICE Strengths
- Diverse revenue streams across exchanges, fixed income, and mortgage technology segments
- Favorable net margin at 26.14%
- Strong interest coverage at 6.51 times
- Low debt to assets ratio at 14.81%
- Solid fixed asset turnover at 4.7
- Balanced global revenue with strong US and European presence
MSCI Strengths
- High net margin at 38.36%
- Exceptional ROIC at 35.6% indicating efficient capital use
- Favorable PB ratio despite negative equity
- Strong interest coverage at 8.12 times
- High fixed asset turnover at 15.66
- Broad geographic diversification including Americas, EMEA, Asia, and Australia
ICE Weaknesses
- PE and PB ratios are unfavorable, suggesting valuation concerns
- Asset turnover is low at 0.09, indicating less efficient asset use
- ROE and ROIC are neutral, signaling average profitability
- Current ratio barely above 1, showing limited short-term liquidity buffer
MSCI Weaknesses
- Negative ROE at -45.29%, a significant profitability red flag
- High debt to assets ratio at 112.54%, indicating heavy leverage
- Current ratio below 1, raising liquidity concerns
- PE ratio is high at 36.82, implying expensive valuation
ICE demonstrates a more balanced financial profile with moderate profitability and conservative leverage. MSCI excels in capital efficiency and profitability but faces risks from weak equity returns and high leverage. These contrasts highlight different strategic focuses and risk exposures.
The Moat Duel: Analyzing Competitive Defensibility
A structural moat is the sole safeguard protecting long-term profits from relentless competition erosion. Let’s dissect the core moats of these two leaders:
Intercontinental Exchange, Inc. (ICE): Network Effects and Market Reach
ICE’s moat stems from its vast regulated exchanges and clearinghouses, creating high switching costs. This manifests in stable 40% EBIT margins and 26% net margins. Expansion in mortgage tech may deepen its moat but rising competition pressures ROIC below WACC.
MSCI Inc.: Intangible Assets and Data Licensing Power
MSCI’s competitive edge lies in proprietary indexes and ESG analytics with strong intellectual property. It commands superior 54% EBIT margins and 38% net margins. Its ROIC exceeds WACC by 26%, signaling robust value creation and growth from expanding ESG and private asset products.
Moat Strength Showdown: Network Effects vs. Intellectual Property
MSCI’s wider and deeper moat outperforms ICE’s network-driven advantage, thanks to substantial ROIC excess and margin expansion. MSCI is better positioned to defend market share amid evolving financial data demands in 2026.
Which stock offers better returns?
The past year reveals a clear divergence in stock performance. Intercontinental Exchange, Inc. (ICE) surged 24.4%, showing accelerating momentum. MSCI Inc. (MSCI) posted a modest 1.61% gain, indicating a subdued uptrend.
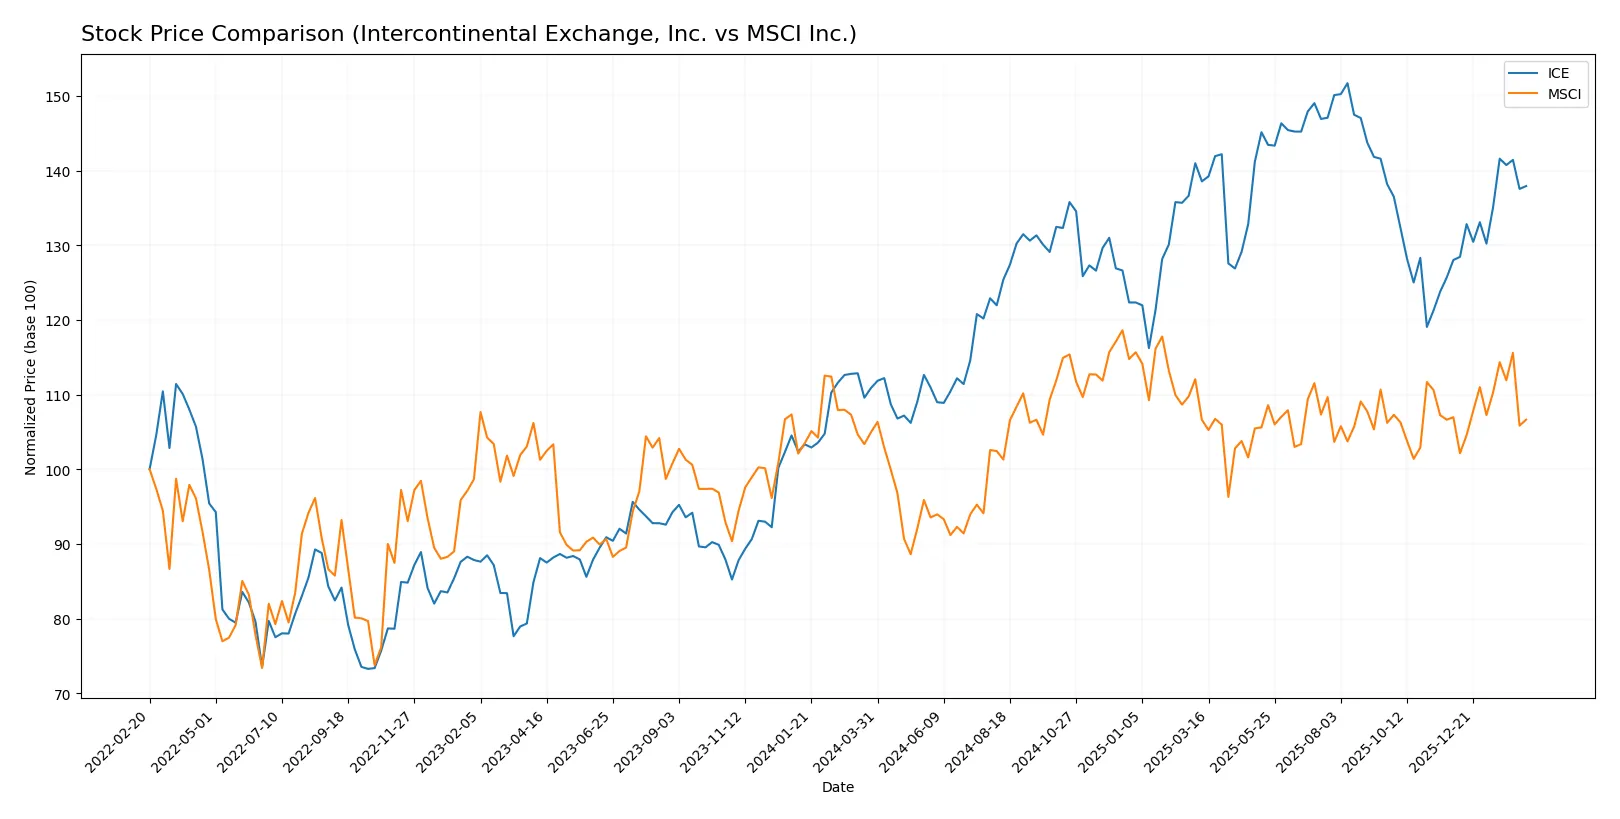
Trend Comparison
ICE’s stock price rose 24.4% over 12 months, marking a bullish trend with acceleration. Volatility is moderate, with a 14.64 standard deviation, and the price peaked at 186.4.
MSCI gained 1.61% in the same period, signaling a neutral trend despite acceleration. It shows higher volatility, with a 35.4 standard deviation, and a high of 625.1.
ICE outperformed MSCI, delivering stronger market returns and a clearer bullish momentum over the past year.
Target Prices
Analysts present a robust target price consensus for Intercontinental Exchange, Inc. and MSCI Inc., reflecting confidence in their growth trajectories.
| Company | Target Low | Target High | Consensus |
|---|---|---|---|
| Intercontinental Exchange, Inc. | 180 | 211 | 192.33 |
| MSCI Inc. | 618 | 715 | 664.5 |
The consensus targets for ICE and MSCI exceed their current prices by 13.6% and 18.3%, respectively, signaling healthy upside potential relative to the market.

Don’t Let Luck Decide Your Entry Point
Optimize your entry points with our advanced ProRealTime indicators. You’ll get efficient buy signals with precise price targets for maximum performance. Start outperforming now!
How do institutions grade them?
Intercontinental Exchange, Inc. Grades
The table below shows recent grades from major financial institutions for Intercontinental Exchange, Inc.:
| Grading Company | Action | New Grade | Date |
|---|---|---|---|
| Barclays | Maintain | Overweight | 2026-02-06 |
| Morgan Stanley | Maintain | Equal Weight | 2026-01-15 |
| Piper Sandler | Maintain | Overweight | 2026-01-14 |
| TD Cowen | Maintain | Buy | 2026-01-14 |
| Barclays | Maintain | Overweight | 2026-01-08 |
| UBS | Maintain | Buy | 2026-01-07 |
| Morgan Stanley | Maintain | Equal Weight | 2025-12-22 |
| UBS | Maintain | Buy | 2025-10-31 |
| JP Morgan | Maintain | Overweight | 2025-10-31 |
| Barclays | Maintain | Overweight | 2025-10-31 |
MSCI Inc. Grades
The table below shows recent grades from major financial institutions for MSCI Inc.:
| Grading Company | Action | New Grade | Date |
|---|---|---|---|
| Wells Fargo | Maintain | Equal Weight | 2026-01-29 |
| Evercore ISI Group | Maintain | Outperform | 2026-01-29 |
| Wells Fargo | Maintain | Equal Weight | 2026-01-14 |
| Wells Fargo | Maintain | Equal Weight | 2025-10-29 |
| UBS | Maintain | Buy | 2025-10-29 |
| Barclays | Maintain | Overweight | 2025-10-29 |
| JP Morgan | Maintain | Overweight | 2025-10-29 |
| Evercore ISI Group | Maintain | Outperform | 2025-10-14 |
| JP Morgan | Maintain | Overweight | 2025-09-10 |
| Wells Fargo | Maintain | Equal Weight | 2025-07-23 |
Which company has the best grades?
Both companies receive strong institutional support, but MSCI holds a slight edge with multiple “Outperform” and “Buy” grades. This suggests more bullish sentiment, potentially attracting investors seeking growth. Intercontinental Exchange shows consistent “Overweight” and “Buy” ratings, reflecting stable confidence.
Risks specific to each company
The following categories identify the critical pressure points and systemic threats facing both firms in the 2026 market environment:
1. Market & Competition
Intercontinental Exchange, Inc. (ICE)
- Faces intense competition in global exchanges and clearing services, with margin pressure from new entrants and technology shifts.
MSCI Inc. (MSCI)
- Operates in niche data and analytics markets but faces risks from evolving client demands and competing index providers.
2. Capital Structure & Debt
Intercontinental Exchange, Inc. (ICE)
- Maintains moderate leverage (D/E 0.7), with favorable interest coverage (6.51), but some concerns on valuation ratios.
MSCI Inc. (MSCI)
- Exhibits high financial leverage (debt-to-assets >100%), negative D/E ratio signals complex capital structure and heightened financial risk.
3. Stock Volatility
Intercontinental Exchange, Inc. (ICE)
- Beta near market average (1.03) suggests moderate volatility aligned with financial sector benchmarks.
MSCI Inc. (MSCI)
- Higher beta (1.28) indicates greater price swings, implying more risk for investors in volatile market cycles.
4. Regulatory & Legal
Intercontinental Exchange, Inc. (ICE)
- Subject to strict regulations across multiple jurisdictions in commodities and securities markets.
MSCI Inc. (MSCI)
- Faces regulatory scrutiny especially in ESG data transparency and index licensing, with evolving global compliance demands.
5. Supply Chain & Operations
Intercontinental Exchange, Inc. (ICE)
- Relies on stable technology infrastructure for exchanges; operational disruptions could impact revenue streams.
MSCI Inc. (MSCI)
- Operational risks tied to data accuracy and platform reliability; client trust hinges on uninterrupted service delivery.
6. ESG & Climate Transition
Intercontinental Exchange, Inc. (ICE)
- Increasing pressure to align clearing and trading with sustainable finance initiatives; ESG integration still evolving.
MSCI Inc. (MSCI)
- ESG and climate analytics form a core business segment, but rapid regulatory changes pose execution risks.
7. Geopolitical Exposure
Intercontinental Exchange, Inc. (ICE)
- Global footprint exposes ICE to geopolitical tensions affecting market access, especially in EU, UK, and Asia.
MSCI Inc. (MSCI)
- International operations subject to geopolitical shifts impacting data licensing and cross-border investment flows.
Which company shows a better risk-adjusted profile?
ICE’s most impactful risk is its moderate leverage combined with stretched valuation multiples, which could amplify downside in a tightening credit environment. MSCI’s key risk is its excessive leverage and negative debt-to-equity ratio, signaling structural financial vulnerability despite strong profitability. ICE benefits from a more balanced capital structure and lower volatility, offering a superior risk-adjusted profile. Notably, MSCI’s Altman Z-Score places it firmly in the safe zone, but its unfavorable debt metrics and very low ROE raise red flags. Conversely, ICE’s distress-zone Z-Score warns of financial strain despite more stable earnings. These contrasting financial stances highlight ICE as the more prudent risk choice in 2026’s uncertain market.
Final Verdict: Which stock to choose?
Intercontinental Exchange, Inc. (ICE) stands out as a cash-generating engine with improving profitability despite some value erosion. Its modest balance sheet strength calls for vigilance. ICE suits investors seeking steady income with moderate growth in an aggressive growth portfolio.
MSCI Inc. boasts a powerful moat with a high ROIC that comfortably exceeds its cost of capital, signaling strong value creation. Its reliance on intangible assets and heavier leverage suggest a higher risk profile than ICE. MSCI fits well in a GARP strategy focused on sustainable growth and competitive advantage.
If you prioritize resilient value creation and growing profitability with moderate risk, ICE is the compelling choice due to its improving financial health and cash flow. However, if you seek superior capital efficiency and long-term competitive moat despite higher leverage risk, MSCI offers better stability and growth potential.
Disclaimer: Investment carries a risk of loss of initial capital. The past performance is not a reliable indicator of future results. Be sure to understand risks before making an investment decision.
Go Further
I encourage you to read the complete analyses of Intercontinental Exchange, Inc. and MSCI Inc. to enhance your investment decisions: