Intercontinental Exchange, Inc. (ICE) and Moody’s Corporation (MCO) are two prominent players in the financial data and stock exchange industry. Both companies operate globally, offering innovative platforms and analytics that serve traders, investors, and institutions. Their market overlap and commitment to cutting-edge technology make them natural competitors. In this article, I will analyze their strengths and challenges to help you identify which company is the smarter investment choice in 2026.

Table of contents
Companies Overview
I will begin the comparison between Intercontinental Exchange and Moody’s Corporation by providing an overview of these two companies and their main differences.
Intercontinental Exchange Overview
Intercontinental Exchange, Inc. operates regulated exchanges, clearing houses, and listing venues across multiple regions including the US, UK, EU, Singapore, Israel, and Canada. Its business spans derivative contracts, financial securities trading, and data services, alongside a proprietary mortgage origination platform. Founded in 2000 and headquartered in Atlanta, ICE serves diverse financial markets through 13 exchanges and 6 clearing houses, supporting commodities, equities, fixed income, and mortgage technology segments.
Moody’s Corporation Overview
Moody’s Corporation is a global integrated risk assessment firm operating two main segments: Moody’s Investors Service and Moody’s Analytics. It specializes in credit ratings, research, and risk management solutions covering thousands of issuers and debt instruments worldwide. Founded in 1900 and based in New York City, Moody’s offers subscription-based analytical tools, economic forecasts, training services, and software solutions to institutional financial market participants, maintaining a strong global presence in credit assessment.
Key similarities and differences
Both companies operate within the financial services sector, focusing on data and market infrastructure. ICE primarily facilitates trading, clearing, and mortgage technology services across various asset classes, whereas Moody’s centers on credit ratings, risk analytics, and financial research. While ICE’s revenue is driven by exchange operations and technology platforms, Moody’s relies on subscription-based products and risk assessment services, reflecting distinct but complementary business models within financial markets.
Income Statement Comparison
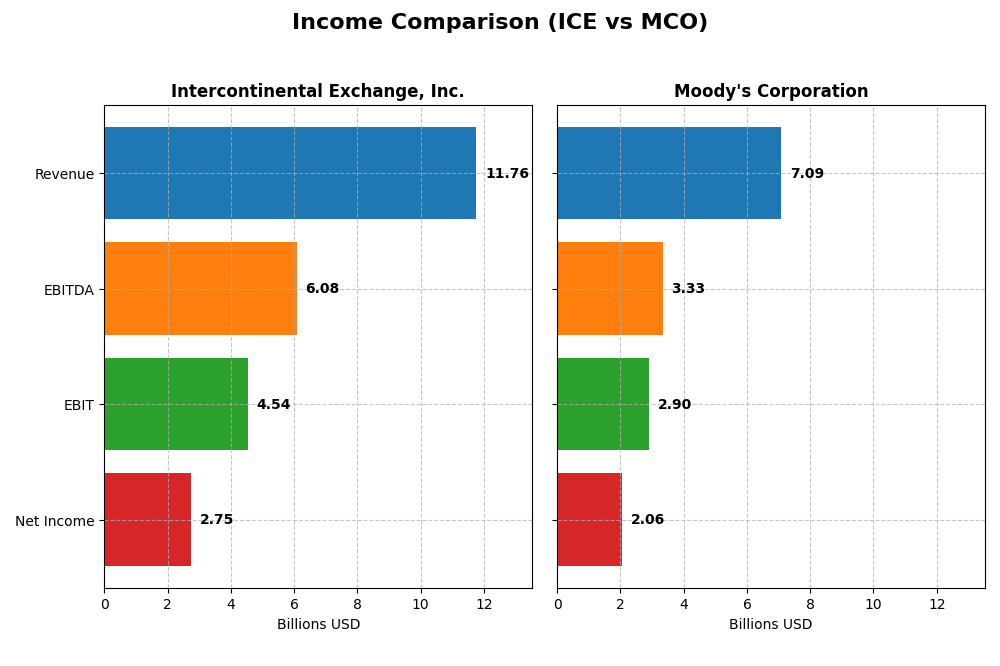
The table below presents a side-by-side comparison of the key income statement metrics for Intercontinental Exchange, Inc. (ICE) and Moody’s Corporation (MCO) for the fiscal year 2024.
| Metric | Intercontinental Exchange, Inc. (ICE) | Moody’s Corporation (MCO) |
|---|---|---|
| Market Cap | 96B | 95B |
| Revenue | 11.76B | 7.09B |
| EBITDA | 6.08B | 3.33B |
| EBIT | 4.54B | 2.90B |
| Net Income | 2.75B | 2.06B |
| EPS | 4.80 | 11.32 |
| Fiscal Year | 2024 | 2024 |
Income Statement Interpretations
Intercontinental Exchange, Inc.
Intercontinental Exchange (ICE) has shown solid revenue growth of 42.7% from 2020 to 2024, reaching $11.76B in 2024. Net income increased by 31.8% over the period to $2.75B, though net margin slightly declined by 7.6%. In 2024, revenue and earnings expanded notably, with gross and EBIT margins remaining favorable, signaling efficient cost management despite a minor net margin dip.
Moody’s Corporation
Moody’s Corporation (MCO) posted a 32.0% revenue increase to $7.09B in 2024 and net income rose 15.8% to $2.06B over 2020-2024. Margins stayed robust, with a 29.0% net margin in 2024, improving by 6.9% from the previous year. The latest fiscal year exhibited strong growth in EBIT and EPS, supported by favorable operating expense control and interest expense ratios.
Which one has the stronger fundamentals?
Both ICE and MCO display favorable income statement trends, but Moody’s shows higher gross and net margins and greater EBIT margin improvement. ICE’s revenue and net income grew more over the full period, yet its net margin contracted slightly. Moody’s stronger margin expansion and lower interest expense ratio suggest more resilient profitability, though both companies maintain solid fundamentals by 2024.
Financial Ratios Comparison
The table below presents a side-by-side comparison of key financial ratios for Intercontinental Exchange, Inc. (ICE) and Moody’s Corporation (MCO) based on their most recent fiscal year 2024 data.
| Ratios | Intercontinental Exchange, Inc. (ICE) | Moody’s Corporation (MCO) |
|---|---|---|
| ROE | 9.96% | 57.73% |
| ROIC | 6.29% | 17.84% |
| P/E | 31.00 | 41.82 |
| P/B | 3.09 | 24.14 |
| Current Ratio | 0.99 | 1.43 |
| Quick Ratio | 0.99 | 1.43 |
| D/E (Debt to Equity) | 0.75 | 2.17 |
| Debt-to-Assets | 14.85% | 49.96% |
| Interest Coverage | 4.74 | 14.56 |
| Asset Turnover | 0.084 | 0.457 |
| Fixed Asset Turnover | 5.46 | 8.13 |
| Payout Ratio | 37.73% | 30.13% |
| Dividend Yield | 1.22% | 0.72% |
Interpretation of the Ratios
Intercontinental Exchange, Inc.
Intercontinental Exchange displays a mixed ratio profile with favorable net margin (23.42%) and debt to assets (14.85%), but unfavorable return on equity (9.96%), price-to-earnings (31.0), and current ratio (0.99). Asset turnover is weak at 0.08, though fixed asset turnover is strong at 5.46. The company pays dividends with a neutral 1.22% yield, suggesting moderate shareholder returns supported by stable payouts.
Moody’s Corporation
Moody’s shows generally strong profitability ratios, including net margin at 29.03%, ROE at 57.73%, and ROIC at 17.84%, indicating robust returns. However, its WACC (10.04%) and leverage (debt/equity 2.17) are unfavorable, increasing financial risk. The dividend yield is low at 0.72% and rated unfavorable, reflecting limited income focus despite solid cash flow and coverage metrics.
Which one has the best ratios?
Moody’s Corporation exhibits stronger profitability and liquidity ratios, with more favorable returns and interest coverage, though its leverage and valuation multiples raise caution. Intercontinental Exchange has more favorable leverage and valuation metrics but weaker profitability and liquidity. Overall, Moody’s displays a more balanced ratio profile, while ICE’s ratios suggest moderate challenges in efficiency and solvency.
Strategic Positioning
This section compares the strategic positioning of ICE and MCO, focusing on market position, key segments, and exposure to technological disruption:
Intercontinental Exchange, Inc. (ICE)
- Operates regulated exchanges and clearing houses globally, facing market competition.
- Diversified segments: Exchanges, Fixed Income and Data Services, Mortgage Technology.
- Provides comprehensive data and technology platforms; exposed to fintech innovations.
Moody’s Corporation (MCO)
- Global integrated risk assessment firm with a strong credit rating presence.
- Two main segments: Moody’s Investors Service and Moody’s Analytics.
- Offers analytical products and subscription services; impacted by digital transformation.
Intercontinental Exchange, Inc. vs Moody’s Corporation Positioning
ICE follows a diversified strategy with multiple segments including exchanges and mortgage technology, offering broad market exposure but facing competitive pressures. MCO concentrates on credit ratings and analytics, benefiting from focused expertise but with less segment variety.
Which has the best competitive advantage?
MCO demonstrates a slightly favorable moat by creating value despite declining profitability, while ICE is slightly unfavorable, shedding value though profitability is improving. MCO currently holds a stronger competitive advantage based on MOAT evaluation.
Stock Comparison
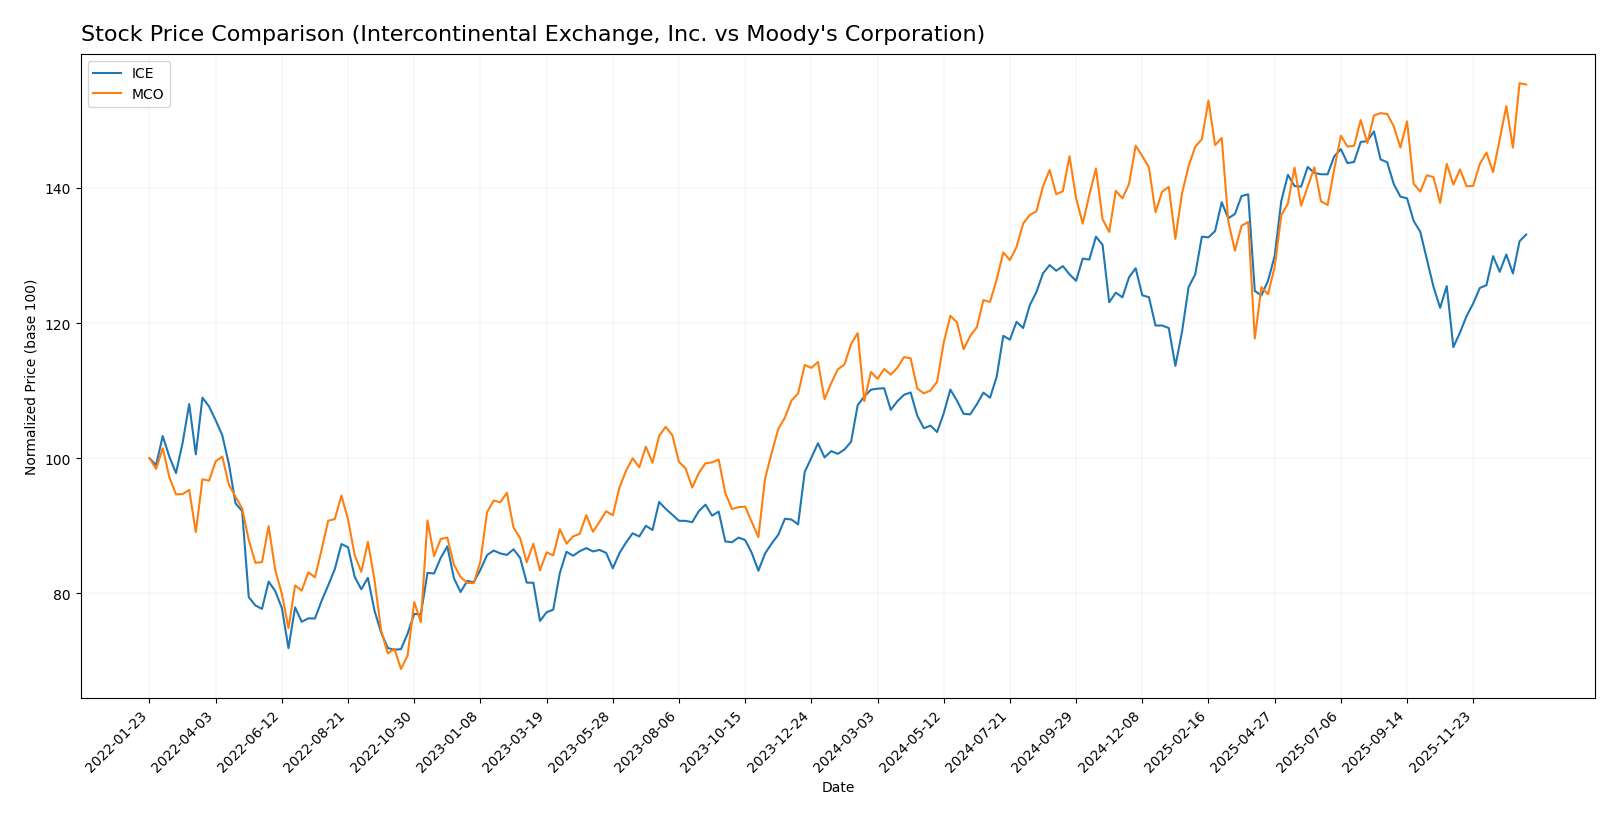
The stock price movements of Intercontinental Exchange, Inc. (ICE) and Moody’s Corporation (MCO) over the past year reveal distinct bullish trends with notable acceleration phases and differing volatility profiles, reflecting varied trading dynamics.
Trend Analysis
Intercontinental Exchange, Inc. (ICE) exhibited a bullish trend over the past 12 months with a 20.85% price increase. The trend showed acceleration, with highs reaching 186.4 and lows at 130.5, supported by moderate volatility (std deviation 15.03).
Moody’s Corporation (MCO) also demonstrated a bullish trend with a stronger 37.72% gain over the same period. The stock experienced acceleration with a higher volatility level (std deviation 40.83), peaking at 531.61 and bottoming at 374.67.
Comparing both, Moody’s Corporation delivered the highest market performance with a 37.72% price increase, surpassing Intercontinental Exchange’s 20.85% gain during the last year.
Target Prices
The consensus target prices for Intercontinental Exchange, Inc. and Moody’s Corporation reflect positive analyst outlooks.
| Company | Target High | Target Low | Consensus |
|---|---|---|---|
| Intercontinental Exchange, Inc. | 211 | 174 | 188.4 |
| Moody’s Corporation | 620 | 507 | 557.44 |
Analysts expect ICE’s share price to rise moderately from the current 167.19 USD, with upside potential close to 211 USD. Moody’s shows stronger upside potential versus its current 531.07 USD price.
Analyst Opinions Comparison
This section compares analysts’ ratings and grades for Intercontinental Exchange, Inc. (ICE) and Moody’s Corporation (MCO):
Rating Comparison
ICE Rating
- Rating: B, classified as Very Favorable by analysts.
- Discounted Cash Flow Score: 4, indicating a Favorable valuation outlook.
- ROE Score: 4, showing Favorable efficiency in generating profit from equity.
- ROA Score: 4, reflecting Favorable asset utilization.
- Debt To Equity Score: 2, indicating Moderate financial risk.
- Overall Score: 3, categorized as Moderate overall financial standing.
MCO Rating
- Rating: B, classified as Very Favorable by analysts.
- Discounted Cash Flow Score: 3, indicating a Moderate valuation outlook.
- ROE Score: 5, showing Very Favorable efficiency in generating profit from equity.
- ROA Score: 5, reflecting Very Favorable asset utilization.
- Debt To Equity Score: 1, indicating Very Unfavorable financial risk.
- Overall Score: 3, categorized as Moderate overall financial standing.
Which one is the best rated?
Both ICE and MCO share the same overall rating of B and an overall score of 3, reflecting moderate financial standing. MCO has stronger ROE and ROA scores but a weaker debt-to-equity score, while ICE shows a more balanced debt position and better discounted cash flow score.
Scores Comparison
The scores comparison between ICE and MCO highlights their financial stability and strength as follows:
ICE Scores
- Altman Z-Score: 0.85, in distress zone indicating high bankruptcy risk.
- Piotroski Score: 9, very strong financial health and investment potential.
MCO Scores
- Altman Z-Score: 7.47, in safe zone indicating low bankruptcy risk.
- Piotroski Score: 8, very strong financial health and investment potential.
Which company has the best scores?
MCO has a significantly higher Altman Z-Score, placing it in a safe zone compared to ICE’s distress zone. Both companies have very strong Piotroski Scores, but ICE scores slightly higher in this metric.
Grades Comparison
Here is the grades comparison for Intercontinental Exchange, Inc. and Moody’s Corporation from notable grading companies:
Intercontinental Exchange, Inc. Grades
The following table summarizes recent grades issued by reputable financial institutions for Intercontinental Exchange, Inc.:
| Grading Company | Action | New Grade | Date |
|---|---|---|---|
| Barclays | Maintain | Overweight | 2026-01-08 |
| UBS | Maintain | Buy | 2026-01-07 |
| Morgan Stanley | Maintain | Equal Weight | 2025-12-22 |
| UBS | Maintain | Buy | 2025-10-31 |
| Barclays | Maintain | Overweight | 2025-10-31 |
| TD Cowen | Maintain | Buy | 2025-10-31 |
| JP Morgan | Maintain | Overweight | 2025-10-31 |
| Morgan Stanley | Maintain | Equal Weight | 2025-10-21 |
| Raymond James | Upgrade | Strong Buy | 2025-10-13 |
| Barclays | Maintain | Overweight | 2025-10-08 |
Intercontinental Exchange shows a consistent pattern of buy and overweight ratings, with one recent upgrade to strong buy.
Moody’s Corporation Grades
Below is a summary of recent grades assigned to Moody’s Corporation by recognized financial institutions:
| Grading Company | Action | New Grade | Date |
|---|---|---|---|
| Evercore ISI Group | Maintain | Outperform | 2026-01-08 |
| Stifel | Upgrade | Buy | 2026-01-05 |
| Goldman Sachs | Upgrade | Buy | 2025-12-16 |
| Mizuho | Maintain | Neutral | 2025-10-28 |
| Stifel | Maintain | Hold | 2025-10-23 |
| JP Morgan | Maintain | Overweight | 2025-10-23 |
| Wells Fargo | Maintain | Overweight | 2025-10-23 |
| BMO Capital | Maintain | Market Perform | 2025-10-23 |
| Raymond James | Upgrade | Market Perform | 2025-10-17 |
| BMO Capital | Maintain | Market Perform | 2025-10-16 |
Moody’s Corporation has a mixed but generally positive rating trend, including upgrades from hold and neutral to buy and outperform.
Which company has the best grades?
Intercontinental Exchange, Inc. has received more consistent buy and overweight ratings, including a strong buy upgrade, while Moody’s Corporation shows a broader range of ratings with some recent upgrades. This suggests ICE has stronger consensus support, potentially indicating higher analyst confidence impacting investor sentiment.
Strengths and Weaknesses
Below is a comparison of key strengths and weaknesses of Intercontinental Exchange, Inc. (ICE) and Moody’s Corporation (MCO) based on their latest financial and operational data.
| Criterion | Intercontinental Exchange, Inc. (ICE) | Moody’s Corporation (MCO) |
|---|---|---|
| Diversification | Moderately diversified across Exchanges, Fixed Income/Data Services, and Mortgage Technology segments | Primarily focused on two segments: Moody’s Analytics and Moody’s Investors Service |
| Profitability | Net margin 23.4% (favorable), ROIC 6.3% (neutral), but ROIC < WACC indicating slight value destruction | Net margin 29.0% (favorable), ROIC 17.8% (favorable), exceeding WACC with value creation |
| Innovation | Growing ROIC trend suggests improving efficiency and innovation | Declining ROIC trend signals possible challenges in sustaining profitability |
| Global presence | Strong global exchange and data service presence expanding fixed income and mortgage tech | Global leader in credit ratings and analytics with steady revenues from core segments |
| Market Share | Significant in exchanges and fixed income markets, but somewhat constrained by increasing competition | Dominant player in credit rating industry with high market share and brand recognition |
Key takeaways: ICE shows promising growth in profitability despite currently creating slight value destruction, reflecting an improving business model with increasing ROIC. Moody’s boasts strong profitability and value creation but faces a declining ROIC trend, signaling potential risks in sustaining long-term growth. Investors should weigh ICE’s improving efficiency against Moody’s current strong position tempered by profitability concerns.
Risk Analysis
Below is a comparative risk overview for Intercontinental Exchange, Inc. (ICE) and Moody’s Corporation (MCO) based on the most recent 2024 data.
| Metric | Intercontinental Exchange, Inc. (ICE) | Moody’s Corporation (MCO) |
|---|---|---|
| Market Risk | Moderate (Beta 1.035) | Elevated (Beta 1.453) |
| Debt Level | Moderate (D/E 0.75, Debt-to-assets 14.85%) | High (D/E 2.17, Debt-to-assets 49.96%) |
| Regulatory Risk | Moderate (Global exchange operations) | Moderate (Global credit rating and analytics) |
| Operational Risk | Moderate (Multiple segments, tech reliance) | Moderate (Dependence on ratings accuracy and analytics) |
| Environmental Risk | Low (Financial services, minimal footprint) | Low (Financial services, minimal footprint) |
| Geopolitical Risk | Moderate (Operations in multiple countries) | Moderate (Global exposure, sensitive to sovereign credit changes) |
Synthesis: Moody’s faces higher market and debt risks with a beta of 1.45 and significant leverage, while ICE shows moderate financial leverage but a lower beta. Both companies operate globally, exposing them to regulatory and geopolitical challenges. ICE’s Altman Z-Score indicates financial distress risk, unlike Moody’s safe zone, highlighting ICE’s higher bankruptcy risk despite strong operational footing.
Which Stock to Choose?
Intercontinental Exchange, Inc. (ICE) shows favorable income growth with a 42.66% revenue increase over 2020-2024 and strong margins. Its financial ratios reveal mixed signals, with a slightly unfavorable global rating. Profitability is moderate, with ROE at 9.96%, and debt levels are neutral to favorable. The company’s rating is very favorable overall, though some valuation metrics are weak.
Moody’s Corporation (MCO) exhibits robust income growth, with a 31.97% revenue increase and very favorable income statement metrics. Its financial ratios are balanced but show higher debt and valuation ratios with a neutral global rating. Profitability is high, with an ROE of 57.73%, yet debt-to-equity is very unfavorable. The rating is very favorable, supported by strong returns but tempered by leverage concerns.
For investors focused on quality and strong profitability, MCO might appear more favorable due to its higher ROE and value creation despite increased debt. Conversely, risk-averse investors valuing stability and moderate debt levels may find ICE’s profile more aligned with their preferences given its improving income and balanced financial ratios.
Disclaimer: Investment carries a risk of loss of initial capital. The past performance is not a reliable indicator of future results. Be sure to understand risks before making an investment decision.
Go Further
I encourage you to read the complete analyses of Intercontinental Exchange, Inc. and Moody’s Corporation to enhance your investment decisions: