In the competitive landscape of household and personal products, Unilever PLC and Inter Parfums, Inc. stand out as key players with distinct approaches. Unilever, a global giant with a diversified portfolio, contrasts with Inter Parfums’ specialized focus on luxury fragrances. Both companies innovate to capture consumer loyalty, making their comparison essential for investors seeking growth and stability. Join me as we explore which company offers the most compelling investment opportunity.

Table of contents
Companies Overview
I will begin the comparison between Unilever PLC and Inter Parfums, Inc. by providing an overview of these two companies and their main differences.
Unilever PLC Overview
Unilever PLC operates as a fast-moving consumer goods company headquartered in London, United Kingdom. It serves the market through three main segments: Beauty & Personal Care, Foods & Refreshment, and Home Care. With a broad portfolio including brands like Dove, Ben & Jerry’s, and Knorr, Unilever focuses on delivering diverse household and personal products worldwide, leveraging its longstanding presence since 1894.
Inter Parfums, Inc. Overview
Inter Parfums, Inc., based in New York City, is specialized in manufacturing, marketing, and distributing fragrances and related products globally. Operating through European and U.S. segments, it manages a portfolio of luxury and designer fragrance brands such as Coach, Jimmy Choo, and Lanvin. Founded in 1982, the company targets department stores, specialty retailers, and e-commerce channels, emphasizing fragrance and cosmetic products.
Key similarities and differences
Both companies operate in the Consumer Defensive sector, focusing on personal products, but Unilever offers a wider product range including food and home care segments. Unilever is a large multinational with over 115K employees and a market cap exceeding 140B USD, while Inter Parfums is a smaller player with around 650 employees and a market cap near 2.9B USD. Unilever’s low beta contrasts with Inter Parfums’ more volatile trading profile, reflecting differences in market stability and business scale.
Income Statement Comparison
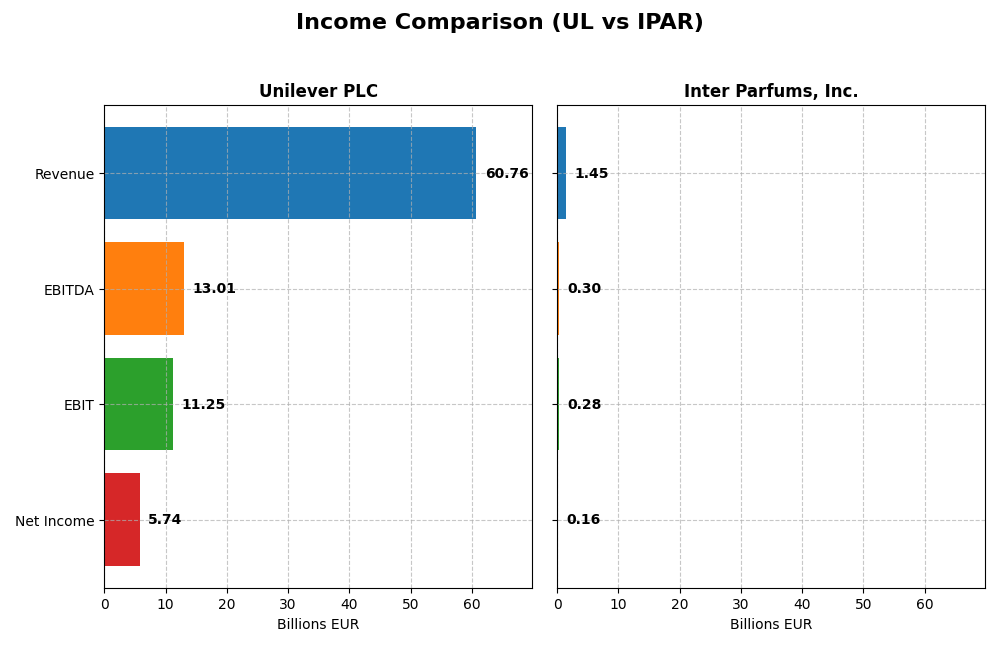
This table presents the key income statement metrics for Unilever PLC and Inter Parfums, Inc. for the fiscal year 2024, allowing a direct financial performance comparison.
| Metric | Unilever PLC (UL) | Inter Parfums, Inc. (IPAR) |
|---|---|---|
| Market Cap | 140.6B EUR | 2.87B USD |
| Revenue | 60.8B EUR | 1.45B USD |
| EBITDA | 13.0B EUR | 305M USD |
| EBIT | 11.3B EUR | 276M USD |
| Net Income | 5.74B EUR | 164M USD |
| EPS | 2.30 EUR | 5.13 USD |
| Fiscal Year | 2024 | 2024 |
Income Statement Interpretations
Unilever PLC
Unilever’s revenue showed a modest increase of 1.94% in 2024, reaching €60.8B, with a 20% growth over five years. Net income declined 13.14% in the last year to €5.74B, though it was roughly stable overall. Gross margin remained exceptionally strong at 100%, while EBIT margin held firm at 18.52%, reflecting solid cost management despite a slight dip in net margin to 9.45%.
Inter Parfums, Inc.
Inter Parfums exhibited a robust 10.22% revenue growth in 2024, totaling $1.45B, with a remarkable overall increase of 169% since 2020. Net income grew 7.79% last year to $164M, contributing to a substantial 330% rise over the period. Margins improved consistently, with a 63.85% gross margin and a strong EBIT margin of 19.02%, alongside a net margin of 11.32%, indicating efficient operational leverage.
Which one has the stronger fundamentals?
Inter Parfums demonstrates stronger fundamentals in terms of revenue and net income growth, with favorable margin expansion and a higher overall percentage of positive income statement indicators (85.71%). Unilever maintains larger scale and stable margins but faces challenges with recent net income and margin contractions. Thus, Inter Parfums shows more dynamic financial progression, while Unilever reflects solid but slower growth.
Financial Ratios Comparison
This table compares key financial ratios for Unilever PLC and Inter Parfums, Inc. based on their latest available fiscal year data (2024).
| Ratios | Unilever PLC (UL) | Inter Parfums, Inc. (IPAR) |
|---|---|---|
| ROE | 28.7% | 22.1% |
| ROIC | 11.1% | 18.6% |
| P/E | 23.9 | 25.6 |
| P/B | 6.87 | 5.66 |
| Current Ratio | 0.76 | 2.75 |
| Quick Ratio | 0.56 | 1.63 |
| D/E (Debt-to-Equity) | 1.53 | 0.26 |
| Debt-to-Assets | 38.4% | 13.6% |
| Interest Coverage | 8.4 | 35.6 |
| Asset Turnover | 0.76 | 1.03 |
| Fixed Asset Turnover | 5.21 | 8.14 |
| Payout Ratio | 75.2% | 58.4% |
| Dividend Yield | 3.14% | 2.28% |
Interpretation of the Ratios
Unilever PLC
Unilever shows a slightly favorable ratios profile with strong returns on equity (28.73%) and invested capital (11.12%), supported by a low weighted average cost of capital (4.42%). However, liquidity ratios such as current (0.76) and quick ratios (0.56) are weak, and the debt-to-equity ratio (1.53) is unfavorable. The company pays dividends with a favorable yield of 3.14%, indicating steady shareholder returns, but some caution is warranted due to leverage and liquidity constraints.
Inter Parfums, Inc.
Inter Parfums presents a very favorable ratios profile, excelling in profitability with a net margin of 11.32%, ROE of 22.07%, and ROIC of 18.62%. Liquidity is robust, as seen in a current ratio of 2.75 and quick ratio of 1.63, while leverage remains low with a debt-to-equity of 0.26. The dividend yield stands at a favorable 2.28%, reflecting consistent shareholder returns alongside prudent financial management.
Which one has the best ratios?
Inter Parfums holds the edge with 78.57% favorable ratios, demonstrating strong profitability, liquidity, and low leverage, which contribute to a very favorable overall evaluation. Unilever, while showing good returns, faces challenges with weaker liquidity and higher leverage, resulting in a slightly favorable assessment. Hence, Inter Parfums’ ratios suggest a more robust financial position relative to Unilever.
Strategic Positioning
This section compares the strategic positioning of Unilever PLC and Inter Parfums, Inc., including market position, key segments, and exposure to technological disruption:
Unilever PLC
- Large market cap of 140B USD in consumer goods, facing broad competitive pressure.
- Diversified segments: Beauty & Personal Care, Foods & Refreshment, Home Care.
- No explicit details on technological disruption exposure provided.
Inter Parfums, Inc.
- Smaller market cap of 2.9B USD, focused on fragrances with niche competition.
- Concentrated in fragrance products, split into European and US operations.
- No explicit details on technological disruption exposure provided.
Unilever PLC vs Inter Parfums, Inc. Positioning
Unilever has a diversified product portfolio across multiple consumer segments, providing broad market exposure but facing diverse competition. Inter Parfums concentrates on fragrance products, enabling focused brand management but limiting diversification benefits.
Which has the best competitive advantage?
Unilever shows a slightly favorable moat with value creation but declining profitability, while Inter Parfums has a very favorable moat with strong value creation and growing profitability, indicating a more durable competitive advantage.
Stock Comparison
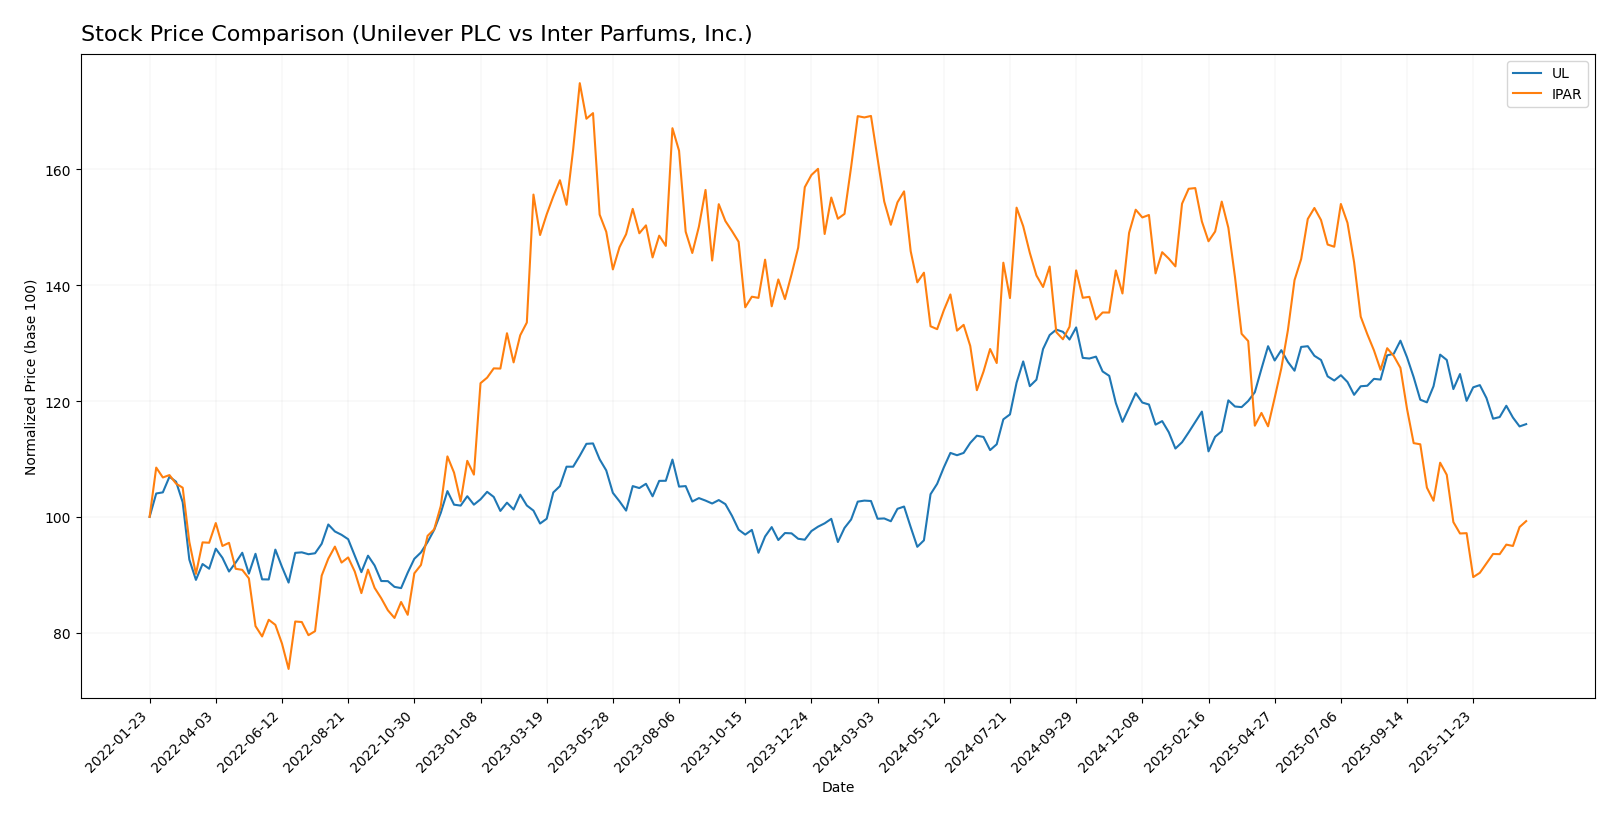
The stock price chart over the past 12 months highlights contrasting movements, with Unilever PLC showing a clear bullish trend despite recent deceleration, while Inter Parfums, Inc. experienced a significant bearish trend with signs of recent stabilization.
Trend Analysis
Unilever PLC’s stock increased by 12.92% over the past year, indicating a bullish trend with deceleration in momentum. The price ranged between 52.66 and 73.69, with volatility marked by a 4.86 standard deviation.
Inter Parfums, Inc. showed a bearish trend, declining by 41.33% over the same period. Despite the accelerated downtrend and higher volatility (17.11 std deviation), recent weeks reflect a slight positive change of 0.17%, suggesting a potential bottoming phase.
Comparing both, Unilever PLC delivered the highest market performance with a substantial positive return, whereas Inter Parfums, Inc. faced a steep decline but shows early signs of trend stabilization.
Target Prices
Analysts provide a clear target price consensus for both Unilever PLC and Inter Parfums, Inc., indicating their expected trading ranges.
| Company | Target High | Target Low | Consensus |
|---|---|---|---|
| Unilever PLC | 71 | 60.1 | 65.55 |
| Inter Parfums, Inc. | 125 | 103 | 114 |
The target consensus for Unilever PLC aligns closely with its current price of 64.42 USD, suggesting moderate upside potential. Inter Parfums, trading at 89.3 USD, shows a significantly higher consensus target, indicating strong expected growth according to analysts.
Analyst Opinions Comparison
This section compares analysts’ ratings and grades for Unilever PLC and Inter Parfums, Inc.:
Rating Comparison
UL Rating
- Rating: B+ with a very favorable status.
- Discounted Cash Flow Score: 5, very favorable, indicating undervaluation.
- ROE Score: 5, very favorable, showing efficient profit generation.
- ROA Score: 4, favorable, reflecting effective asset utilization.
- Debt To Equity Score: 1, very unfavorable, indicating high financial risk.
- Overall Score: 3, moderate overall financial standing.
IPAR Rating
- Rating: B+ with a very favorable status.
- Discounted Cash Flow Score: 3, moderate, indicating less undervaluation.
- ROE Score: 5, very favorable, showing efficient profit generation.
- ROA Score: 5, very favorable, reflecting highly effective asset utilization.
- Debt To Equity Score: 3, moderate, indicating balanced financial risk.
- Overall Score: 3, moderate overall financial standing.
Which one is the best rated?
Both companies share the same overall rating (B+) and overall score (3), but UL excels in discounted cash flow while IPAR has stronger asset utilization and a better debt-to-equity score. The choice depends on the specific metric emphasis.
Scores Comparison
Here is a comparison of the Altman Z-Score and Piotroski Score for Unilever PLC and Inter Parfums, Inc.:
UL Scores
- Altman Z-Score: 4.85, indicating a safe zone status
- Piotroski Score: 6, reflecting average financial strength
IPAR Scores
- Altman Z-Score: 6.12, indicating a safe zone status
- Piotroski Score: 5, reflecting average financial strength
Which company has the best scores?
Both UL and IPAR are in the safe zone according to their Altman Z-Scores, with IPAR showing a slightly higher score. UL has a marginally better Piotroski Score, but both companies are rated as average in financial strength.
Grades Comparison
Here is a comparison of recent grades issued by recognized financial institutions for the two companies:
Unilever PLC Grades
The table below summarizes recent grades given by reputable grading companies for Unilever PLC:
| Grading Company | Action | New Grade | Date |
|---|---|---|---|
| Erste Group | Downgrade | Hold | 2024-11-19 |
| B of A Securities | Upgrade | Buy | 2024-08-22 |
| JP Morgan | Upgrade | Overweight | 2024-05-23 |
| Argus Research | Maintain | Buy | 2024-05-08 |
| Morgan Stanley | Downgrade | Underweight | 2024-02-27 |
| Bernstein | Upgrade | Market Perform | 2022-03-14 |
| Bernstein | Upgrade | Market Perform | 2022-03-13 |
| Bernstein | Upgrade | Market Perform | 2021-11-01 |
| Bernstein | Upgrade | Market Perform | 2021-10-31 |
| Deutsche Bank | Downgrade | Hold | 2021-09-16 |
Unilever’s grades indicate a mixed trend, with several downgrades to Hold or Underweight balanced by multiple upgrades to Buy and Market Perform in recent years.
Inter Parfums, Inc. Grades
Below is a summary of recent grades assigned by established grading companies for Inter Parfums, Inc.:
| Grading Company | Action | New Grade | Date |
|---|---|---|---|
| BWS Financial | Downgrade | Neutral | 2025-11-21 |
| Canaccord Genuity | Maintain | Buy | 2025-11-19 |
| Canaccord Genuity | Maintain | Buy | 2025-11-07 |
| Jefferies | Maintain | Buy | 2025-10-28 |
| BWS Financial | Maintain | Buy | 2025-10-22 |
| Canaccord Genuity | Maintain | Buy | 2025-10-21 |
| BWS Financial | Maintain | Buy | 2025-05-07 |
| Piper Sandler | Maintain | Overweight | 2025-04-24 |
| DA Davidson | Maintain | Buy | 2025-03-25 |
| BWS Financial | Maintain | Buy | 2025-03-17 |
Inter Parfums shows a predominantly positive rating trend, with mostly Buy and Overweight ratings maintained consistently and only one recent downgrade to Neutral.
Which company has the best grades?
Inter Parfums has received more consistent Buy and Overweight ratings compared to Unilever’s mixed upgrades and downgrades, suggesting a relatively stronger consensus among analysts. This may influence investor sentiment by highlighting Inter Parfums as having steadier analyst confidence.
Strengths and Weaknesses
The following table summarizes the key strengths and weaknesses of Unilever PLC (UL) and Inter Parfums, Inc. (IPAR) based on their latest financial and strategic data.
| Criterion | Unilever PLC (UL) | Inter Parfums, Inc. (IPAR) |
|---|---|---|
| Diversification | Highly diversified product portfolio globally | More niche focus on fragrance products, less diversified |
| Profitability | ROIC 11.12% (favorable), net margin 9.45% (neutral) | ROIC 18.62% (favorable), net margin 11.32% (favorable) |
| Innovation | Moderate innovation with slight decline in ROIC trend | Strong innovation, ROIC growing significantly |
| Global presence | Extensive global footprint | More limited global reach, concentrated markets |
| Market Share | Large market share in consumer goods | Smaller market share, but strong in premium fragrance segment |
Key takeaways: Unilever offers stability with broad diversification and solid profitability, but its declining ROIC trend signals caution. Inter Parfums shows stronger profitability and innovation growth with a very favorable financial profile, though it operates in a narrower market niche.
Risk Analysis
Below is a comparative table outlining key risks for Unilever PLC and Inter Parfums, Inc. based on the latest data from 2024 and 2026 market conditions:
| Metric | Unilever PLC (UL) | Inter Parfums, Inc. (IPAR) |
|---|---|---|
| Market Risk | Low beta (0.223) indicates lower volatility and market risk. | Higher beta (1.243) suggests greater market sensitivity and risk. |
| Debt level | Moderate debt-to-equity (1.53) and debt-to-assets (38.44%) levels, indicating some leverage risk. | Low debt-to-equity (0.26) and debt-to-assets (13.62%) show a strong balance sheet with minimal leverage risk. |
| Regulatory Risk | Operating globally with exposure to diverse regulations, especially in consumer goods sectors. | Primarily US and European markets, potentially less regulatory complexity but still exposed to import/export and cosmetics regulations. |
| Operational Risk | Large global operations may face supply chain and production risks; high employee base (115,964). | Smaller scale (647 employees) reduces operational complexity but higher dependence on premium brand partnerships. |
| Environmental Risk | Increasing pressure on sustainability; product lines include some environmentally sensitive goods. | Moderate environmental exposure, mainly related to manufacturing and distribution in cosmetics sector. |
| Geopolitical Risk | Exposure to Brexit-related uncertainties and global trade tensions impacting supply chains. | Mainly US and Europe focus; somewhat insulated but not immune to geopolitical shifts affecting trade. |
In synthesis, Unilever’s most impactful risks stem from moderate leverage and geopolitical complexities due to its global scale, though market risk remains low thanks to stable beta. Inter Parfums carries higher market risk due to elevated beta but benefits from strong financials and low debt, mitigating financial distress. Regulatory and environmental risks are moderate for both, with operational risk higher for Unilever given its scale. Investors should weigh Unilever’s stability against Inter Parfums’ growth volatility in portfolio decisions.
Which Stock to Choose?
Unilever PLC shows a favorable income statement with stable profitability, though recent net margin and EPS growth are negative. Its financial ratios are slightly favorable, despite some liquidity and leverage concerns. The company creates value but faces declining ROIC, reflected in a very favorable B+ rating.
Inter Parfums, Inc. displays strong income growth and profitability over the period with mostly favorable financial ratios, including low debt and high liquidity. It demonstrates value creation with a growing ROIC trend and holds a very favorable B+ rating, though its price declined significantly recently.
For investors prioritizing stable profitability and established market presence, Unilever may appear more suitable, while those favoring strong growth potential and financial robustness might find Inter Parfums more appealing. The choice could depend on risk tolerance and investment strategy preferences.
Disclaimer: Investment carries a risk of loss of initial capital. The past performance is not a reliable indicator of future results. Be sure to understand risks before making an investment decision.
Go Further
I encourage you to read the complete analyses of Unilever PLC and Inter Parfums, Inc. to enhance your investment decisions: