Home > Comparison > Consumer Defensive > PG vs IPAR
The strategic rivalry between The Procter & Gamble Company and Inter Parfums, Inc. shapes the competitive landscape of the consumer defensive sector. P&G operates as a vast, diversified household and personal products conglomerate, while Inter Parfums focuses on high-margin, niche fragrance brands. This analysis pits scale and diversification against specialization, aiming to identify the superior risk-adjusted growth trajectory for a balanced investment portfolio.
Table of contents
Companies Overview
The Procter & Gamble Company and Inter Parfums, Inc. stand as key players in the global household and personal products market.
The Procter & Gamble Company: Global Consumer Goods Leader
The Procter & Gamble Company dominates as a global consumer packaged goods powerhouse, generating revenue across five major segments: Beauty, Grooming, Health Care, Fabric & Home Care, and Baby, Feminine & Family Care. In 2026, its strategic focus remains on innovation and expanding e-commerce channels to enhance its extensive brand portfolio, including Gillette, Tide, and Pampers.
Inter Parfums, Inc.: Luxury Fragrance Specialist
Inter Parfums, Inc. commands a niche as a luxury fragrance manufacturer and distributor, operating through European and U.S. segments. Its revenue engine centers on licensing and selling premium fragrance brands like Jimmy Choo and Coach. The company’s 2026 strategy targets selective brand expansion and strengthening e-commerce alongside traditional department store channels.
Strategic Collision: Similarities & Divergences
Both companies excel in highly branded consumer products but diverge in scale and market approach. Procter & Gamble pursues a broad, diversified portfolio with global mass-market reach while Inter Parfums focuses on luxury fragrances with a selective brand strategy. Their primary battleground lies in consumer loyalty and retail channel dominance. Investors face contrasting profiles: P&G offers stability and scale, while Inter Parfums presents targeted growth in premium segments.
Income Statement Comparison
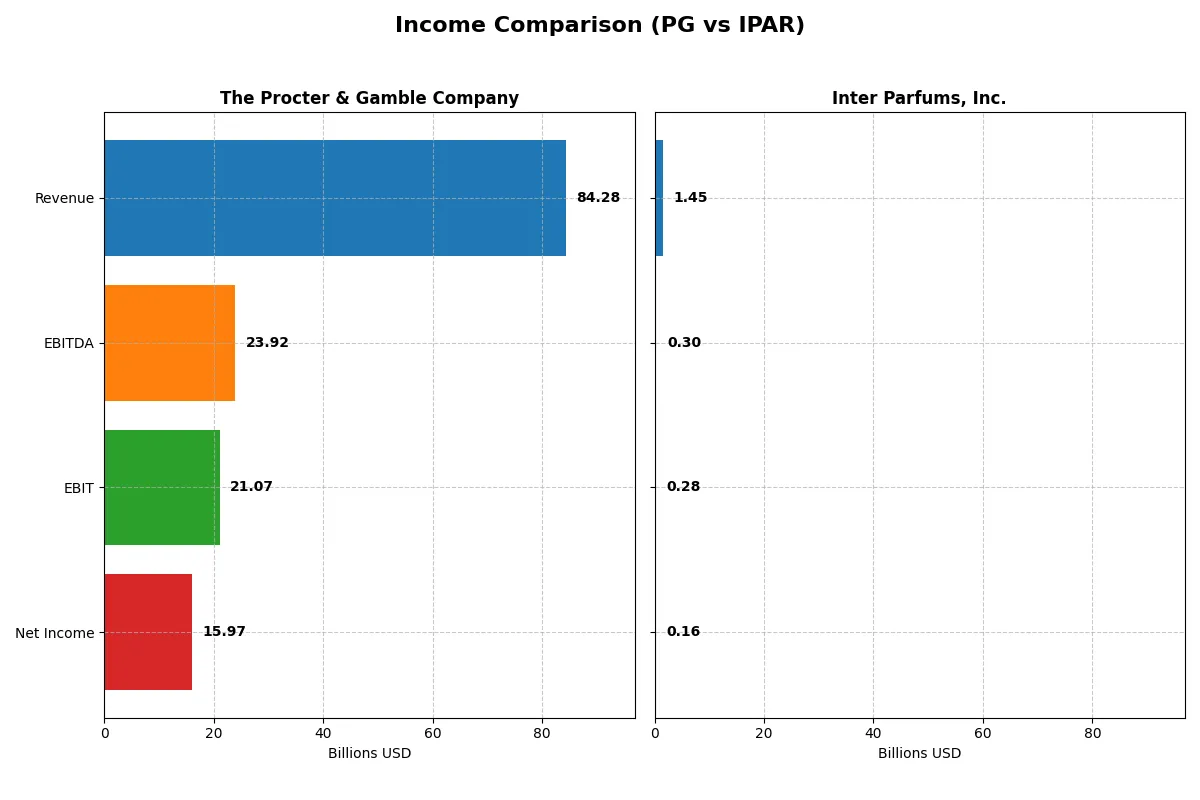
This table dissects the core profitability and scalability of both corporate engines to reveal who dominates the bottom line:
| Metric | The Procter & Gamble Company (PG) | Inter Parfums, Inc. (IPAR) |
|---|---|---|
| Revenue | 84.3B | 1.45B |
| Cost of Revenue | 41.2B | 525M |
| Operating Expenses | 22.7B | 653M |
| Gross Profit | 43.1B | 927M |
| EBITDA | 23.9B | 305M |
| EBIT | 21.1B | 276M |
| Interest Expense | 907M | 7.8M |
| Net Income | 15.97B | 164M |
| EPS | 6.67 | 5.13 |
| Fiscal Year | 2025 | 2024 |
Income Statement Analysis: The Bottom-Line Duel
This income statement comparison reveals the true efficiency and profitability momentum of each corporate engine over recent years.
The Procter & Gamble Company Analysis
PG’s revenue grew modestly from $76B in 2021 to $84B in 2025, with net income rising from $14.3B to $16B. Its gross margin remains robust at 51.2%, while net margins improved to 19%. The 2025 fiscal year shows efficiency gains with EBIT up 7%, reflecting disciplined cost control and stable profitability.
Inter Parfums, Inc. Analysis
IPAR expanded revenue sharply from $540M in 2020 to $1.45B in 2024, accompanied by net income surging from $38M to $164M. Its gross margin leads at 63.9%, though net margin is lower at 11.3%. Despite strong top-line growth, operating expenses scaled unfavorably, slightly compressing net margin in the latest year.
Scale and Margin: Established Strength vs. Rapid Growth
PG delivers steady revenue growth with superior net margins and better cost efficiency, typical of a mature consumer giant. IPAR impresses with explosive revenue and earnings growth but at the cost of margin pressure. For investors, PG’s profile suits those prioritizing reliable profitability, while IPAR appeals to those favoring high-growth potential despite margin volatility.
Financial Ratios Comparison
These vital ratios act as a diagnostic tool to expose the underlying fiscal health, valuation premiums, and capital efficiency of the companies analyzed:
| Ratios | The Procter & Gamble Company (PG) | Inter Parfums, Inc. (IPAR) |
|---|---|---|
| ROE | 30.7% | 22.1% |
| ROIC | 16.5% | 18.4% |
| P/E | 24.5 | 25.6 |
| P/B | 7.52 | 5.66 |
| Current Ratio | 0.70 | 2.75 |
| Quick Ratio | 0.49 | 1.63 |
| D/E (Debt to Equity) | 0.68 | 0.26 |
| Debt-to-Assets | 28.3% | 13.6% |
| Interest Coverage | 22.5 | 35.1 |
| Asset Turnover | 0.67 | 1.03 |
| Fixed Asset Turnover | 3.53 | 8.14 |
| Payout ratio | 61.8% | 58.4% |
| Dividend yield | 2.52% | 2.28% |
| Fiscal Year | 2025 | 2024 |
Efficiency & Valuation Duel: The Vital Signs
Financial ratios act as a company’s DNA, revealing hidden risks and operational excellence through key profitability and valuation metrics.
The Procter & Gamble Company
P&G exhibits strong profitability with a 30.7% ROE and an 18.95% net margin, signaling efficient capital use. The stock trades at a neutral 24.5 P/E but a stretched 7.5 P/B, indicating a premium valuation. A 2.52% dividend yield rewards shareholders while reinvestment in operations supports steady growth.
Inter Parfums, Inc.
Inter Parfums shows solid profitability with a 22.1% ROE and an 11.3% net margin, reflecting operational competence. The stock appears expensive at a 25.6 P/E and a 5.7 P/B, yet strong liquidity and low leverage underpin financial stability. A 2.28% dividend yield complements a strategy focused on efficient asset turnover.
Premium Valuation vs. Operational Safety
P&G balances premium valuation with robust profitability and shareholder returns, while Inter Parfums offers greater liquidity and asset efficiency. Investors seeking operational safety and financial flexibility may favor Inter Parfums, whereas those prioritizing consistent profitability and dividends might prefer P&G’s profile.
Which one offers the Superior Shareholder Reward?
I compare Procter & Gamble (PG) and Inter Parfums (IPAR) on dividends, payout ratios, and buybacks. PG yields ~2.5% with a ~62% payout, well-covered by free cash flow (FCF). IPAR yields ~2.3% with a slightly lower payout ratio (~58%), also covered by FCF. PG maintains a steady, higher dividend with consistent buybacks, enhancing total shareholder return. IPAR’s buyback program is less intense but supports growth alongside dividends. PG’s model is more sustainable, balancing yield and capital returns, while IPAR reinvests modestly but less aggressively. I find PG offers a superior total return profile in 2026 due to its reliable distributions and stronger buyback activity.
Comparative Score Analysis: The Strategic Profile
The radar chart reveals the fundamental DNA and trade-offs of The Procter & Gamble Company and Inter Parfums, Inc.:
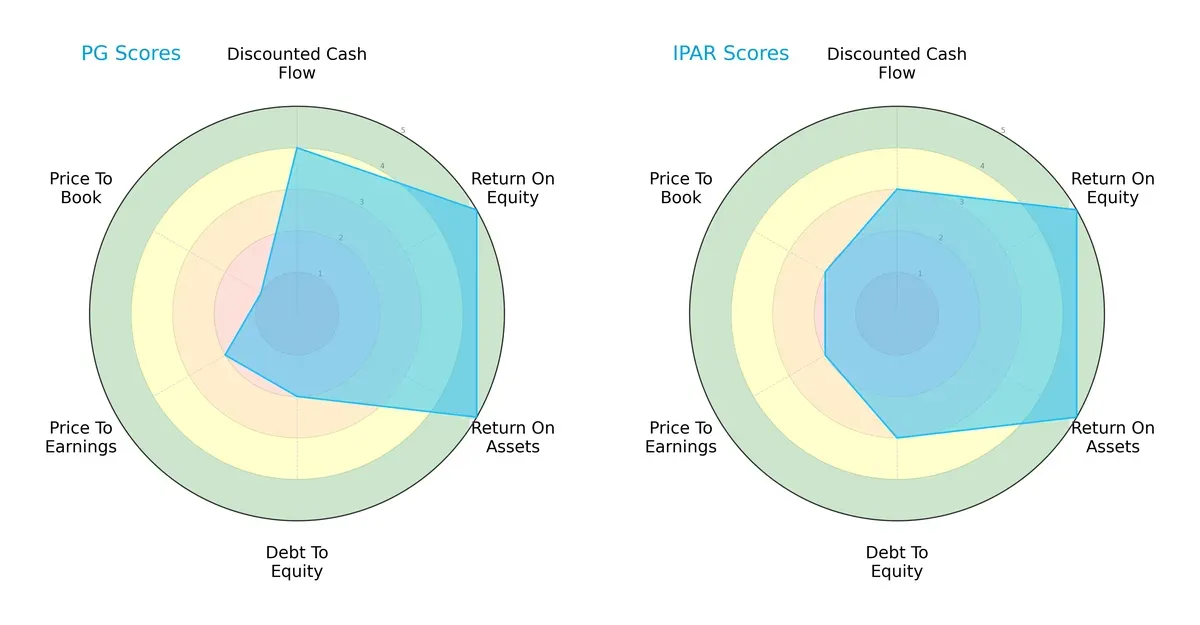
P&G shows superior discounted cash flow strength (4 vs. 3) and a more conservative debt profile (2 vs. 3). Both firms excel equally in ROE and ROA (5 each). Inter Parfums edges P&G slightly on overall balance (4 vs. 3) and valuation metrics (P/B of 2 vs. 1), indicating it leans on market favorability, while P&G relies on operational cash flow and asset efficiency.
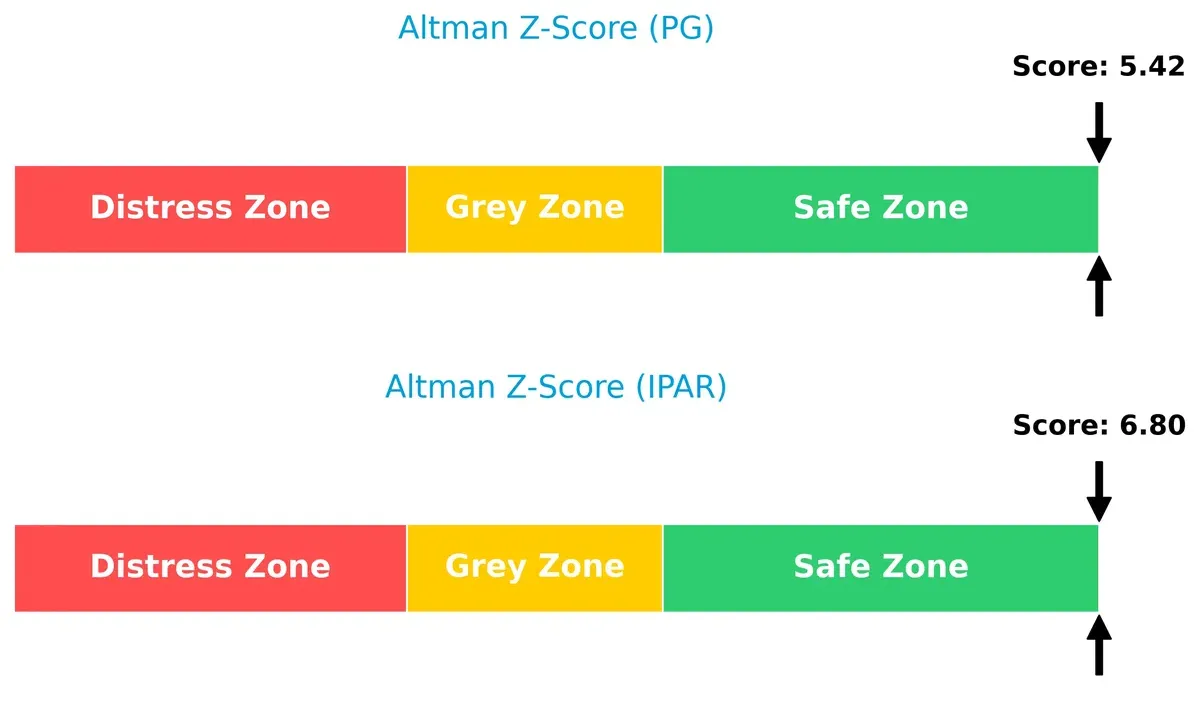
Bankruptcy Risk: Solvency Showdown
Inter Parfums’ Altman Z-Score (6.80) surpasses P&G’s (5.42), signaling stronger solvency and lower bankruptcy risk. Both companies reside safely above distress thresholds, but Inter Parfums’ higher score reinforces its resilience in this cycle:
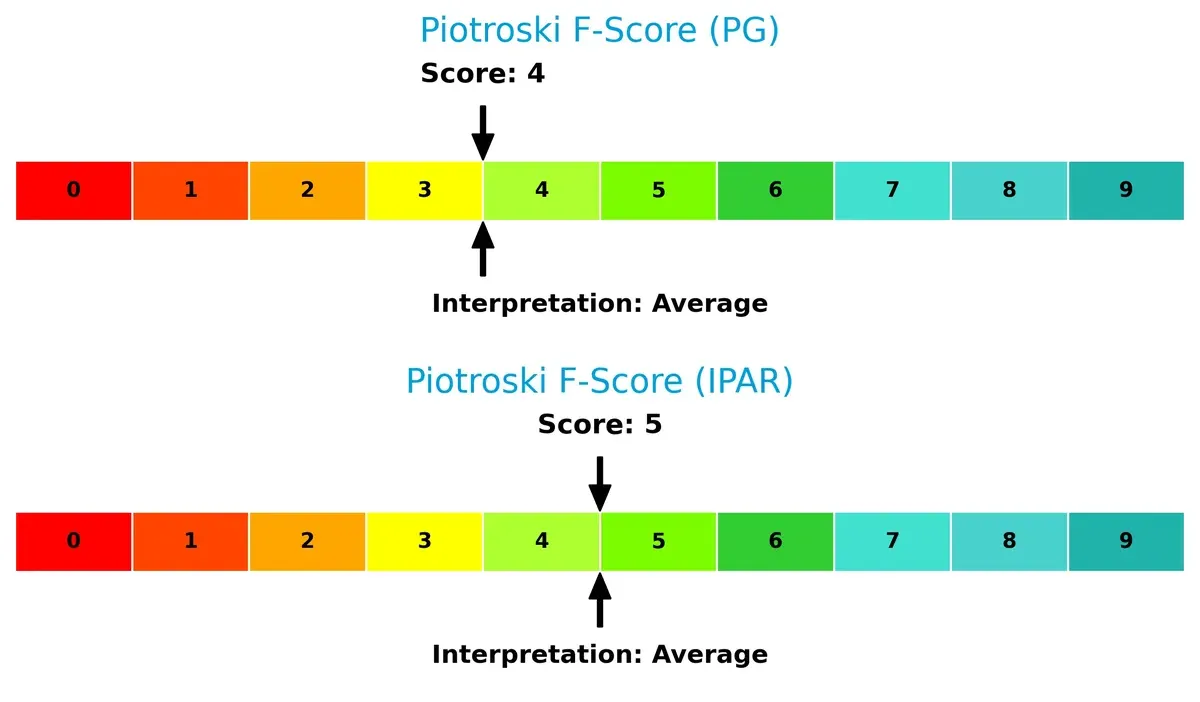
Financial Health: Quality of Operations
Inter Parfums leads with a Piotroski F-Score of 5 versus P&G’s 4, suggesting marginally better internal financial health. Neither firm hits peak scores, but P&G’s lower rating hints at potential operational red flags relative to Inter Parfums:
How are the two companies positioned?
This section dissects the operational DNA of PG and IPAR by comparing their revenue distribution by segment and internal dynamics of strengths and weaknesses. The ultimate goal is to confront their economic moats and identify which business model delivers the most resilient, sustainable competitive advantage in today’s market.
Revenue Segmentation: The Strategic Mix
This comparison dissects how The Procter & Gamble Company and Inter Parfums, Inc. diversify their income streams and where their primary sector bets lie:
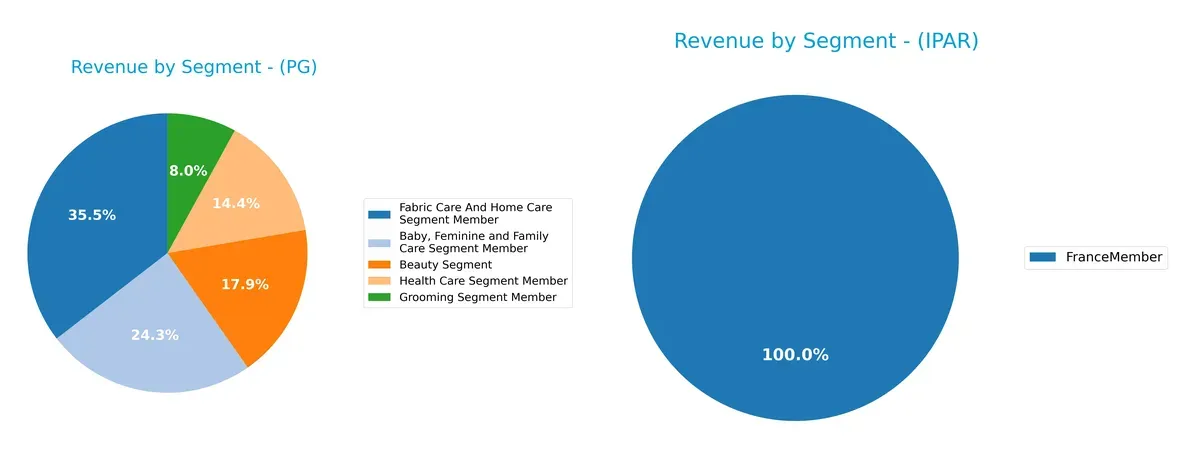
Procter & Gamble displays a broad revenue base, with Fabric Care and Home Care anchoring at $29.6B, followed by Baby, Feminine and Family Care at $20.2B. Beauty and Health Care segments also contribute significantly, showcasing strategic diversification. Inter Parfums, in contrast, relies heavily on its France market segment, reflecting high concentration risk. P&G’s mix reduces dependency on any single sector, strengthening resilience against market shifts.
Strengths and Weaknesses Comparison
This table compares the Strengths and Weaknesses of The Procter & Gamble Company and Inter Parfums, Inc.:
PG Strengths
- Diversified revenue across six major segments
- Strong profitability with 18.95% net margin and 30.71% ROE
- Favorable capital efficiency with 16.47% ROIC above 5.4% WACC
- Balanced global presence with nearly equal US and non-US sales
- High interest coverage of 23.23 and solid fixed asset turnover
- Dividend yield at 2.52% supports shareholder returns
IPAR Strengths
- Favorable profitability with 11.32% net margin and 22.07% ROE
- Strong capital efficiency shown by 18.35% ROIC
- Robust liquidity with current ratio of 2.75 and low debt-to-assets at 13.62%
- Efficient asset turnover at 1.03 and high fixed asset turnover at 8.14
- Global sales across multiple regions including Europe, Asia, and Americas
- Interest coverage at 35.3 indicating strong earnings to cover debt
PG Weaknesses
- Low liquidity ratios with current ratio at 0.7 and quick ratio 0.49
- High price-to-book ratio at 7.52 suggesting overvaluation risk
- Moderate debt-to-equity at 0.68 limits financial flexibility
- Neutral asset turnover at 0.67 may indicate slower sales efficiency
- PE ratio neutral but lacks valuation appeal compared to peers
- Complex segment structure could dilute strategic focus
IPAR Weaknesses
- Elevated WACC at 9.24% increases capital costs
- PE at 25.63 and PB at 5.66 flagged as unfavorable valuation metrics
- Smaller scale with limited revenue diversification and geographic concentration
- Less segment diversity compared to large peers
- Lower dividend yield at 2.28% may reduce income appeal
Overall, PG’s strengths lie in its broad diversification and strong profitability, balanced against liquidity and valuation concerns. IPAR excels in efficient capital use and liquidity but faces challenges in scale and valuation. Both companies reflect distinct strategic positions shaping their financial profiles.
The Moat Duel: Analyzing Competitive Defensibility
A structural moat shields long-term profits from relentless competition and market pressures. Without it, sustainable earnings vanish quickly:
The Procter & Gamble Company: Brand Power & Scale Moat
P&G’s moat stems from intangible assets and brand strength, reflected in a robust 25% EBIT margin and stable net margins near 19%. Its vast product portfolio and global reach deepen its moat in 2026 despite modest revenue growth.
Inter Parfums, Inc.: Niche Brand Prestige Moat
Inter Parfums leverages strong intangible assets in luxury fragrances, boasting a 64% gross margin but lower net margins at 11%. Unlike P&G’s scale, IPAR’s moat thrives on brand exclusivity and is expanding via international markets and new partnerships.
Scale & Brand Dominance vs. Niche Luxury Appeal
P&G’s broader scale and consistent ROIC above WACC by 11% create a wider moat than Inter Parfums’ niche focus and 9% ROIC premium. P&G is better positioned to defend market share amid intensifying competition and economic shifts.
Which stock offers better returns?
The past year reveals distinct stock price dynamics: both PG and IPAR faced overall declines, yet recent months show a marked rebound, highlighting shifting investor sentiment and trading momentum.
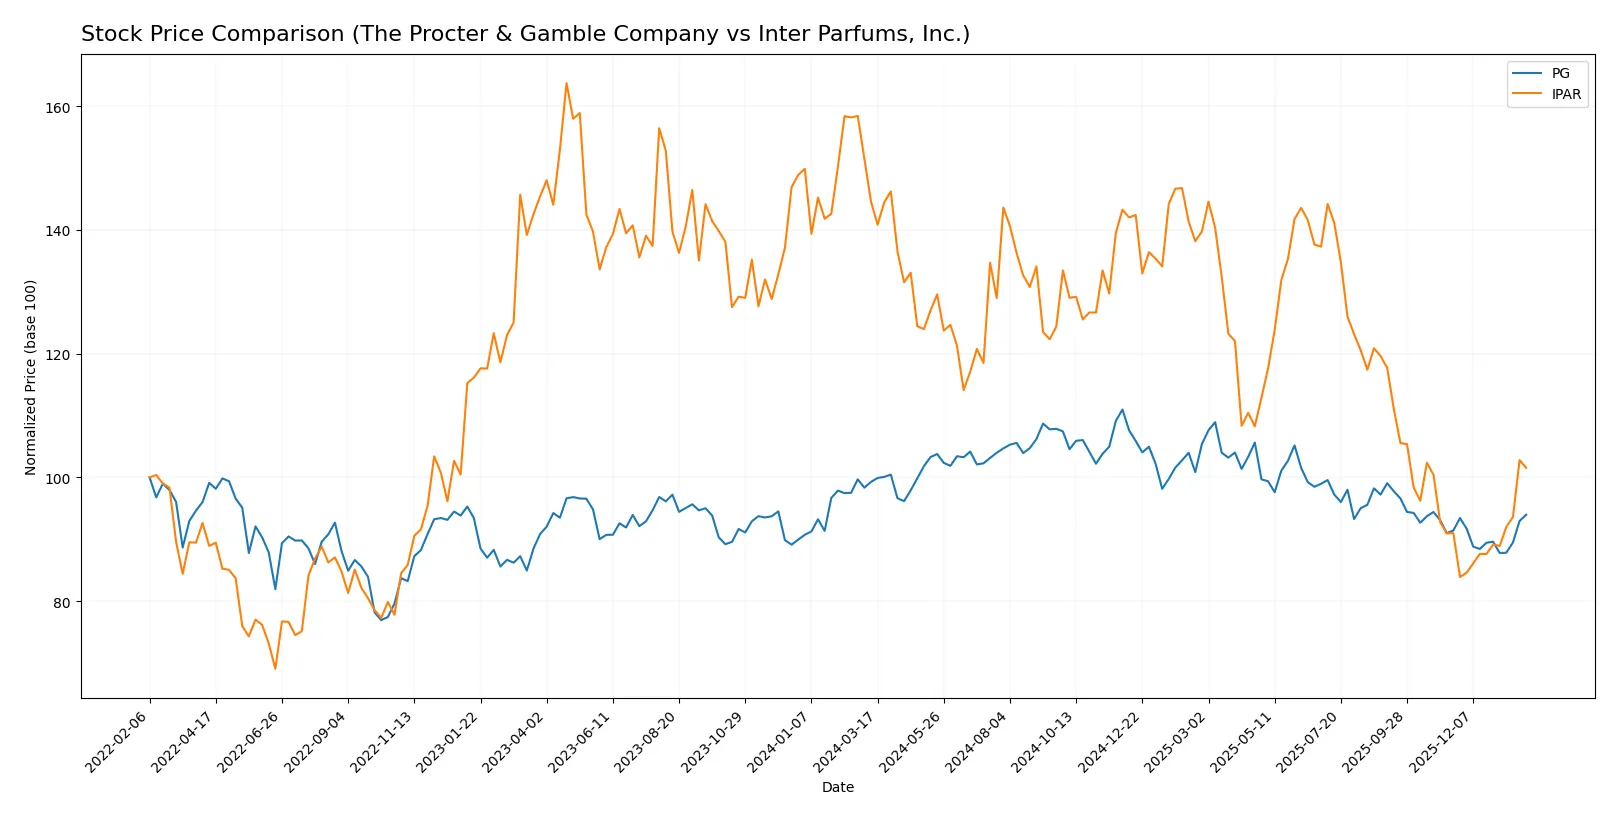
Trend Comparison
The Procter & Gamble Company (PG) experienced a 5.35% price decline over the past year, marking a bearish trend with accelerating downward momentum. It hit a low of 141.79 and peaked at 179.26, showing volatility with an 8.85 std deviation.
Inter Parfums, Inc. (IPAR) suffered a sharper 29.78% drop over the same period, also bearish with accelerating losses. Its range spanned from 80.61 to 141.02, and volatility was higher at a 16.83 std deviation.
Comparing both, PG delivered the stronger market performance with a smaller loss and less volatility, despite both showing bearish trends across the year.
Target Prices
Analysts project solid upside potential for both The Procter & Gamble Company and Inter Parfums, Inc. based on current consensus estimates.
| Company | Target Low | Target High | Consensus |
|---|---|---|---|
| The Procter & Gamble Company | 150 | 179 | 165.67 |
| Inter Parfums, Inc. | 103 | 112 | 107.5 |
The Procter & Gamble consensus target of 165.67 implies about a 9% gain from the current 151.77 price. Inter Parfums’ 107.5 target suggests nearly 10% upside from 97.57. Both stocks reflect moderate analyst optimism.

Don’t Let Luck Decide Your Entry Point
Optimize your entry points with our advanced ProRealTime indicators. You’ll get efficient buy signals with precise price targets for maximum performance. Start outperforming now!
How do institutions grade them?
The Procter & Gamble Company Grades
The following table summarizes recent institutional grades for The Procter & Gamble Company.
| Grading Company | Action | New Grade | Date |
|---|---|---|---|
| TD Cowen | Downgrade | Hold | 2026-01-27 |
| UBS | Maintain | Buy | 2026-01-23 |
| JP Morgan | Upgrade | Overweight | 2026-01-23 |
| Wells Fargo | Maintain | Overweight | 2026-01-23 |
| UBS | Maintain | Buy | 2026-01-14 |
| TD Cowen | Maintain | Buy | 2026-01-08 |
| Wells Fargo | Maintain | Overweight | 2026-01-05 |
| JP Morgan | Maintain | Neutral | 2025-12-18 |
| Jefferies | Upgrade | Buy | 2025-12-17 |
| JP Morgan | Maintain | Neutral | 2025-10-27 |
Inter Parfums, Inc. Grades
The following table summarizes recent institutional grades for Inter Parfums, Inc.
| Grading Company | Action | New Grade | Date |
|---|---|---|---|
| BWS Financial | Maintain | Neutral | 2026-01-29 |
| BWS Financial | Downgrade | Neutral | 2025-11-21 |
| Canaccord Genuity | Maintain | Buy | 2025-11-19 |
| Canaccord Genuity | Maintain | Buy | 2025-11-07 |
| Jefferies | Maintain | Buy | 2025-10-28 |
| BWS Financial | Maintain | Buy | 2025-10-22 |
| Canaccord Genuity | Maintain | Buy | 2025-10-21 |
| BWS Financial | Maintain | Buy | 2025-05-07 |
| Piper Sandler | Maintain | Overweight | 2025-04-24 |
| DA Davidson | Maintain | Buy | 2025-03-25 |
Which company has the best grades?
The Procter & Gamble Company shows a mix of Buy and Overweight ratings with a recent Hold downgrade. Inter Parfums, Inc. mostly holds Buy ratings but has more Neutral assessments recently. Investors may interpret P&G’s varied grades as signaling caution amid strength, while Inter Parfums’ grades suggest steady but less bullish sentiment.
Risks specific to each company
The following categories identify the critical pressure points and systemic threats facing both firms in the 2026 market environment:
1. Market & Competition
The Procter & Gamble Company
- Faces intense competition in consumer staples with pressure on margins from private labels.
Inter Parfums, Inc.
- Operates in a niche luxury fragrance market with high brand dependency and competitive innovation demands.
2. Capital Structure & Debt
The Procter & Gamble Company
- Moderate debt-to-equity ratio at 0.68 signals balanced leverage but current liquidity ratios are weak (0.7 current ratio).
Inter Parfums, Inc.
- Low leverage with debt-to-equity at 0.26 and strong liquidity (2.75 current ratio) offers financial flexibility.
3. Stock Volatility
The Procter & Gamble Company
- Low beta of 0.388 indicates defensive stock with minimal price swings relative to market.
Inter Parfums, Inc.
- Higher beta of 1.243 signals greater stock volatility and sensitivity to market fluctuations.
4. Regulatory & Legal
The Procter & Gamble Company
- Exposed to global regulatory scrutiny on consumer product safety and environmental compliance.
Inter Parfums, Inc.
- Faces regulatory risks primarily in fragrance ingredient approvals and international trade policies.
5. Supply Chain & Operations
The Procter & Gamble Company
- Large global supply chain complexity heightens risk of disruptions and cost inflation.
Inter Parfums, Inc.
- Smaller, more focused operations reduce complexity but increase vulnerability to supplier concentration.
6. ESG & Climate Transition
The Procter & Gamble Company
- Increasing pressure to meet aggressive sustainability goals and reduce carbon footprint across massive operations.
Inter Parfums, Inc.
- ESG efforts less visible, exposing potential reputational risks amid rising investor focus on climate transition.
7. Geopolitical Exposure
The Procter & Gamble Company
- Broad global footprint subjects it to geopolitical tensions, tariffs, and currency volatility.
Inter Parfums, Inc.
- More concentrated market exposure limits geopolitical risk but increases dependency on key regions.
Which company shows a better risk-adjusted profile?
Inter Parfums’ strongest risk lies in its market niche and stock volatility, while Procter & Gamble’s liquidity and supply chain present key challenges. Inter Parfums displays a better risk-adjusted profile, supported by robust liquidity and low leverage. Procter & Gamble’s weak current ratio amidst complex operations raises caution for investors focused on financial resilience.
Final Verdict: Which stock to choose?
The Procter & Gamble Company’s superpower lies in its resilient economic moat and consistent value creation. Its ability to maintain a strong ROIC well above WACC signals durable competitive advantages. The main point of vigilance remains its below-par liquidity ratios, suggesting caution for cash-strapped scenarios. It suits portfolios seeking steady, defensive income with growth potential.
Inter Parfums, Inc. commands a strategic moat through high asset turnover and expanding ROIC, reflecting efficient capital use in a niche market. It offers a safer liquidity profile and lower leverage than Procter & Gamble, which appeals to risk-conscious investors. Its rapid revenue and earnings growth fit well within a GARP (Growth at a Reasonable Price) framework.
If you prioritize stable, long-term value with a proven moat, Procter & Gamble outshines due to its consistent profitability and dividend yield. However, if you seek dynamic growth backed by operational efficiency and a cleaner balance sheet, Inter Parfums offers better stability and growth potential despite a higher valuation premium. Each scenario depends on your risk tolerance and investment horizon.
Disclaimer: Investment carries a risk of loss of initial capital. The past performance is not a reliable indicator of future results. Be sure to understand risks before making an investment decision.
Go Further
I encourage you to read the complete analyses of The Procter & Gamble Company and Inter Parfums, Inc. to enhance your investment decisions: