In the competitive world of household and personal products, Inter Parfums, Inc. (IPAR) and Nu Skin Enterprises, Inc. (NUS) stand out as prominent players with distinct approaches. Inter Parfums excels in luxury fragrances with a strong global brand portfolio, while Nu Skin focuses on innovative beauty and wellness solutions, blending skincare and nutritional supplements. This comparison explores which company offers the most compelling investment opportunity for your portfolio in 2026.
Table of contents
Companies Overview
I will begin the comparison between Inter Parfums, Inc. and Nu Skin Enterprises, Inc. by providing an overview of these two companies and their main differences.
Inter Parfums, Inc. Overview
Inter Parfums, Inc. manufactures, markets, and distributes a variety of fragrances and fragrance-related products globally. Operating through European and U.S. segments, it offers products under multiple luxury and lifestyle brand names such as Coach and Jimmy Choo. The company targets department stores, specialty retailers, and e-commerce channels, positioning itself within the household and personal products industry with a market cap of approximately 2.87B USD.
Nu Skin Enterprises, Inc. Overview
Nu Skin Enterprises, Inc. develops and distributes beauty and wellness products worldwide, including skin care systems, nutritional supplements, and weight management products. It promotes sales directly and through distributors, focusing on brands like Nu Skin and ageLOC. With a workforce of about 3,100 employees and a market cap near 518M USD, Nu Skin operates in the consumer defensive sector, emphasizing research and product development in personal care and wellness.
Key similarities and differences
Both companies operate in the household and personal products industry, offering branded personal care items. Inter Parfums focuses primarily on fragrance products marketed through retail and e-commerce, while Nu Skin emphasizes skin care and wellness products sold via direct sales and distribution networks. Inter Parfums has a higher market capitalization and fewer employees compared to Nu Skin, reflecting differences in scale and business model approach.
Income Statement Comparison
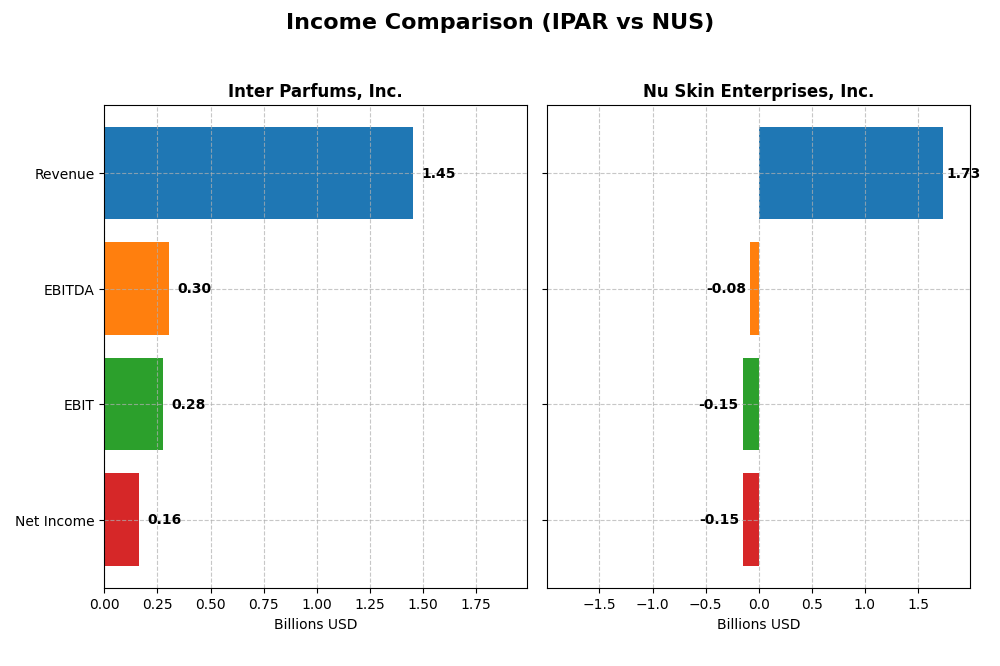
The table below presents a side-by-side comparison of key income statement metrics for Inter Parfums, Inc. and Nu Skin Enterprises, Inc. for the fiscal year 2024.
| Metric | Inter Parfums, Inc. (IPAR) | Nu Skin Enterprises, Inc. (NUS) |
|---|---|---|
| Market Cap | 2.87B | 518M |
| Revenue | 1.45B | 1.73B |
| EBITDA | 305M | -79M |
| EBIT | 276M | -149M |
| Net Income | 164M | -147M |
| EPS | 5.13 | -2.95 |
| Fiscal Year | 2024 | 2024 |
Income Statement Interpretations
Inter Parfums, Inc.
Inter Parfums, Inc. displayed strong revenue growth from 2020 to 2024, surging from $539M to $1.45B. Net income followed suit, increasing significantly over the period. Margins remained healthy, with a gross margin at 63.85% and net margin at 11.32% in 2024. The latest year saw favorable revenue and profit growth, though net margin slightly declined by 2.32%.
Nu Skin Enterprises, Inc.
Nu Skin experienced declining revenue, down from $2.58B in 2020 to $1.73B in 2024, alongside a sharp drop in net income, which turned negative in 2024 at -$147M. Gross margins stayed favorable at 68.23%, but EBIT and net margins were negative in 2024, reflecting operational and profitability struggles. The most recent year showed worsening profitability and revenue contraction.
Which one has the stronger fundamentals?
Inter Parfums demonstrates stronger fundamentals with consistent revenue and net income growth, favorable margins, and positive earnings per share trends. In contrast, Nu Skin faces declining revenue, negative profitability margins, and deteriorating earnings. These evaluations indicate Inter Parfums’ income statement is fundamentally more robust over the period analyzed.
Financial Ratios Comparison
Below is a comparison of key financial ratios for Inter Parfums, Inc. (IPAR) and Nu Skin Enterprises, Inc. (NUS) based on their latest fiscal year data from 2024.
| Ratios | Inter Parfums, Inc. (IPAR) | Nu Skin Enterprises, Inc. (NUS) |
|---|---|---|
| ROE | 22.1% | -22.5% |
| ROIC | 18.6% | -10.4% |
| P/E | 25.6 | -2.33 |
| P/B | 5.66 | 0.53 |
| Current Ratio | 2.75 | 1.82 |
| Quick Ratio | 1.63 | 1.17 |
| D/E (Debt-to-Equity) | 0.26 | 0.73 |
| Debt-to-Assets | 13.6% | 32.6% |
| Interest Coverage | 35.6 | -5.74 |
| Asset Turnover | 1.03 | 1.18 |
| Fixed Asset Turnover | 8.14 | 3.71 |
| Payout ratio | 58.4% | -8.14% |
| Dividend yield | 2.28% | 3.49% |
Interpretation of the Ratios
Inter Parfums, Inc.
Inter Parfums shows strong financial health with favorable net margin (11.32%), ROE (22.07%), and ROIC (18.62%), alongside a robust current ratio of 2.75 and low debt metrics. However, valuation ratios like PE (25.63) and PB (5.66) are unfavorable, indicating a relatively high market price. The company pays dividends with a 2.28% yield, supported by a healthy payout ratio and free cash flow coverage, though buyback risks should be monitored.
Nu Skin Enterprises, Inc.
Nu Skin’s ratios reveal weaknesses with negative net margin (-8.46%), ROE (-22.5%), and ROIC (-10.4%), signaling operational and profitability challenges. Liquidity ratios are satisfactory, but interest coverage is negative, reflecting financial strain. Despite this, it maintains a 3.49% dividend yield, likely sustained by a reinvestment strategy and prioritization of R&D, with cautious use of share buybacks given the negative cash flow trends.
Which one has the best ratios?
Inter Parfums exhibits a more favorable overall ratio profile, with strong profitability, liquidity, and leverage metrics, despite some valuation concerns. Nu Skin, while offering a higher dividend yield, faces significant profitability and coverage weaknesses that temper its ratio strength. Thus, Inter Parfums holds the advantage based on its robust financial ratios and stability indicators.
Strategic Positioning
This section compares the strategic positioning of Inter Parfums, Inc. and Nu Skin Enterprises, Inc. in terms of market position, key segments, and exposure to technological disruption:
Inter Parfums, Inc.
- Mid-cap player in household products with moderate beta and competitive pressure from luxury brands.
- Focus on fragrance and cosmetic products sold globally through retail, specialty, and e-commerce channels.
- Limited exposure to technological disruption, relying on established brand portfolios and traditional retail channels.
Nu Skin Enterprises, Inc.
- Smaller market cap, diversified consumer products with lower beta, facing pressure in wellness sector.
- Broad portfolio including skin care, nutritional supplements, and wellness devices; direct sales and distributors.
- Moderate exposure through product innovation in skin treatment devices and nutritional supplements.
Inter Parfums, Inc. vs Nu Skin Enterprises, Inc. Positioning
Inter Parfums operates a concentrated portfolio focused on fragrances and cosmetics with global retail presence, while Nu Skin maintains a diversified product range integrating wellness and technology-driven skin care, balancing direct sales and retail distribution.
Which has the best competitive advantage?
Inter Parfums shows a very favorable moat with growing ROIC and durable competitive advantage, whereas Nu Skin’s declining ROIC indicates a very unfavorable moat and value destruction over recent years.
Stock Comparison
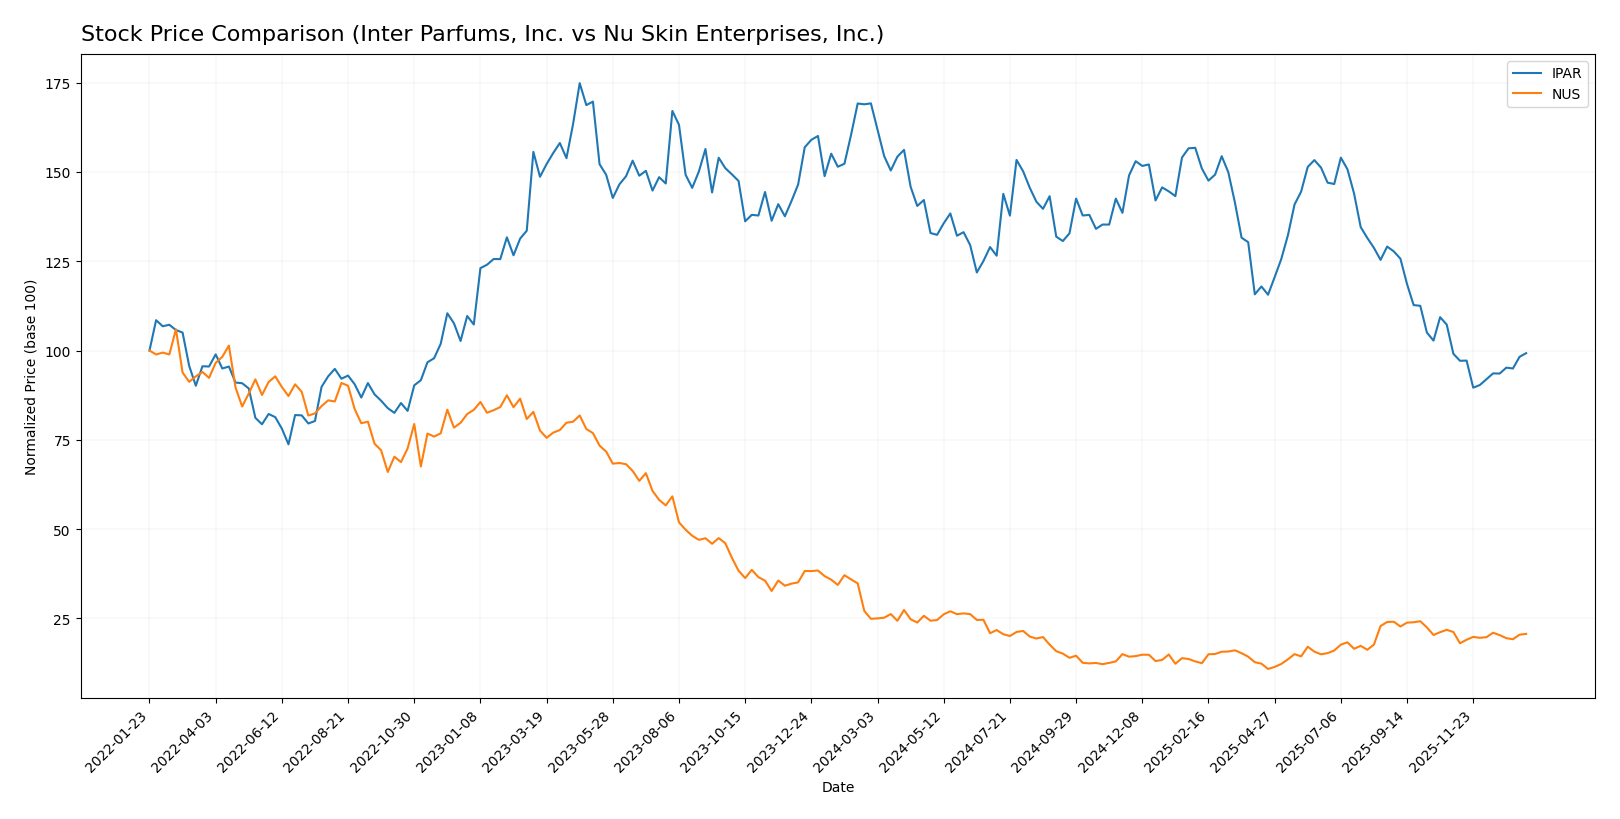
The stock prices of Inter Parfums, Inc. (IPAR) and Nu Skin Enterprises, Inc. (NUS) have experienced significant declines over the past 12 months, with varying degrees of volatility and recent trading dynamics reflecting cautious buyer behavior.
Trend Analysis
Inter Parfums, Inc. showed a bearish trend over the last 12 months with a -41.33% price decline and accelerating downtrend, accompanied by high volatility (std deviation 17.11). Recent weeks indicate a neutral trend with minimal price change (0.17%).
Nu Skin Enterprises, Inc. also exhibited a bearish trend, falling -16.93% over the past year, with moderate volatility (std deviation 2.34) and accelerating decline. The recent trend remains bearish with a -2.52% drop and low volatility.
Comparing both, Inter Parfums delivered the larger price decline and greater volatility, while Nu Skin showed a less severe loss. Neither stock showed positive performance over the period.
Target Prices
Analysts present a clear consensus on target prices for Inter Parfums, Inc. and Nu Skin Enterprises, Inc.
| Company | Target High | Target Low | Consensus |
|---|---|---|---|
| Inter Parfums, Inc. | 125 | 103 | 114 |
| Nu Skin Enterprises, Inc. | 11 | 11 | 11 |
The consensus target for Inter Parfums at 114 USD is significantly above its current price of 89.3 USD, suggesting potential upside. Nu Skin’s target of 11 USD is slightly above its current price of 10.45 USD, indicating modest expected growth.
Analyst Opinions Comparison
This section compares analysts’ ratings and grades for Inter Parfums, Inc. and Nu Skin Enterprises, Inc.:
Rating Comparison
Inter Parfums, Inc. Rating
- Rating: B+, classified as Very Favorable by analysts.
- Discounted Cash Flow Score: Moderate at 3/5.
- ROE Score: Very Favorable, highest score of 5/5.
- ROA Score: Very Favorable, top score of 5/5.
- Debt To Equity Score: Moderate at 3/5 indicating average risk.
- Overall Score: Moderate at 3/5 reflecting balanced performance.
Nu Skin Enterprises, Inc. Rating
- Rating: A, classified as Very Favorable by analysts.
- Discounted Cash Flow Score: Favorable at 4/5.
- ROE Score: Favorable, with a 4/5 score.
- ROA Score: Favorable, with a 4/5 score.
- Debt To Equity Score: Moderate at 3/5 indicating average risk.
- Overall Score: Favorable at 4/5 indicating stronger overall metrics.
Which one is the best rated?
Nu Skin Enterprises holds a higher overall rating (A) and scores favorably across discounted cash flow, ROE, ROA, and overall metrics compared to Inter Parfums, which has a B+ rating and moderate overall scores.
Scores Comparison
Here is a comparison of the financial health scores for Inter Parfums, Inc. and Nu Skin Enterprises, Inc.:
IPAR Scores
- Altman Z-Score: 6.12, in the safe zone indicating low bankruptcy risk.
- Piotroski Score: 5, reflecting average financial strength.
NUS Scores
- Altman Z-Score: 3.94, also in the safe zone with low bankruptcy risk.
- Piotroski Score: 8, reflecting very strong financial health.
Which company has the best scores?
Nu Skin Enterprises, Inc. has a lower bankruptcy risk and a significantly stronger Piotroski Score of 8 compared to Inter Parfums’ 5, indicating better overall financial health based on these metrics.
Grades Comparison
Here is a comparison of the recent grades from established grading companies for Inter Parfums, Inc. and Nu Skin Enterprises, Inc.:
Inter Parfums, Inc. Grades
The following table summarizes the latest grading actions from recognized firms for Inter Parfums, Inc.:
| Grading Company | Action | New Grade | Date |
|---|---|---|---|
| BWS Financial | Downgrade | Neutral | 2025-11-21 |
| Canaccord Genuity | Maintain | Buy | 2025-11-19 |
| Canaccord Genuity | Maintain | Buy | 2025-11-07 |
| Jefferies | Maintain | Buy | 2025-10-28 |
| BWS Financial | Maintain | Buy | 2025-10-22 |
| Canaccord Genuity | Maintain | Buy | 2025-10-21 |
| BWS Financial | Maintain | Buy | 2025-05-07 |
| Piper Sandler | Maintain | Overweight | 2025-04-24 |
| DA Davidson | Maintain | Buy | 2025-03-25 |
| BWS Financial | Maintain | Buy | 2025-03-17 |
Overall, Inter Parfums has predominantly maintained Buy ratings, with a recent slight downgrade by BWS Financial to Neutral.
Nu Skin Enterprises, Inc. Grades
The following table outlines the latest grading actions from recognized firms for Nu Skin Enterprises, Inc.:
| Grading Company | Action | New Grade | Date |
|---|---|---|---|
| DA Davidson | Maintain | Neutral | 2024-12-20 |
| Citigroup | Maintain | Neutral | 2024-10-22 |
| DA Davidson | Maintain | Neutral | 2024-08-12 |
| Citigroup | Maintain | Neutral | 2024-08-09 |
| DA Davidson | Maintain | Neutral | 2024-05-09 |
| DA Davidson | Maintain | Neutral | 2024-01-05 |
| Stifel | Maintain | Hold | 2023-10-16 |
| Stifel | Maintain | Hold | 2023-10-15 |
| Citigroup | Maintain | Neutral | 2023-09-29 |
| Citigroup | Maintain | Neutral | 2023-09-28 |
Nu Skin Enterprises consistently received Neutral or Hold ratings with no recent upgrades or downgrades.
Which company has the best grades?
Inter Parfums, Inc. holds a stronger and more positive consensus with mostly Buy ratings and one Overweight, while Nu Skin Enterprises, Inc. has maintained Neutral to Hold grades. This difference may imply a more favorable outlook from analysts for Inter Parfums, potentially affecting investor sentiment and portfolio weighting decisions.
Strengths and Weaknesses
The table below compares key strengths and weaknesses of Inter Parfums, Inc. (IPAR) and Nu Skin Enterprises, Inc. (NUS) based on recent financial performance, market position, and strategic attributes.
| Criterion | Inter Parfums, Inc. (IPAR) | Nu Skin Enterprises, Inc. (NUS) |
|---|---|---|
| Diversification | Moderate product diversification, focused mainly on fragrances | More diversified product segments including personal care, manufacturing, and technology-related products |
| Profitability | Strong profitability with 11.32% net margin, 22.07% ROE, and 18.62% ROIC | Negative profitability with -8.46% net margin, -22.5% ROE, and -10.4% ROIC |
| Innovation | Demonstrates durable competitive advantage with growing ROIC | Declining profitability indicating challenges in innovation and competitive positioning |
| Global presence | Solid global footprint, especially in Europe and North America | Global operations but struggling to maintain value creation |
| Market Share | Stable and growing market share in fragrance segment | Variable market share with financial struggles impacting competitiveness |
Key takeaways: Inter Parfums shows strong value creation with growing profitability and efficient capital use, making it a more attractive investment. Nu Skin faces significant profitability challenges and shrinking returns, signaling higher risk for investors.
Risk Analysis
The table below summarizes key risks for Inter Parfums, Inc. (IPAR) and Nu Skin Enterprises, Inc. (NUS) based on their latest financial and operational profiles in 2024.
| Metric | Inter Parfums, Inc. (IPAR) | Nu Skin Enterprises, Inc. (NUS) |
|---|---|---|
| Market Risk | Beta 1.24, moderate volatility in luxury goods market | Beta 0.98, lower volatility but exposure to wellness trends |
| Debt level | Low leverage: Debt/Equity 0.26, favorable | Moderate leverage: Debt/Equity 0.73, neutral |
| Regulatory Risk | Moderate; global cosmetics regulations | Moderate; direct selling and nutritional supplements regulations |
| Operational Risk | Diverse brand portfolio, medium employee base (647) | Larger workforce (3100), supply chain complexity |
| Environmental Risk | Moderate; increasing pressure on sustainable sourcing | Moderate; focus on wellness products, potential for scrutiny |
| Geopolitical Risk | Exports to multiple regions; currency and trade risks | Significant China operations; geopolitical tensions may impact sales |
Both companies face market uncertainties, but IPAR’s stronger balance sheet and favorable debt metrics reduce financial risk compared to NUS. NUS’s negative profitability and interest coverage highlight operational and financial vulnerabilities despite its strong Piotroski score. Geopolitical tensions affecting NUS’s China business represent a notable risk. Overall, market and operational risks carry the highest impact.
Which Stock to Choose?
Inter Parfums, Inc. (IPAR) shows a strong income evolution with 169% revenue growth and 330% net income growth over 2020-2024. Its financial ratios are largely favorable, including a 22.07% ROE and 18.62% ROIC, supported by low debt and a very favorable rating of B+. The company demonstrates a very favorable moat with growing ROIC exceeding WACC, indicating durable value creation.
Nu Skin Enterprises, Inc. (NUS) experienced an unfavorable income evolution marked by declining revenues (-33%) and net income (-177%) over the same period. While some financial ratios such as current ratio and dividend yield are favorable, core profitability metrics like ROE (-22.5%) and ROIC (-10.4%) are unfavorable. It carries higher debt levels and a very unfavorable moat with declining ROIC below WACC, despite a very favorable overall rating of A.
For investors prioritizing quality and durable profitability, IPAR’s positive income growth and strong moat might appear more aligned with these goals. Conversely, investors focusing on value or dividend yield could find NUS’s lower valuation metrics and favorable rating as points of interest, despite its weaker profitability and income trends. The choice could thus depend on one’s risk tolerance and strategic focus.
Disclaimer: Investment carries a risk of loss of initial capital. The past performance is not a reliable indicator of future results. Be sure to understand risks before making an investment decision.
Go Further
I encourage you to read the complete analyses of Inter Parfums, Inc. and Nu Skin Enterprises, Inc. to enhance your investment decisions: