Inter Parfums, Inc. (IPAR) and Newell Brands Inc. (NWL) both operate in the Household & Personal Products industry, yet they target distinct market niches with overlapping consumer touchpoints. Inter Parfums focuses on luxury fragrances and cosmetics, while Newell Brands offers a diverse portfolio of everyday consumer and commercial products. This comparison explores their innovation strategies and market positioning to help you decide which company deserves a spot in your investment portfolio. Let’s dive in and uncover which stock stands out for investors.

Table of contents
Companies Overview
I will begin the comparison between Inter Parfums, Inc. and Newell Brands Inc. by providing an overview of these two companies and their main differences.
Inter Parfums, Inc. Overview
Inter Parfums, Inc. manufactures, markets, and distributes fragrances and related products globally, operating through European and US segments. The company offers a variety of brands including Coach, Jimmy Choo, and Montblanc. It targets department stores, specialty retailers, and e-commerce channels, positioning itself as a key player in the personal products industry with a market cap of approximately 2.87B USD.
Newell Brands Inc. Overview
Newell Brands Inc. designs, manufactures, and distributes consumer and commercial products worldwide across five segments, including Commercial Solutions and Home Appliances. Its portfolio includes brands like Rubbermaid, Calphalon, and Yankee Candle. Serving a wide range of retail channels, Newell operates with a 1.74B USD market cap and a significantly larger workforce of over 23K employees.
Key similarities and differences
Both companies operate in the Consumer Defensive sector focusing on household and personal products, but Inter Parfums specializes in fragrances while Newell offers a diversified product range across multiple segments. Inter Parfums has a smaller market cap and employee base, emphasizing luxury brands, whereas Newell covers broader markets with diverse consumer goods, reflecting differences in scale and business model focus.
Income Statement Comparison
This table presents a side-by-side comparison of key income statement metrics for Inter Parfums, Inc. and Newell Brands Inc. for the fiscal year 2024.

| Metric | Inter Parfums, Inc. (IPAR) | Newell Brands Inc. (NWL) |
|---|---|---|
| Market Cap | 2.87B | 1.74B |
| Revenue | 1.45B | 7.58B |
| EBITDA | 305M | 358M |
| EBIT | 276M | 35M |
| Net Income | 164M | -216M |
| EPS | 5.13 | -0.52 |
| Fiscal Year | 2024 | 2024 |
Income Statement Interpretations
Inter Parfums, Inc.
Inter Parfums demonstrated consistent revenue and net income growth from 2020 to 2024, with revenue rising from 539M to 1.45B and net income from 38M to 164M. Margins remained strong, highlighted by a gross margin at 63.85% and an EBIT margin of 19.02%. In 2024, revenue growth slowed slightly to 10.22%, while net margin dipped by 2.32%, although EPS increased by 7.79%.
Newell Brands Inc.
Newell Brands experienced declining revenue over the period, falling from 9.39B in 2020 to 7.58B in 2024. Despite this, net income improved from a loss of 770M in 2020 to a loss of 216M in 2024, reflecting some recovery. Gross margin stood at 33.61%, but net margin remained negative at -2.85%. The latest year saw a 6.77% revenue decline but a favorable 115.42% EBIT growth and a 40.28% net margin improvement.
Which one has the stronger fundamentals?
Inter Parfums shows stronger fundamentals with significant revenue and net income growth, robust margins, and mostly favorable income statement metrics. Newell Brands, while improving net income and margins recently, faces ongoing revenue declines and negative net margins. The contrast lies in Inter Parfums’ consistent profitability against Newell’s recovery from losses, suggesting more stability for Inter Parfums in this comparison.
Financial Ratios Comparison
The table below presents a side-by-side comparison of key financial ratios for Inter Parfums, Inc. (IPAR) and Newell Brands Inc. (NWL) based on their most recent fiscal year data ending 2024.
| Ratios | Inter Parfums, Inc. (IPAR) | Newell Brands Inc. (NWL) |
|---|---|---|
| ROE | 22.1% | -7.9% |
| ROIC | 18.6% | 0.6% |
| P/E | 25.6 | -19.2 |
| P/B | 5.66 | 1.50 |
| Current Ratio | 2.75 | 1.14 |
| Quick Ratio | 1.63 | 0.56 |
| D/E (Debt-to-Equity) | 0.26 | 1.86 |
| Debt-to-Assets | 13.6% | 46.6% |
| Interest Coverage | 35.6 | 0.23 |
| Asset Turnover | 1.03 | 0.69 |
| Fixed Asset Turnover | 8.14 | 4.67 |
| Payout ratio | 58.4% | -54.6% |
| Dividend yield | 2.28% | 2.85% |
Interpretation of the Ratios
Inter Parfums, Inc.
Inter Parfums exhibits predominantly strong financial ratios, with favorable net margin at 11.32%, ROE of 22.07%, and ROIC of 18.62%, indicating efficient profitability and capital use. Liquidity and leverage ratios are solid, supported by a current ratio of 2.75 and low debt-to-assets at 13.62%. The company pays a dividend with a 2.28% yield, reflecting sustainable shareholder returns backed by free cash flow coverage and moderate payout risk.
Newell Brands Inc.
Newell Brands shows weak profitability indicators, including a negative net margin of -2.85% and ROE at -7.85%, signaling operational challenges. Its liquidity is moderate with a current ratio of 1.14, but a high debt-to-equity ratio of 1.86 and poor interest coverage of 0.12 raise financial risk concerns. Despite these, the company offers a 2.85% dividend yield, likely supported by a strategic focus on cash flow management amid restructuring or reinvestment phases.
Which one has the best ratios?
Inter Parfums clearly displays stronger and more favorable ratios overall, particularly in profitability, liquidity, and leverage metrics. Newell Brands faces multiple unfavorable profitability and solvency ratios, reflecting operational strain. While both pay dividends, Inter Parfums’ balanced financial health and sustainable returns contrast with Newell’s elevated risks and weaker performance, making Inter Parfums’ ratios more robust.
Strategic Positioning
This section compares the strategic positioning of Inter Parfums, Inc. and Newell Brands Inc. across Market position, Key segments, and Exposure to technological disruption:
Inter Parfums, Inc.
- Mid-cap player in fragrances with moderate beta of 1.243, facing consumer product competition.
- Focused on fragrances and cosmetics under multiple luxury and lifestyle brands, split into European and US segments.
- Limited explicit exposure to technological disruption noted in fragrance manufacturing and distribution.
Newell Brands Inc.
- Smaller market cap, diversified consumer products with lower beta of 0.888, facing broad competition.
- Operates five segments including Commercial Solutions, Home Appliances, Learning and Development, Outdoor and Recreation.
- Exposure through innovation in consumer goods and home security products, impacting various segments.
Inter Parfums, Inc. vs Newell Brands Inc. Positioning
Inter Parfums maintains a concentrated focus on fragrance products with luxury branding, benefiting from niche expertise but limited diversification. Newell Brands operates a diversified portfolio across consumer and commercial products, offering broader market coverage but with complexity in managing multiple segments.
Which has the best competitive advantage?
Inter Parfums shows a very favorable moat with strong value creation and growing ROIC, indicating durable competitive advantage. Newell Brands is slightly unfavorable, shedding value despite improving profitability, suggesting weaker competitive positioning.
Stock Comparison
The stock price movements of Inter Parfums, Inc. and Newell Brands Inc. over the past 12 months reveal significant bearish trends with accelerating declines, alongside notable recent divergences in short-term performance and trading dynamics.
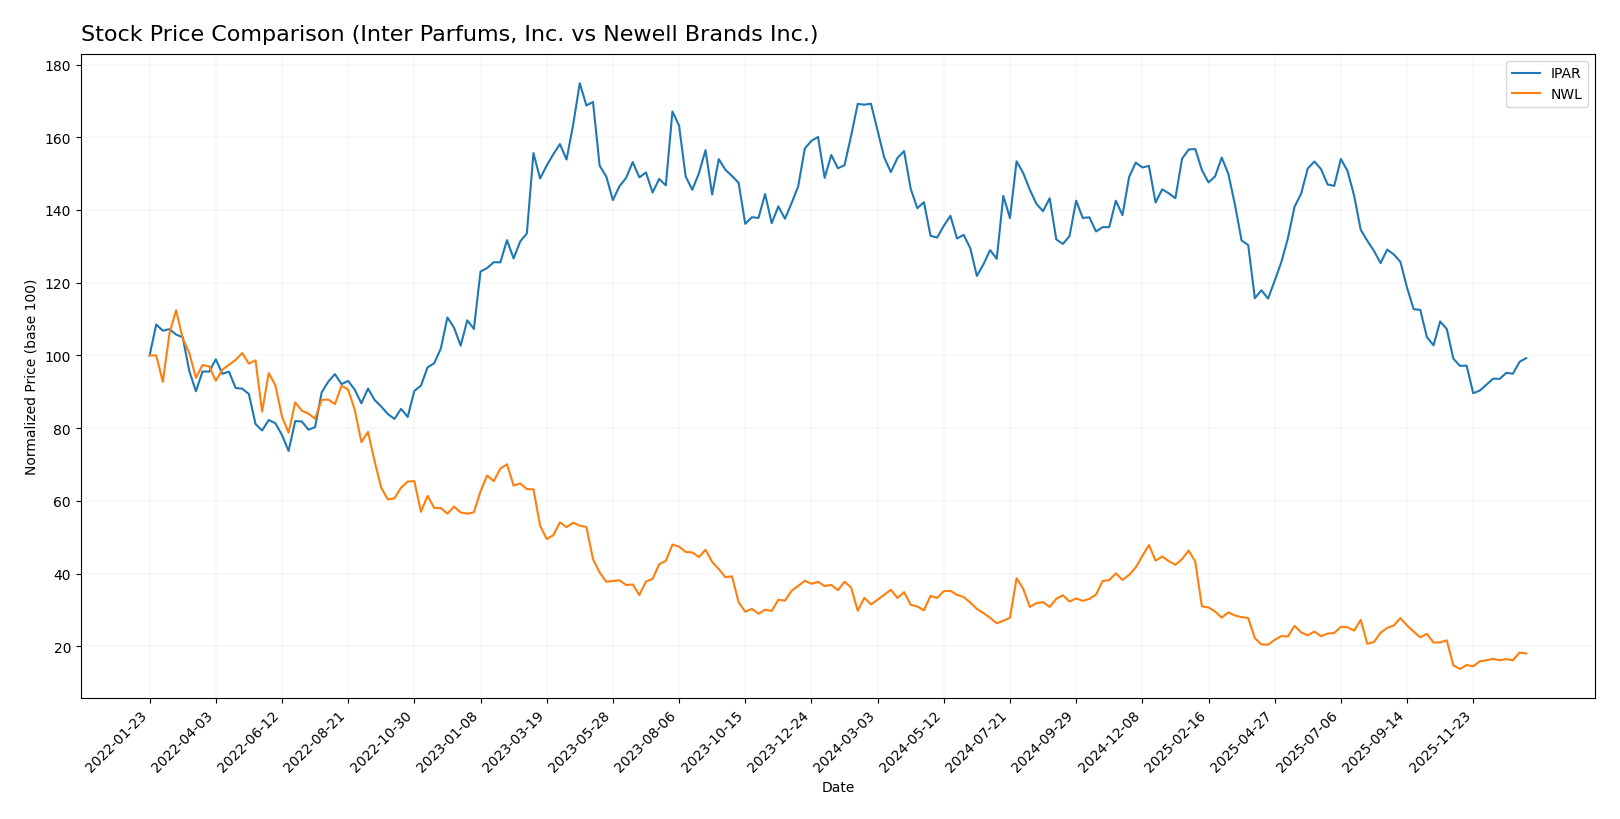
Trend Analysis
Inter Parfums, Inc. experienced a bearish trend with a -41.33% price change over the past year, marked by acceleration and high volatility (std dev 17.11). The stock ranged between 80.61 and 152.22, with a recent neutral trend showing a slight 0.17% increase.
Newell Brands Inc. also showed a bearish trend over the past year with a -42.76% price change and accelerating decline, but with lower volatility (std dev 1.87). The stock fluctuated between 3.17 and 11.01, followed by a recent strong 22.06% price increase.
Comparing both, Newell Brands delivered the highest recent market performance despite similar annual declines, while Inter Parfums showed slightly more volatility and a stable short-term trend.
Target Prices
Analysts provide a clear consensus on target prices for Inter Parfums, Inc. and Newell Brands Inc., indicating their expected valuation ranges.
| Company | Target High | Target Low | Consensus |
|---|---|---|---|
| Inter Parfums, Inc. | 125 | 103 | 114 |
| Newell Brands Inc. | 7 | 4 | 5.08 |
Inter Parfums’ consensus target of 114 suggests upside potential from the current price of 89.3 USD. Newell Brands’ consensus target of 5.08 is modestly above its current 4.15 USD, reflecting cautious optimism among analysts.
Analyst Opinions Comparison
This section compares analysts’ ratings and grades for Inter Parfums, Inc. and Newell Brands Inc.:
Rating Comparison
IPAR Rating
- Rating: B+ indicating a very favorable overall evaluation.
- Discounted Cash Flow Score: Moderate at 3, reflecting an average valuation.
- ROE Score: Very favorable at 5, showing efficient profit generation.
- ROA Score: Very favorable at 5, demonstrating effective asset utilization.
- Debt To Equity Score: Moderate at 3, suggesting balanced financial risk.
- Overall Score: Moderate at 3, summarizing the company’s financial standing.
NWL Rating
- Rating: C+ with a very favorable overall evaluation.
- Discounted Cash Flow Score: Very favorable at 5, indicating strong valuation.
- ROE Score: Very unfavorable at 1, indicating weak profitability from equity.
- ROA Score: Very unfavorable at 1, showing poor asset efficiency.
- Debt To Equity Score: Very unfavorable at 1, indicating high financial risk.
- Overall Score: Moderate at 2, reflecting a weaker overall financial position.
Which one is the best rated?
Based strictly on provided data, IPAR is better rated with a B+ rating, very favorable ROE and ROA scores, and moderate overall and debt-to-equity scores. NWL has a lower C+ rating and several very unfavorable scores despite a strong discounted cash flow score.
Scores Comparison
Here is a comparison of the Altman Z-Score and Piotroski Score for both companies:
IPAR Scores
- Altman Z-Score: 6.12, indicating a safe zone with low bankruptcy risk.
- Piotroski Score: 5, reflecting average financial strength.
NWL Scores
- Altman Z-Score: 0.51, indicating distress zone and high bankruptcy risk.
- Piotroski Score: 4, also reflecting average financial strength.
Which company has the best scores?
Based on the provided data, IPAR has a significantly better Altman Z-Score, placing it in the safe zone, whereas NWL is in the distress zone. Both have average Piotroski Scores, but IPAR’s Altman Z-Score indicates stronger financial stability overall.
Grades Comparison
Here is the comparison of recent analyst grades for Inter Parfums, Inc. and Newell Brands Inc.:
Inter Parfums, Inc. Grades
The table below shows recent grades assigned by verified grading companies to Inter Parfums, Inc.:
| Grading Company | Action | New Grade | Date |
|---|---|---|---|
| BWS Financial | Downgrade | Neutral | 2025-11-21 |
| Canaccord Genuity | Maintain | Buy | 2025-11-19 |
| Canaccord Genuity | Maintain | Buy | 2025-11-07 |
| Jefferies | Maintain | Buy | 2025-10-28 |
| BWS Financial | Maintain | Buy | 2025-10-22 |
| Canaccord Genuity | Maintain | Buy | 2025-10-21 |
| BWS Financial | Maintain | Buy | 2025-05-07 |
| Piper Sandler | Maintain | Overweight | 2025-04-24 |
| DA Davidson | Maintain | Buy | 2025-03-25 |
| BWS Financial | Maintain | Buy | 2025-03-17 |
Inter Parfums’ grades predominantly show a “Buy” consensus, with a single recent downgrade to “Neutral” by BWS Financial.
Newell Brands Inc. Grades
The table below lists recent grades assigned by verified grading companies to Newell Brands Inc.:
| Grading Company | Action | New Grade | Date |
|---|---|---|---|
| Citigroup | Maintain | Neutral | 2025-12-17 |
| UBS | Maintain | Neutral | 2025-12-02 |
| Canaccord Genuity | Maintain | Buy | 2025-11-03 |
| RBC Capital | Maintain | Sector Perform | 2025-11-03 |
| JP Morgan | Maintain | Overweight | 2025-11-03 |
| Citigroup | Maintain | Neutral | 2025-11-03 |
| JP Morgan | Maintain | Overweight | 2025-10-23 |
| Citigroup | Maintain | Neutral | 2025-10-09 |
| Citigroup | Maintain | Neutral | 2025-09-16 |
| Canaccord Genuity | Maintain | Buy | 2025-08-04 |
Grades for Newell Brands are mixed, with a consensus leaning toward “Neutral” or “Hold,” but also some “Buy” and “Overweight” ratings.
Which company has the best grades?
Inter Parfums, Inc. has received stronger and more consistent “Buy” ratings compared to Newell Brands Inc., which has a more mixed consensus including multiple “Neutral” and “Hold” ratings. This difference could affect investor confidence differently, potentially influencing portfolio decisions based on perceived analyst conviction.
Strengths and Weaknesses
Below is a comparative overview of key strengths and weaknesses for Inter Parfums, Inc. (IPAR) and Newell Brands Inc. (NWL) based on the latest financial and strategic data.
| Criterion | Inter Parfums, Inc. (IPAR) | Newell Brands Inc. (NWL) |
|---|---|---|
| Diversification | Limited product range focused mainly on fragrances, less diversified | Highly diversified across Home & Commercial, Learning & Development, Outdoor segments |
| Profitability | Strong profitability with net margin 11.32%, ROIC 18.62% (very favorable) | Negative net margin (-2.85%), low ROIC 0.64% (unfavorable) |
| Innovation | Demonstrates durable competitive advantage and growing ROIC | Improving profitability trend but still destroying value overall |
| Global presence | Solid international presence, especially in luxury markets | Broad global footprint with multiple product segments |
| Market Share | Niche leader in fragrance sector, concentrated market share | Large market share in consumer goods but facing profitability challenges |
Key takeaway: Inter Parfums exhibits strong profitability and a durable moat driven by focused innovation and efficient capital use, while Newell Brands struggles with profitability despite its broad diversification and improving ROIC trend. Investors should weigh IPAR’s steady value creation against NWL’s ongoing turnaround risks.
Risk Analysis
The table below summarizes key risk factors for Inter Parfums, Inc. (IPAR) and Newell Brands Inc. (NWL) based on the latest available data from 2024-2026.
| Metric | Inter Parfums, Inc. (IPAR) | Newell Brands Inc. (NWL) |
|---|---|---|
| Market Risk | Beta 1.24 (moderate volatility) | Beta 0.89 (lower volatility) |
| Debt level | Low debt/equity 0.26 (favorable) | High debt/equity 1.86 (unfavorable) |
| Regulatory Risk | Moderate, typical for consumer products sector | Moderate, with complexity due to diverse product lines |
| Operational Risk | Low, efficient asset turnover (8.14) | Higher, weaker margins and operational challenges |
| Environmental Risk | Low to moderate, standard industry exposure | Moderate, broad product range increases exposure |
| Geopolitical Risk | Moderate, with international sales exposure | Moderate, global supply chain dependencies |
Inter Parfums shows the strongest financial health with low leverage, solid profitability, and manageable operational risks. Newell Brands faces higher financial risk due to its elevated debt, negative margins, and weak interest coverage, increasing the likelihood of distress despite a favorable dividend yield. Market volatility is moderate for both, with Inter Parfums more sensitive to market swings.
Which Stock to Choose?
Inter Parfums, Inc. (IPAR) shows a favorable income evolution with 10.22% revenue growth in 2024 and strong profitability metrics, including an 11.32% net margin and 22.07% ROE. Its financial ratios are very favorable, highlighting low debt levels (debt-to-equity 0.26) and solid liquidity (current ratio 2.75). The company’s rating is very favorable (B+), supported by a robust Altman Z-Score of 6.12 and a durable moat with ROIC exceeding WACC by 9.44%.
Newell Brands Inc. (NWL) presents a mixed income profile with a negative 2.85% net margin and unfavorable ROE of -7.85%, despite a slight improvement in EBIT margin. Financial ratios are slightly unfavorable overall, reflecting high debt (debt-to-equity 1.86) and weak interest coverage (0.12). The rating stands at C+ with the company in financial distress per an Altman Z-Score of 0.51, and a moat evaluation indicating value destruction, though profitability shows signs of recovery.
Considering ratings and financial evaluations, IPAR’s strong profitability, low leverage, and durable competitive advantage might appeal to investors prioritizing quality and stability. NWL’s improving profitability but high financial risk and weaker rating could be more relevant for risk-tolerant investors focused on potential turnaround opportunities. The choice could thus depend on the investor’s risk appetite and investment strategy.
Disclaimer: Investment carries a risk of loss of initial capital. The past performance is not a reliable indicator of future results. Be sure to understand risks before making an investment decision.
Go Further
I encourage you to read the complete analyses of Inter Parfums, Inc. and Newell Brands Inc. to enhance your investment decisions: