Home > Comparison > Technology > INTC vs TSEM
The strategic rivalry between Intel Corporation and Tower Semiconductor Ltd. shapes the semiconductor industry’s evolution. Intel operates as a capital-intensive giant with a broad technology portfolio spanning CPUs to autonomous driving platforms. In contrast, Tower Semiconductor specializes as a nimble, analog-focused foundry serving diverse end markets. This analysis pits scale and integration against specialization to identify which trajectory delivers superior risk-adjusted returns for a diversified portfolio.
Table of contents
Companies Overview
Intel Corporation and Tower Semiconductor Ltd. shape critical segments of the global semiconductor industry.
Intel Corporation: Semiconductor Giant with Diverse Technology Platforms
Intel dominates as a leading semiconductor designer and manufacturer. Its core revenue stems from CPUs, chipsets, and advanced compute solutions across data centers and autonomous driving. In 2026, Intel focuses on expanding AI-driven platforms and embedded systems to secure leadership in high-performance and vertical markets.
Tower Semiconductor Ltd.: Specialist Foundry for Analog and Mixed-Signal Chips
Tower Semiconductor excels as an independent foundry, specializing in analog-intensive mixed-signal semiconductors. It generates revenue by offering customizable wafer fabrication and design services to diverse industries from automotive to aerospace. The 2026 strategy emphasizes enhancing process technologies like SiGe and RF CMOS to support fabless and IDM customers globally.
Strategic Collision: Similarities & Divergences
Intel embraces a vertically integrated model, while Tower pursues an open foundry approach. Their competition centers on advanced semiconductor technology and market share among OEMs and fabless firms. Intel’s scale offers broad diversification; Tower’s niche focus provides agility—distinct investment profiles reflecting their contrasting business philosophies.
Income Statement Comparison
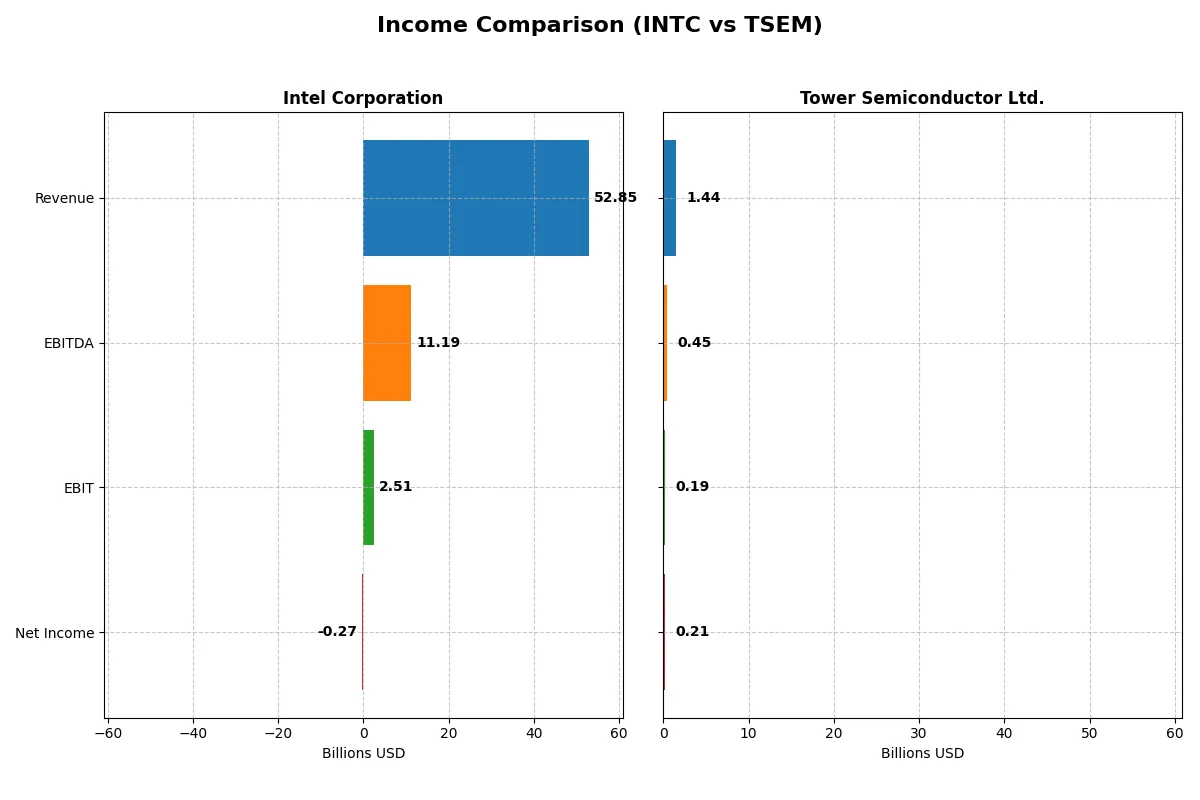
This data dissects the core profitability and scalability of both corporate engines to reveal who dominates the bottom line:
| Metric | Intel Corporation (INTC) | Tower Semiconductor Ltd. (TSEM) |
|---|---|---|
| Revenue | 52.9B | 1.44B |
| Cost of Revenue | 34.4B | 1.10B |
| Operating Expenses | 20.6B | 148M |
| Gross Profit | 18.5B | 339M |
| EBITDA | 11.2B | 451M |
| EBIT | 2.5B | 185M |
| Interest Expense | 953M | 5.9M |
| Net Income | -267M | 208M |
| EPS | -0.08 | 1.87 |
| Fiscal Year | 2025 | 2024 |
Income Statement Analysis: The Bottom-Line Duel
This income statement comparison uncovers which company runs a more efficient and profitable business engine amid recent market challenges.
Intel Corporation Analysis
Intel’s revenue slipped slightly to $52.9B in 2025, down from $53.1B in 2024, but gross profit rose 6.5% to $18.5B, improving gross margin to 34.96%. Yet, net income turned negative at -$267M, reflecting margin pressure and a weak net margin of -0.51%. Operating income remains under strain despite a rebound in EBIT.
Tower Semiconductor Ltd. Analysis
Tower Semiconductor grew revenue modestly by 0.9% to $1.44B in 2024 but saw a 4% drop in gross profit to $339M, compressing gross margin to 23.64%. EBIT and net income both declined sharply, with net income falling 60% to $208M. Despite this, Tower maintains a solid net margin of 14.47%, signaling better bottom-line efficiency.
Margin Resilience vs. Scale Struggles
Intel’s scale dwarfs Tower’s, but it struggles to convert revenue into profit, posting a negative net margin in 2025. Tower delivers stronger profitability ratios and healthier margins despite its smaller size. For investors, Tower’s efficient margin profile offers a more attractive risk-reward balance compared to Intel’s ongoing profitability challenges.
Financial Ratios Comparison
These vital ratios act as a diagnostic tool to expose the underlying fiscal health, valuation premiums, and capital efficiency of the companies compared below:
| Ratios | Intel Corporation (INTC) | Tower Semiconductor Ltd. (TSEM) |
|---|---|---|
| ROE | -0.23% | 7.83% |
| ROIC | -0.02% | 6.41% |
| P/E | -658.4 | 27.54 |
| P/B | 1.54 | 2.16 |
| Current Ratio | 2.02 | 6.18 |
| Quick Ratio | 1.65 | 5.23 |
| D/E | 0.41 | 0.07 |
| Debt-to-Assets | 22.0% | 5.87% |
| Interest Coverage | -2.23 | 32.64 |
| Asset Turnover | 0.25 | 0.47 |
| Fixed Asset Turnover | 0.50 | 1.11 |
| Payout ratio | 0 | 0 |
| Dividend yield | 0 | 0 |
| Fiscal Year | 2025 | 2024 |
Efficiency & Valuation Duel: The Vital Signs
Ratios act as a company’s DNA, revealing hidden risks and operational excellence crucial for investment decisions.
Intel Corporation
Intel suffers from negative profitability metrics: a -0.23% ROE and -0.51% net margin indicate weak core earnings. The P/E ratio is deeply negative, signaling losses but a low valuation multiple. Intel maintains a strong current ratio of 2.02 and low leverage, yet it pays no dividend, focusing capital on R&D, spending 26% of revenue to fuel growth.
Tower Semiconductor Ltd.
Tower Semiconductor posts a healthier 7.83% ROE and a favorable 14.47% net margin, reflecting operational efficiency. It trades at a higher P/E of 27.54, suggesting a stretched valuation relative to earnings. Tower retains a robust balance sheet with minimal debt and a high quick ratio. The company does not pay dividends, reinvesting cash into modest R&D for steady expansion.
Balanced Efficiency vs. Stretched Valuation
Tower Semiconductor offers stronger profitability and a more favorable overall ratio profile, despite a higher valuation multiple. Intel, meanwhile, shows financial strain but invests heavily in innovation. Investors seeking operational safety may prefer Tower; those betting on a turnaround might consider Intel’s growth focus.
Which one offers the Superior Shareholder Reward?
Intel Corporation (INTC) pays a modest dividend yield of 1.84% in 2024 but shows negative free cash flow per share (-1.02) and no buybacks, signaling distribution strain. Tower Semiconductor Ltd. (TSEM) offers zero dividends but sustains free cash flow with a slight positive 0.11 per share and runs steady buybacks. I favor TSEM’s reinvestment and buyback strategy as more sustainable for long-term value. Intel’s dividend yield lacks free cash flow coverage, risking cuts. Tower’s capital allocation prioritizes growth and capital returns, providing a superior total shareholder reward in 2026.
Comparative Score Analysis: The Strategic Profile
The radar chart reveals the fundamental DNA and trade-offs of Intel Corporation and Tower Semiconductor Ltd., highlighting core financial strengths and weaknesses:
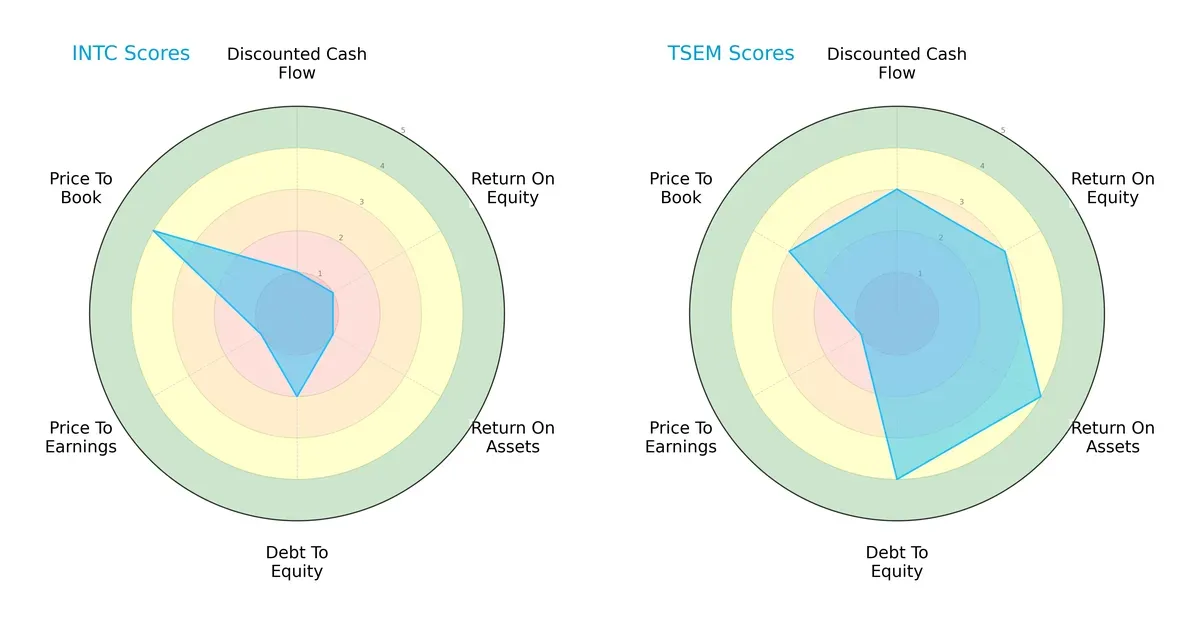
Tower Semiconductor delivers a more balanced financial profile with solid DCF, ROE, ROA, and superior debt-to-equity scores. Intel relies heavily on a favorable price-to-book valuation but struggles with weak profitability and cash flow metrics. Tower’s diversified strengths suggest more sustainable operational efficiency, while Intel’s edge hinges on valuation appeal amid underlying financial challenges.
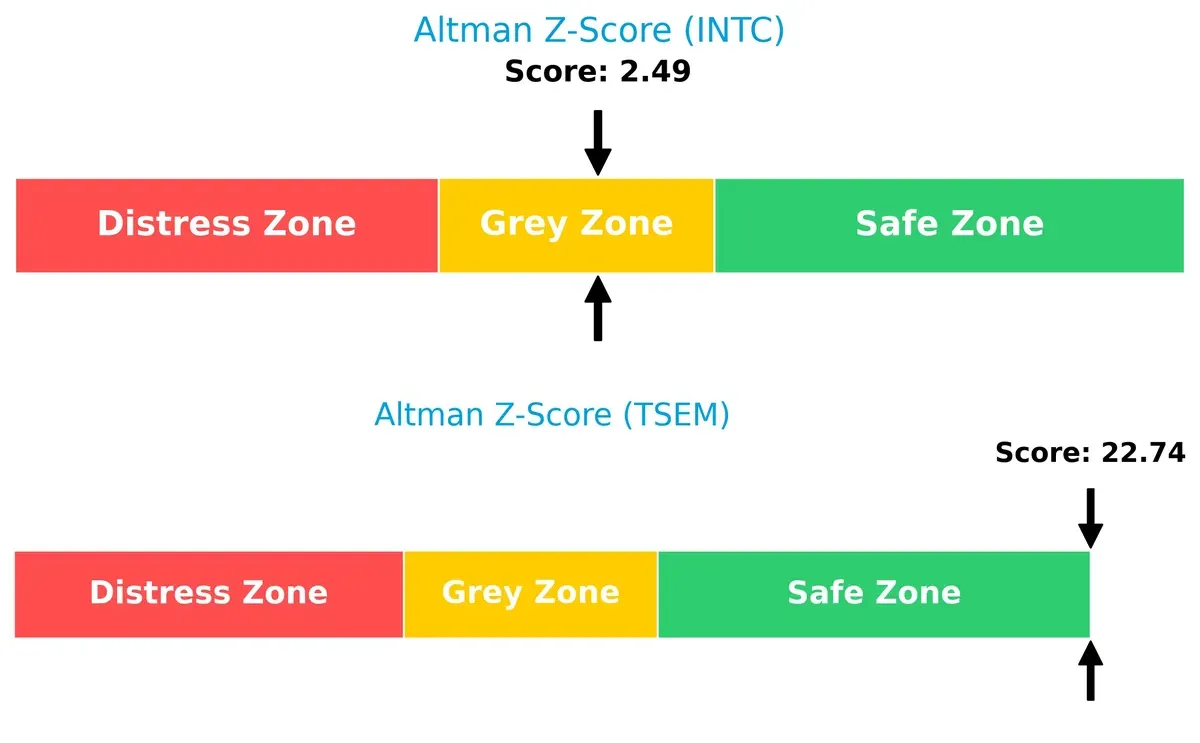
Bankruptcy Risk: Solvency Showdown
Tower Semiconductor’s Altman Z-Score of 22.7 places it safely above distress, signaling robust long-term survival. Intel’s score of 2.49 falls in the grey zone, indicating moderate bankruptcy risk in this cycle:
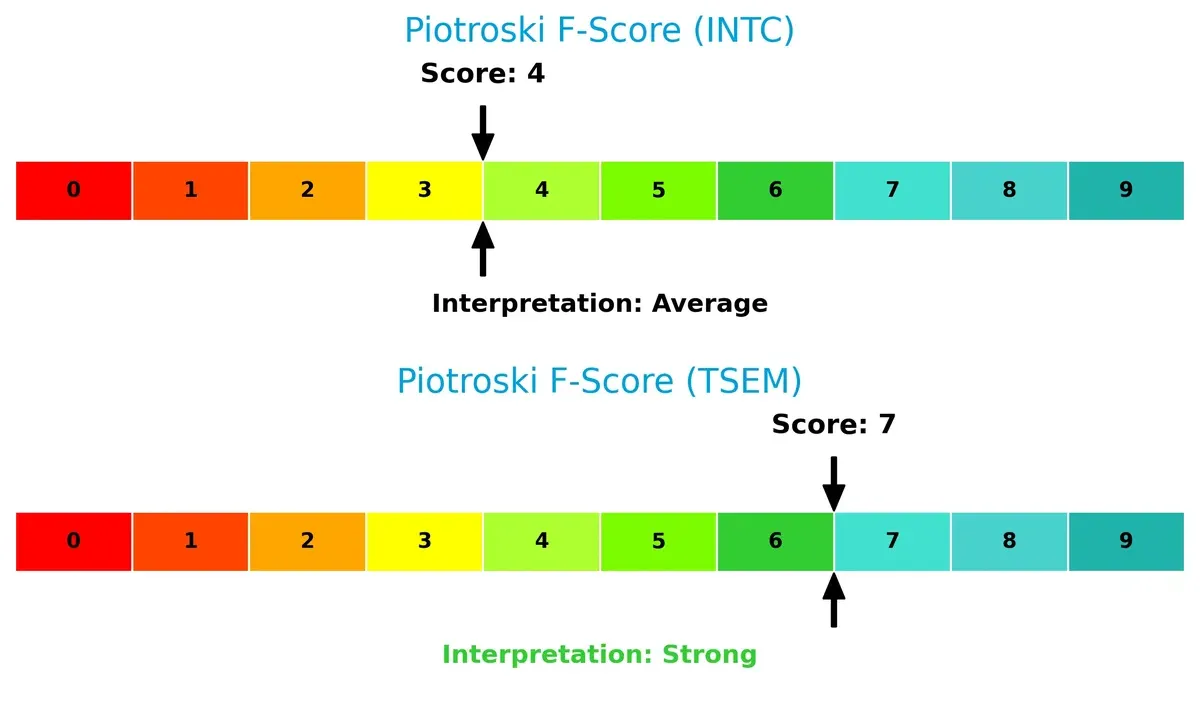
Financial Health: Quality of Operations
Tower Semiconductor outshines Intel with a Piotroski F-Score of 7, reflecting strong internal financial health. Intel’s score of 4 flags concerns about operational efficiency and earnings quality:
How are the two companies positioned?
This section dissects the operational DNA of Intel and Tower Semiconductor by comparing their revenue distribution and internal strengths and weaknesses. The final objective confronts their economic moats to identify which model offers the most resilient competitive advantage in today’s market.
Revenue Segmentation: The Strategic Mix
The following visual comparison dissects how both firms diversify their income streams and where their primary sector bets lie:
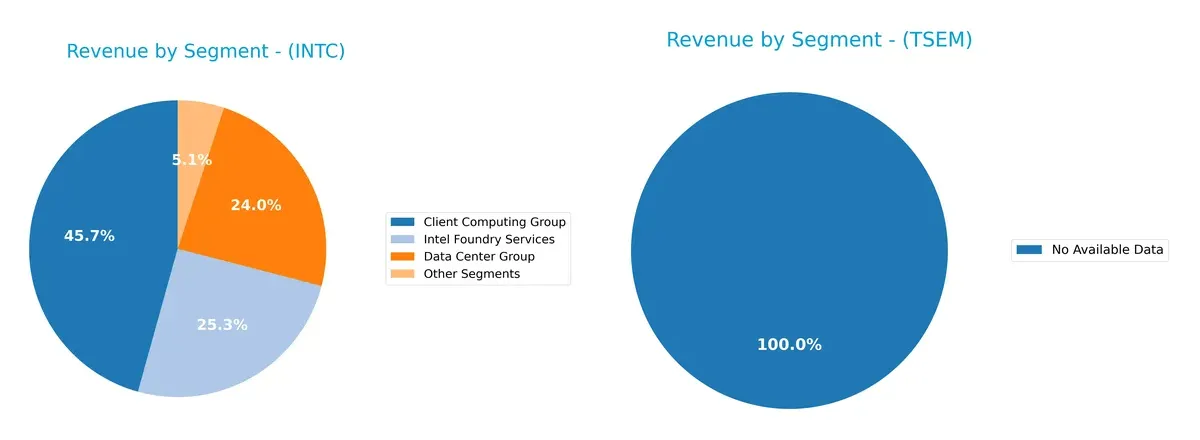
Intel Corporation displays a well-balanced revenue mix between its Client Computing Group ($32.2B) and Intel Foundry Services ($17.8B), with a strong Data Center Group ($16.9B) anchoring growth. Tower Semiconductor Ltd. shows no available data, making Intel’s diversified ecosystem dominance clear. Intel’s broad segment exposure reduces concentration risk and supports infrastructure leadership, leveraging its integrated product and service base for competitive moat expansion.
Strengths and Weaknesses Comparison
This table compares the Strengths and Weaknesses of Intel Corporation and Tower Semiconductor Ltd.:
Intel Strengths
- Diversified revenue streams across multiple segments
- Established global presence including US, Singapore, Taiwan
- Strong current and quick ratios signal solid liquidity
- Moderate debt levels with favorable debt-to-asset ratio
Tower Semiconductor Strengths
- Favorable net margin indicating profitability
- Low debt levels with strong interest coverage
- Quick ratio signals good short-term liquidity
- Slightly favorable WACC supports capital efficiency
Intel Weaknesses
- Negative net margin, ROE, and ROIC reflect profitability challenges
- Unfavorable asset turnover ratios indicate efficiency issues
- Zero dividend yield may deter income investors
Tower Semiconductor Weaknesses
- High current ratio may indicate inefficient asset use
- Unfavorable PE ratio suggests expensive valuation
- Unfavorable asset turnover limits operational efficiency
- Zero dividend yield limits income appeal
Intel shows broad diversification and strong liquidity but struggles with profitability and efficiency. Tower Semiconductor demonstrates solid profitability and capital structure but faces valuation and operational efficiency concerns. Both firms must balance these factors in their strategic planning.
The Moat Duel: Analyzing Competitive Defensibility
Structural moats shield long-term profits from relentless competitive pressures. Without them, market share and margins erode quickly. Let’s dissect the moats of two semiconductor players:
Intel Corporation: Scale and Brand Intangible Assets
Intel leverages its vast scale and deep brand recognition as its moat. Historically, this delivers above-average gross margins near 35%. However, its declining ROIC signals profitability challenges. New AI and autonomous driving products offer growth, but competition tightens the margin of safety in 2026.
Tower Semiconductor Ltd.: Niche Process Technology and Customer Customization
Tower’s moat rests on specialized analog and mixed-signal manufacturing, contrasting Intel’s broad platform approach. It maintains superior EBIT margins above 12% and shows improving ROIC trends despite current value destruction. Expansion in automotive and medical chips could deepen its moat as Intel faces more commoditization.
Verdict: Scale Intangibles vs. Specialized Process Expertise
Intel’s moat is wider due to sheer scale and brand power but is weakening with declining ROIC. Tower’s moat is narrower but deepens with rising profitability and focused innovation. I see Tower better equipped to defend and grow its niche market share amid semiconductor industry shifts.
Which stock offers better returns?
The past year highlights significant price gains and accelerating momentum for both Intel Corporation and Tower Semiconductor Ltd., with TSEM exhibiting a markedly stronger ascent.
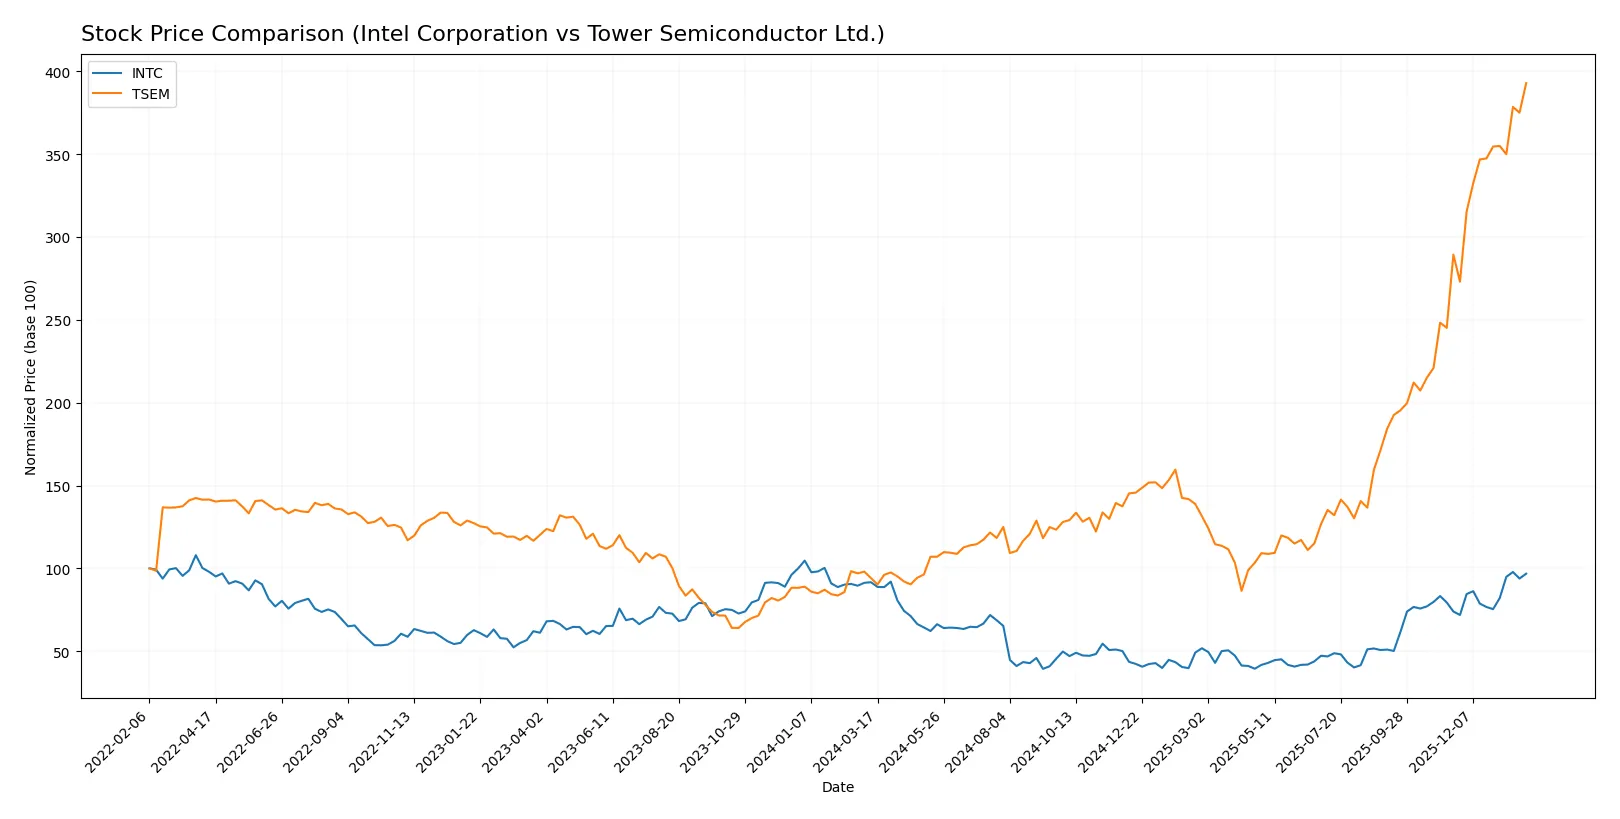
Trend Comparison
Intel Corporation’s stock rose 5.61% over the past 12 months, showing a bullish trend with accelerating momentum and a moderate volatility of 8.11%. The price ranged from $18.89 to $46.96.
Tower Semiconductor Ltd. surged 316.99% over the same period, also bullish with acceleration but higher volatility at 26.18%. Its price moved between $29.65 and $134.73, confirming a robust upward trajectory.
Tower Semiconductor delivered substantially higher market performance than Intel, with triple-digit gains overshadowing Intel’s single-digit increase on a 12-month basis.
Target Prices
Analyst consensus reveals a broad range of expectations for Intel Corporation and Tower Semiconductor Ltd.
| Company | Target Low | Target High | Consensus |
|---|---|---|---|
| Intel Corporation | 20 | 66 | 46.95 |
| Tower Semiconductor Ltd. | 66 | 125 | 96 |
Intel’s consensus target aligns closely with its current price of 46.47, suggesting limited upside. Tower Semiconductor’s target consensus at 96 contrasts sharply with its current 134.73 price, indicating potential overvaluation.

Don’t Let Luck Decide Your Entry Point
Optimize your entry points with our advanced ProRealTime indicators. You’ll get efficient buy signals with precise price targets for maximum performance. Start outperforming now!
How do institutions grade them?
The following tables summarize the recent grades assigned to Intel Corporation and Tower Semiconductor Ltd. by notable grading firms:
Intel Corporation Grades
This table shows Intel Corporation’s latest grades from major financial institutions.
| Grading Company | Action | New Grade | Date |
|---|---|---|---|
| RBC Capital | maintain | Sector Perform | 2026-01-23 |
| Keybanc | maintain | Overweight | 2026-01-23 |
| Evercore ISI Group | maintain | In Line | 2026-01-23 |
| Needham | maintain | Hold | 2026-01-23 |
| Benchmark | maintain | Buy | 2026-01-23 |
| Rosenblatt | maintain | Sell | 2026-01-23 |
| UBS | maintain | Neutral | 2026-01-23 |
| Citigroup | maintain | Neutral | 2026-01-23 |
| Stifel | maintain | Hold | 2026-01-23 |
| Wedbush | maintain | Neutral | 2026-01-23 |
Tower Semiconductor Ltd. Grades
This table lists Tower Semiconductor Ltd.’s recent grades from established rating agencies.
| Grading Company | Action | New Grade | Date |
|---|---|---|---|
| Benchmark | maintain | Buy | 2026-01-09 |
| Wedbush | downgrade | Neutral | 2025-12-31 |
| Benchmark | maintain | Buy | 2025-11-11 |
| Susquehanna | maintain | Positive | 2025-11-11 |
| Wedbush | maintain | Outperform | 2025-11-11 |
| Barclays | maintain | Equal Weight | 2025-11-11 |
| Benchmark | maintain | Buy | 2025-09-08 |
| Susquehanna | maintain | Positive | 2025-08-05 |
| Benchmark | maintain | Buy | 2025-08-05 |
| Benchmark | maintain | Buy | 2025-08-04 |
Which company has the best grades?
Tower Semiconductor consistently receives strong buy and positive ratings from multiple firms, indicating bullish sentiment. Intel’s grades are more mixed, spanning buy to sell, reflecting varied analyst views. Investors may interpret Tower’s grades as greater confidence in near-term performance.
Risks specific to each company
The following categories identify the critical pressure points and systemic threats facing both firms in the 2026 market environment:
1. Market & Competition
Intel Corporation
- Faces fierce competition from larger integrated device manufacturers and foundries, pressuring margins and innovation pace.
Tower Semiconductor Ltd.
- Competes in niche analog and mixed-signal foundry markets but is exposed to shifting customer demands and technology cycles.
2. Capital Structure & Debt
Intel Corporation
- Maintains moderate leverage (D/E 0.41) with manageable interest coverage, yet negative ROIC signals inefficient capital use.
Tower Semiconductor Ltd.
- Low leverage (D/E 0.07) and strong interest coverage (31.57) underpin solid financial stability and conservative capital structure.
3. Stock Volatility
Intel Corporation
- Beta of 1.354 indicates higher sensitivity to market swings, reflecting cyclical semiconductor industry risks.
Tower Semiconductor Ltd.
- Beta of 0.876 shows lower volatility, suggesting stronger defensive characteristics amid sector turbulence.
4. Regulatory & Legal
Intel Corporation
- US-based with exposure to stringent domestic and international tech regulations and potential antitrust scrutiny.
Tower Semiconductor Ltd.
- Israeli headquarters face complex geopolitical regulatory environments but benefit from supportive tech export policies.
5. Supply Chain & Operations
Intel Corporation
- Large-scale global operations face ongoing supply chain disruptions and capital-intensive manufacturing challenges.
Tower Semiconductor Ltd.
- Smaller scale with diversified technology offerings but vulnerable to supplier concentration and capacity constraints.
6. ESG & Climate Transition
Intel Corporation
- Invests heavily in sustainability initiatives; however, high energy consumption in fabs remains a climate risk.
Tower Semiconductor Ltd.
- Emerging ESG programs with lower operational footprint but increasing pressure to meet global climate standards.
7. Geopolitical Exposure
Intel Corporation
- US-China trade tensions and export controls pose material risks to global sales and supply chains.
Tower Semiconductor Ltd.
- Geographic location in Israel exposes it to regional geopolitical instability affecting production and sales.
Which company shows a better risk-adjusted profile?
Intel’s largest risk lies in its negative profitability and capital inefficiency amid intense global competition. Tower Semiconductor’s primary risk is geopolitical uncertainty in its operating region. Despite Intel’s scale, Tower’s lower leverage, higher Altman Z-score in the safe zone, and stronger Piotroski score reflect a better risk-adjusted profile. Tower’s conservative capital structure and lower stock volatility provide a more resilient foundation in today’s semiconductor market.
Final Verdict: Which stock to choose?
Intel Corporation’s superpower lies in its vast scale and established market presence, offering a foundation of resilience. However, its declining profitability and value destruction raise a point of vigilance. Intel fits portfolios targeting deep value turnaround with a tolerance for operational challenges.
Tower Semiconductor’s strategic moat is its nimble operational model and improving profitability amid growth, supported by strong liquidity and financial health. Compared to Intel, it presents a safer profile with more favorable capital efficiency. Tower suits investors seeking Growth at a Reasonable Price (GARP) exposure in the semiconductor space.
If you prioritize scale and potential turnaround plays, Intel offers a compelling scenario due to its industry footprint despite current value erosion. However, if you seek improving profitability and financial stability with growth momentum, Tower Semiconductor outshines with better operational trends and lower financial risk. Both stocks demand caution, but their profiles cater to distinct investor avatars.
Disclaimer: Investment carries a risk of loss of initial capital. The past performance is not a reliable indicator of future results. Be sure to understand risks before making an investment decision.
Go Further
I encourage you to read the complete analyses of Intel Corporation and Tower Semiconductor Ltd. to enhance your investment decisions: