Home > Comparison > Technology > INTC vs TXN
The strategic rivalry between Intel Corporation and Texas Instruments Incorporated shapes the semiconductor industry’s evolution. Intel operates as a capital-intensive leader in microprocessors and high-performance computing platforms. In contrast, Texas Instruments excels as a high-margin analog and embedded processing specialist. This analysis probes their contrasting operational models and growth drivers to identify which trajectory offers superior risk-adjusted returns for a diversified technology portfolio in 2026.
Table of contents
Companies Overview
Intel Corporation and Texas Instruments Incorporated are pivotal players shaping the semiconductor industry landscape.
Intel Corporation: Semiconductors Powerhouse
Intel Corporation dominates as a leading semiconductor manufacturer specializing in central processing units and platform products. Its core revenue stems from designing and selling computer chips for a wide range of devices, including cloud and enterprise solutions. In 2026, Intel sharpens its focus on AI-driven compute platforms and autonomous driving technologies, leveraging strategic partnerships to enhance innovation.
Texas Instruments Incorporated: Analog & Embedded Innovator
Texas Instruments Incorporated excels as a key supplier of analog and embedded processing semiconductors, generating revenue through power management and signal chain products. Its Analog and Embedded Processing segments serve diverse markets such as industrial and automotive. The company prioritizes expanding its analog portfolio and embedded microcontrollers to strengthen its position in power-efficient and precision applications.
Strategic Collision: Similarities & Divergences
Both companies thrive in semiconductors but diverge strategically. Intel pursues a broad, platform-based ecosystem emphasizing high-performance computing and AI, while Texas Instruments adopts a specialized focus on analog and embedded solutions. Their primary battleground is in industrial and automotive markets, where power efficiency and integration matter most. These differences shape distinct investment profiles—Intel offers scale and innovation breadth, Texas Instruments delivers niche expertise and stable cash flow.
Income Statement Comparison
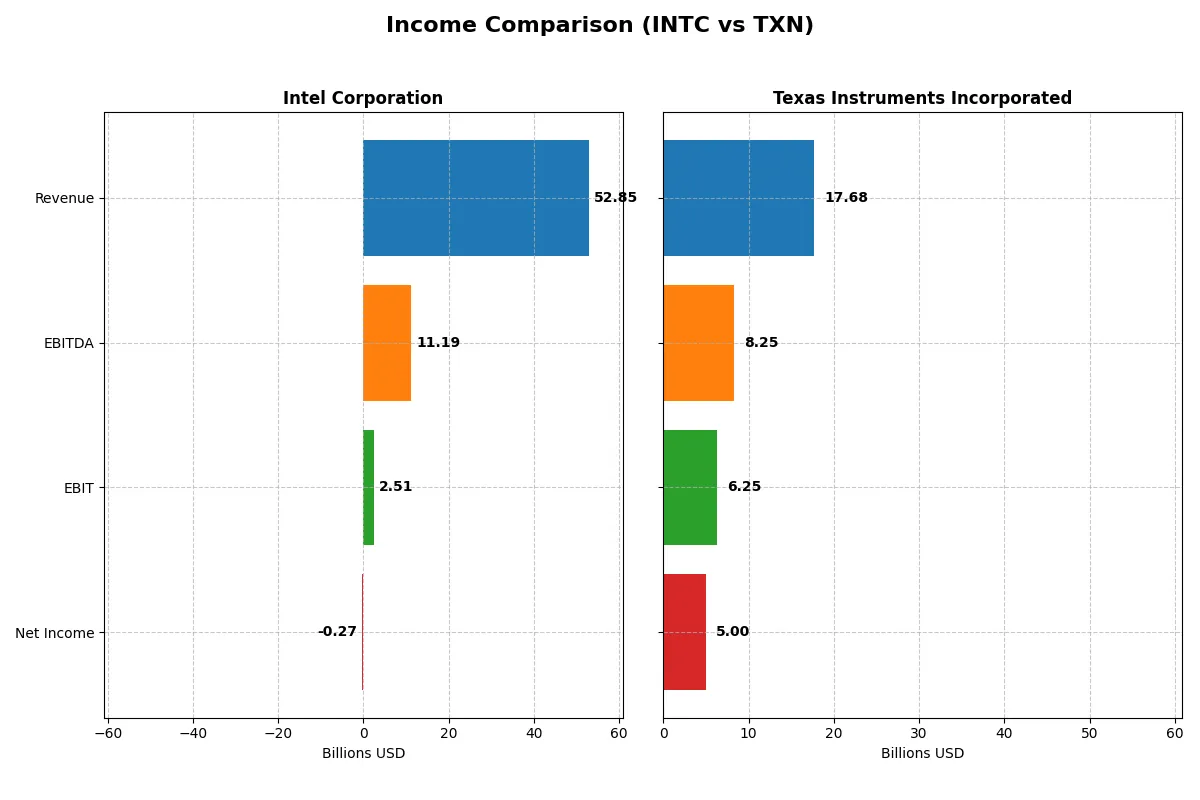
This data dissects the core profitability and scalability of both corporate engines to reveal who dominates the bottom line:
| Metric | Intel Corporation (INTC) | Texas Instruments Incorporated (TXN) |
|---|---|---|
| Revenue | 52.9B | 17.7B |
| Cost of Revenue | 34.4B | 7.6B |
| Operating Expenses | 20.6B | 4.1B |
| Gross Profit | 18.5B | 10.1B |
| EBITDA | 11.2B | 8.3B |
| EBIT | 2.5B | 6.3B |
| Interest Expense | 953M | 543M |
| Net Income | -267M | 5.0B |
| EPS | -0.08 | 5.45 |
| Fiscal Year | 2025 | 2025 |
Income Statement Analysis: The Bottom-Line Duel
This income statement comparison reveals the true efficiency of Intel and Texas Instruments’ corporate engines over recent years.
Intel Corporation Analysis
Intel’s revenue declined from 79B in 2021 to 53B in 2025, while net income swung from a strong 19.9B profit in 2021 to a 267M loss in 2025. Gross margin contracts but remains decent at 35%, yet net margin turned negative, signaling margin pressure. The latest year shows a fragile recovery in operating profit but a nearly flat bottom line, reflecting ongoing efficiency challenges.
Texas Instruments Incorporated Analysis
Texas Instruments grew revenue from 18.3B in 2021 to 17.7B in 2025, with recent growth after a dip. Gross margin stands robust at 57%, and net margin impresses at 28%, underscoring excellent cost control. The 2025 year shows solid operating income at 6.0B and consistent net income near 5B, demonstrating steady profitability and efficient expense management.
Margin Strength vs. Revenue Scale
Texas Instruments clearly outperforms Intel on profitability, boasting superior gross and net margins with steady income growth. Intel’s scale is larger but accompanied by shrinking revenue and losses in recent years. For investors prioritizing margin resilience and bottom-line stability, Texas Instruments presents the more attractive earnings profile.
Financial Ratios Comparison
These vital ratios act as a diagnostic tool to expose the underlying fiscal health, valuation premiums, and capital efficiency of the companies compared below:
| Ratios | Intel Corporation (INTC) | Texas Instruments (TXN) |
|---|---|---|
| ROE | -0.23% | 30.73% |
| ROIC | -0.02% | 16.52% |
| P/E | -658.38 | 31.53 |
| P/B | 1.54 | 9.69 |
| Current Ratio | 2.02 | 4.35 |
| Quick Ratio | 1.65 | 2.83 |
| D/E | 0.41 | 0.86 |
| Debt-to-Assets | 22.03% | 40.62% |
| Interest Coverage | -2.23 | 11.09 |
| Asset Turnover | 0.25 | 0.51 |
| Fixed Asset Turnover | 0.50 | 1.44 |
| Payout ratio | 0 | 99.96% |
| Dividend yield | 0% | 3.17% |
| Fiscal Year | 2025 | 2025 |
Efficiency & Valuation Duel: The Vital Signs
Financial ratios serve as the company’s DNA, revealing hidden risks and operational excellence that raw numbers alone cannot expose.
Intel Corporation
Intel posts negative returns on equity and invested capital, signaling profitability struggles. Its valuation appears stretched in P/E terms yet reasonably priced on P/B. The firm lacks dividends, instead reinvesting heavily in R&D, which accounts for over 26% of revenue, aiming to fuel future growth despite current inefficiencies.
Texas Instruments Incorporated
Texas Instruments commands robust profitability with a 30.7% ROE and solid net margins above 28%. Its stock trades at a high P/E and P/B, reflecting premium valuation. The company returns cash to shareholders via a 3.17% dividend yield, balancing capital allocation between rewarding investors and sustaining operational strength.
Premium Valuation vs. Operational Safety
Texas Instruments offers superior profitability and a balanced approach to shareholder returns despite a premium price. Intel’s lower valuation masks operational headwinds and reinvestment risks. Investors seeking stable returns and operational efficiency may favor Texas Instruments’ profile, while those betting on turnaround potential face Intel’s challenges.
Which one offers the Superior Shareholder Reward?
I compare Intel Corporation (INTC) and Texas Instruments Incorporated (TXN) on distribution strategies and shareholder returns. INTC pays no dividend in 2025 and shows negative free cash flow (-1B), signaling no dividend yield or payout. Its buyback program is weak due to cash constraints. TXN yields 3.17%, with a near 100% payout ratio, supported by robust free cash flow (2.9B) and strong operating margins. TXN also sustains aggressive buybacks, fueling total shareholder return. I see TXN’s distribution model as more sustainable and rewarding in 2026, driven by consistent cash flow and disciplined capital allocation. Hence, TXN offers the superior total return profile this year.
Comparative Score Analysis: The Strategic Profile
The radar chart reveals the fundamental DNA and trade-offs of Intel Corporation and Texas Instruments Incorporated, highlighting their core financial strengths and weaknesses:

Texas Instruments displays a more balanced profile with strong DCF (3), ROE (5), and ROA (5) scores, indicating efficient capital allocation and profitability. Intel relies heavily on a favorable Price-to-Book score (4) but suffers across DCF (1), ROE (1), and ROA (1), signaling weaker operational efficiency and valuation challenges. Intel’s moderate Debt-to-Equity (2) contrasts with Texas Instruments’ high leverage risk (1), underscoring differing capital structures.
Bankruptcy Risk: Solvency Showdown
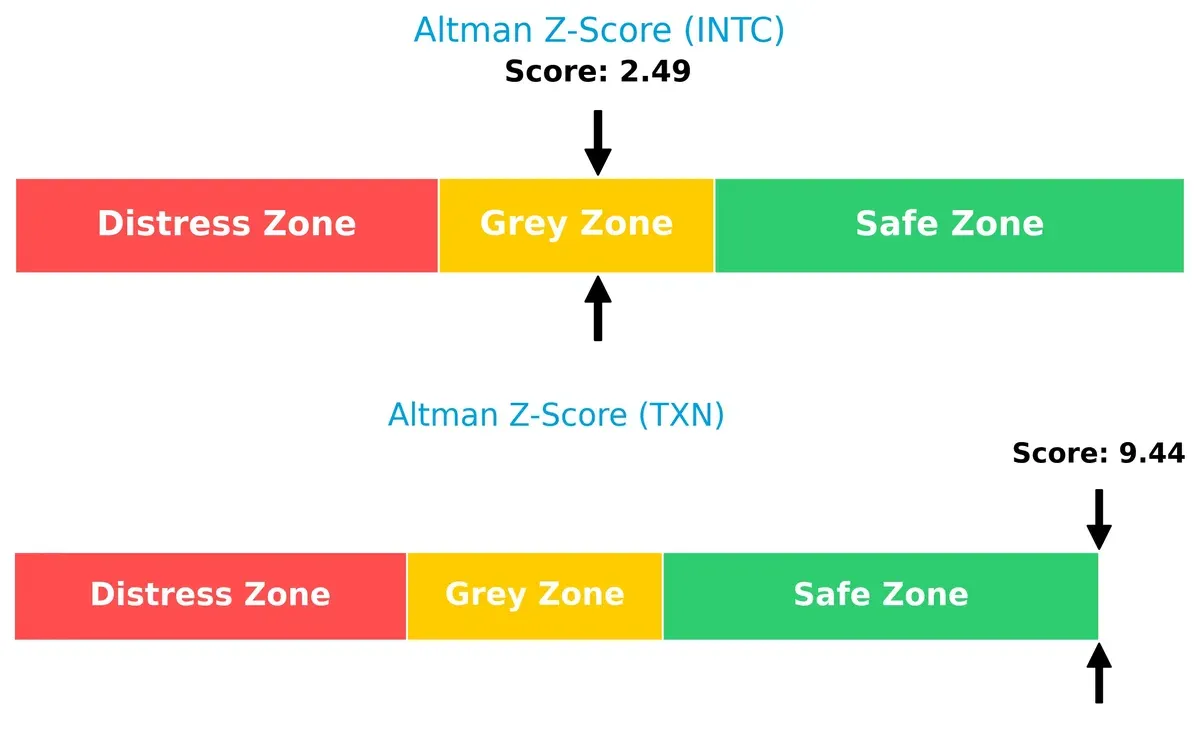
Texas Instruments’ Altman Z-Score of 9.44 places it firmly in the safe zone, while Intel’s 2.49 situates it in the grey zone, implying moderate bankruptcy risk in this economic cycle:
Financial Health: Quality of Operations
Texas Instruments scores a robust 7 on the Piotroski F-Score, reflecting strong financial health and operational efficiency. Intel’s score of 4 signals average financial strength, raising red flags about internal metrics and cash flow quality:

How are the two companies positioned?
This section dissects Intel and Texas Instruments’ operational DNA by comparing revenue distribution and internal dynamics. The goal is to confront their economic moats to reveal which model offers the most resilient, sustainable competitive advantage today.
Revenue Segmentation: The Strategic Mix
This comparison dissects how Intel Corporation and Texas Instruments diversify income streams and reveals their primary sector bets:
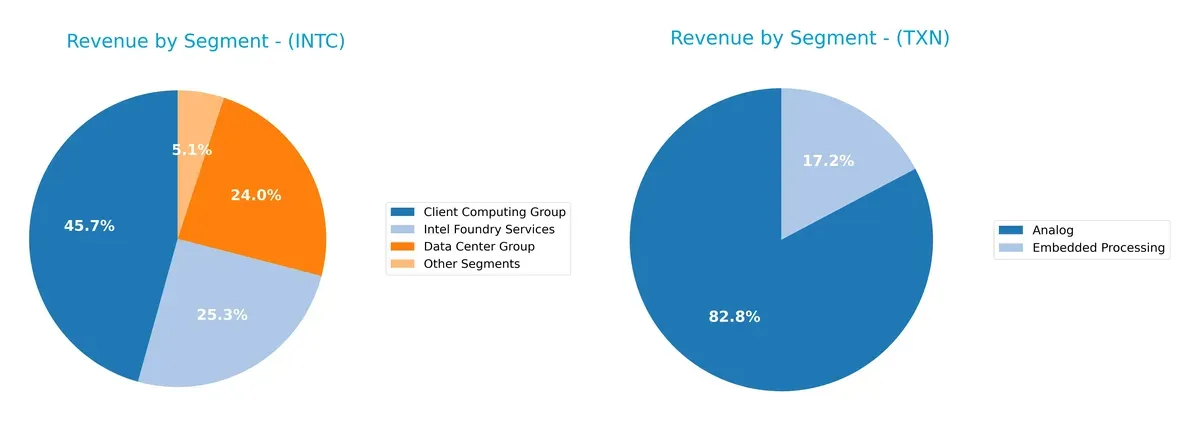
Intel’s revenue pivots around three main segments: Client Computing Group at $32.2B, Intel Foundry Services at $17.8B, and Data Center Group at $16.9B. Texas Instruments leans heavily on Analog at $12.2B, supported by Embedded Processing at $2.5B. Intel’s broader segment spread suggests ecosystem lock-in and infrastructure dominance, while Texas Instruments’ focus on Analog signals concentration risk but also specialization strength.
Strengths and Weaknesses Comparison
This table compares the strengths and weaknesses of Intel Corporation and Texas Instruments Incorporated based on diversification, profitability, financials, innovation, global presence, and market share:
Intel Corporation Strengths
- Diverse revenue streams across multiple segments including Client Computing, Data Center, and Foundry Services
- Strong global presence with significant sales in the US and Asia
- Favorable liquidity ratios with current ratio at 2.02 and quick ratio at 1.65
Texas Instruments Strengths
- High profitability with net margin of 28.28% and ROE of 30.73%
- Favorable return on invested capital at 16.52%
- Solid interest coverage at 11.52 and dividend yield of 3.17%
- Diversified customer base across Analog and Embedded Processing segments
Intel Corporation Weaknesses
- Negative profitability ratios: net margin at -0.51% and ROE at -0.23%
- Unfavorable asset turnover ratios indicating lower operational efficiency
- Lack of dividend yield and slightly unfavorable market valuation multiples
- Slightly unfavorable overall financial ratios with 42.86% unfavorable
Texas Instruments Weaknesses
- High price-to-book ratio at 9.69 and price-to-earnings at 31.53, indicating expensive valuation
- Unfavorable current ratio at 4.35 despite favorable quick ratio
- Moderate debt levels with debt-to-assets at 40.62% and neutral debt/equity position
- Neutral asset turnover ratios suggest average efficiency
Intel shows broader business diversification and stable liquidity but suffers from negative profitability and asset efficiency. Texas Instruments excels in profitability and capital returns but faces valuation and liquidity ratio concerns. This contrast highlights differing strategic focuses and operational challenges for each company.
The Moat Duel: Analyzing Competitive Defensibility
A structural moat protects long-term profits from relentless competitive erosion. Without it, market share and margins quickly deteriorate:
Intel Corporation: Scale and Innovation Moat
Intel’s moat stems from its massive scale and deep R&D-driven innovation. Yet, its negative ROIC versus WACC signals value destruction. New AI and autonomous driving chips could revitalize this moat in 2026.
Texas Instruments Incorporated: Analog Niche Moat
Texas Instruments leverages a focused analog and embedded processing niche with strong margins and consistent value creation. Its moat is narrower but deeper, supported by stable pricing power and diversified end markets.
Verdict: Scale vs. Focused Niche Moat
Intel’s broad innovation moat faces profitability challenges, while Texas Instruments’ focused analog niche delivers superior ROIC and margin stability. TI is better equipped to defend its market share in 2026.
Which stock offers better returns?
The past year shows distinct upward trends for both stocks, with Texas Instruments gaining more sharply and Intel exhibiting steadier growth and buyer dominance.
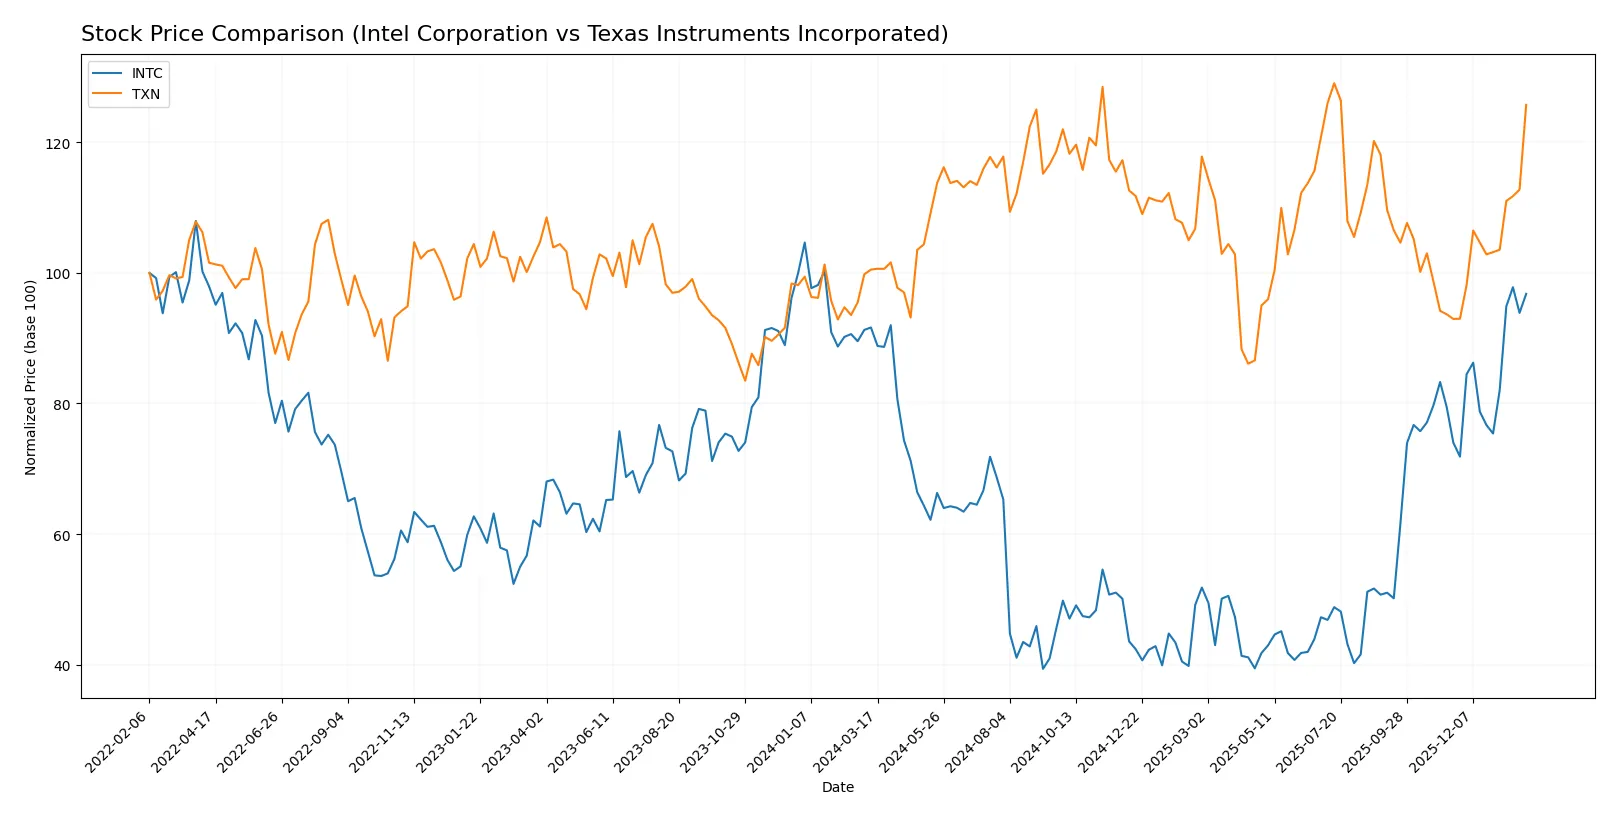
Trend Comparison
Intel’s stock rose 5.61% over the past 12 months, reflecting a bullish trend with accelerating momentum and moderate volatility (8.11 std dev). The price ranged between 18.89 and 46.96.
Texas Instruments outperformed with a 25.1% increase, also bullish with acceleration. Its volatility is higher (15.92 std dev), and the price fluctuated from 147.6 to 221.25.
Texas Instruments delivered stronger market performance over the year, gaining nearly five times Intel’s price appreciation amid higher volatility and acceleration.
Target Prices
Analysts present a clear consensus on Intel Corporation and Texas Instruments Incorporated targets.
| Company | Target Low | Target High | Consensus |
|---|---|---|---|
| Intel Corporation | 20 | 66 | 46.95 |
| Texas Instruments Inc. | 160 | 260 | 204.64 |
Intel’s consensus target of $46.95 closely matches its current price of $46.47, signaling a balanced outlook. Texas Instruments’ target consensus at $204.64 sits below its current $215.55, indicating some downside risk.

Don’t Let Luck Decide Your Entry Point
Optimize your entry points with our advanced ProRealTime indicators. You’ll get efficient buy signals with precise price targets for maximum performance. Start outperforming now!
How do institutions grade them?
Intel Corporation Grades
This table summarizes Intel’s recent institutional ratings and grade changes.
| Grading Company | Action | New Grade | Date |
|---|---|---|---|
| RBC Capital | Maintain | Sector Perform | 2026-01-23 |
| Keybanc | Maintain | Overweight | 2026-01-23 |
| Evercore ISI Group | Maintain | In Line | 2026-01-23 |
| Needham | Maintain | Hold | 2026-01-23 |
| Benchmark | Maintain | Buy | 2026-01-23 |
| Rosenblatt | Maintain | Sell | 2026-01-23 |
| UBS | Maintain | Neutral | 2026-01-23 |
| Citigroup | Maintain | Neutral | 2026-01-23 |
| Stifel | Maintain | Hold | 2026-01-23 |
| Wedbush | Maintain | Neutral | 2026-01-23 |
Texas Instruments Incorporated Grades
Below is a summary of Texas Instruments’ current institutional ratings and recent changes.
| Grading Company | Action | New Grade | Date |
|---|---|---|---|
| Mizuho | Maintain | Underperform | 2026-01-28 |
| Goldman Sachs | Maintain | Sell | 2026-01-28 |
| B of A Securities | Upgrade | Neutral | 2026-01-28 |
| Wells Fargo | Maintain | Equal Weight | 2026-01-28 |
| Benchmark | Maintain | Buy | 2026-01-28 |
| Rosenblatt | Maintain | Buy | 2026-01-28 |
| JP Morgan | Maintain | Overweight | 2026-01-28 |
| Deutsche Bank | Maintain | Hold | 2026-01-28 |
| Cantor Fitzgerald | Maintain | Neutral | 2026-01-28 |
| Truist Securities | Maintain | Hold | 2026-01-28 |
Which company has the best grades?
Intel holds a wider range of ratings, including multiple “Buy” and “Overweight” grades, while Texas Instruments faces notable sell-side skepticism despite some “Buy” support. Investors may weigh Intel’s more balanced outlook against Texas Instruments’ mixed ratings.
Risks specific to each company
The following categories identify the critical pressure points and systemic threats facing both firms in the 2026 market environment:
1. Market & Competition
Intel Corporation
- Faces fierce competition in high-performance compute and adjacent products, struggling with negative net margin and ROIC.
Texas Instruments Incorporated
- Strong analog and embedded processing market position with robust profitability and ROIC, but premium valuation risks.
2. Capital Structure & Debt
Intel Corporation
- Moderate debt level (D/E 0.41) with neutral interest coverage (2.63x), indicating manageable but cautious leverage.
Texas Instruments Incorporated
- Higher leverage (D/E 0.86) with strong interest coverage (11.52x), suggesting more debt but solid capacity to service it.
3. Stock Volatility
Intel Corporation
- Beta at 1.354 signals above-market volatility, raising risk during market downturns.
Texas Instruments Incorporated
- Beta near 0.988 indicates lower volatility, providing a steadier risk profile.
4. Regulatory & Legal
Intel Corporation
- Exposure to complex U.S. and global tech regulations; ongoing antitrust scrutiny remains a risk.
Texas Instruments Incorporated
- Faces regulatory challenges mainly in industrial and automotive sectors, generally less aggressive than Intel’s scope.
5. Supply Chain & Operations
Intel Corporation
- Large, complex supply chain with risks in advanced semiconductor manufacturing yield and capacity.
Texas Instruments Incorporated
- More focused analog and embedded production with less complexity, yielding operational resilience.
6. ESG & Climate Transition
Intel Corporation
- High energy use and emissions from manufacturing pose ESG risks; pushing sustainability but progress uneven.
Texas Instruments Incorporated
- ESG initiatives in power management products align well with climate goals; better perceived ESG momentum.
7. Geopolitical Exposure
Intel Corporation
- Significant exposure to China-U.S. tensions affecting supply and sales channels globally.
Texas Instruments Incorporated
- Also exposed to global trade risks but less dependent on contentious regions, lowering geopolitical risk.
Which company shows a better risk-adjusted profile?
Texas Instruments faces higher leverage but compensates with strong profitability, stable operations, and lower stock volatility. Intel struggles with negative profitability, higher market volatility, and complex geopolitical and regulatory pressures. TI’s Altman Z-Score in the safe zone (9.44) contrasts with Intel’s grey zone (2.49), underscoring TI’s superior financial stability. Intel’s negative ROIC and net margin are red flags signaling operational stress. Consequently, Texas Instruments offers a better risk-adjusted profile in 2026, benefiting from operational focus and stronger financial health despite some debt concerns.
Final Verdict: Which stock to choose?
Intel’s superpower lies in its resilience amid challenging cycles, showing signs of operational recovery and strong liquidity. However, its ongoing value destruction and weak profitability remain points of vigilance. It could suit portfolios aiming for turnaround potential and deep value plays.
Texas Instruments commands a durable moat with high returns on invested capital and a robust income profile. Its safety margin outshines Intel’s, supported by a solid balance sheet and consistent free cash flow. This stock fits well with investors favoring steady growth at a reasonable price.
If you prioritize deep value and contrarian opportunities, Intel might be compelling due to its improving operational metrics despite structural headwinds. However, if you seek stability and superior capital efficiency, Texas Instruments offers better resilience and consistent value creation, albeit at a premium valuation.
Disclaimer: Investment carries a risk of loss of initial capital. The past performance is not a reliable indicator of future results. Be sure to understand risks before making an investment decision.
Go Further
I encourage you to read the complete analyses of Intel Corporation and Texas Instruments Incorporated to enhance your investment decisions: