Home > Comparison > Technology > INTC vs TER
The strategic rivalry between Intel Corporation and Teradyne, Inc. shapes the semiconductor industry’s evolution. Intel, a capital-intensive semiconductor giant, focuses on chip design and manufacturing at scale. Teradyne, a specialized test equipment provider, excels in high-margin industrial automation and wireless testing solutions. This analysis contrasts their distinct operational models and competitive moats to determine which presents a superior risk-adjusted return for diversified portfolios amid sector volatility.
Table of contents
Companies Overview
Intel Corporation and Teradyne, Inc. both play pivotal roles in the semiconductor industry, shaping technology’s future through distinct approaches.
Intel Corporation: Semiconductor Giant and Innovator
Intel dominates as a leading semiconductor manufacturer, generating revenue primarily from central processing units and chipsets. Its strategic focus in 2026 emphasizes expanding high-performance compute solutions and advancing AI-driven platforms for diverse sectors like cloud, healthcare, and autonomous driving. This broad market reach underpins Intel’s competitive advantage in integrated chip technologies.
Teradyne, Inc.: Automated Test Equipment Specialist
Teradyne stands out as a top provider of automated test equipment, driving revenue through semiconductor, system, industrial automation, and wireless test segments. In 2026, it concentrates on enhancing its industrial automation robotics and expanding wireless test solutions for cutting-edge communication standards. This focus on specialized testing hardware aligns with fast-growing demand for semiconductor quality assurance.
Strategic Collision: Similarities & Divergences
Intel pursues a vertically integrated approach, blending chip design and manufacturing, while Teradyne specializes in testing and automation, supporting semiconductor production from outside. Their primary competition lies in the semiconductor supply chain, where Intel innovates chip products and Teradyne ensures their quality and reliability. Investors will find Intel offers scale and diversification, whereas Teradyne provides niche expertise and growth in automation technologies.
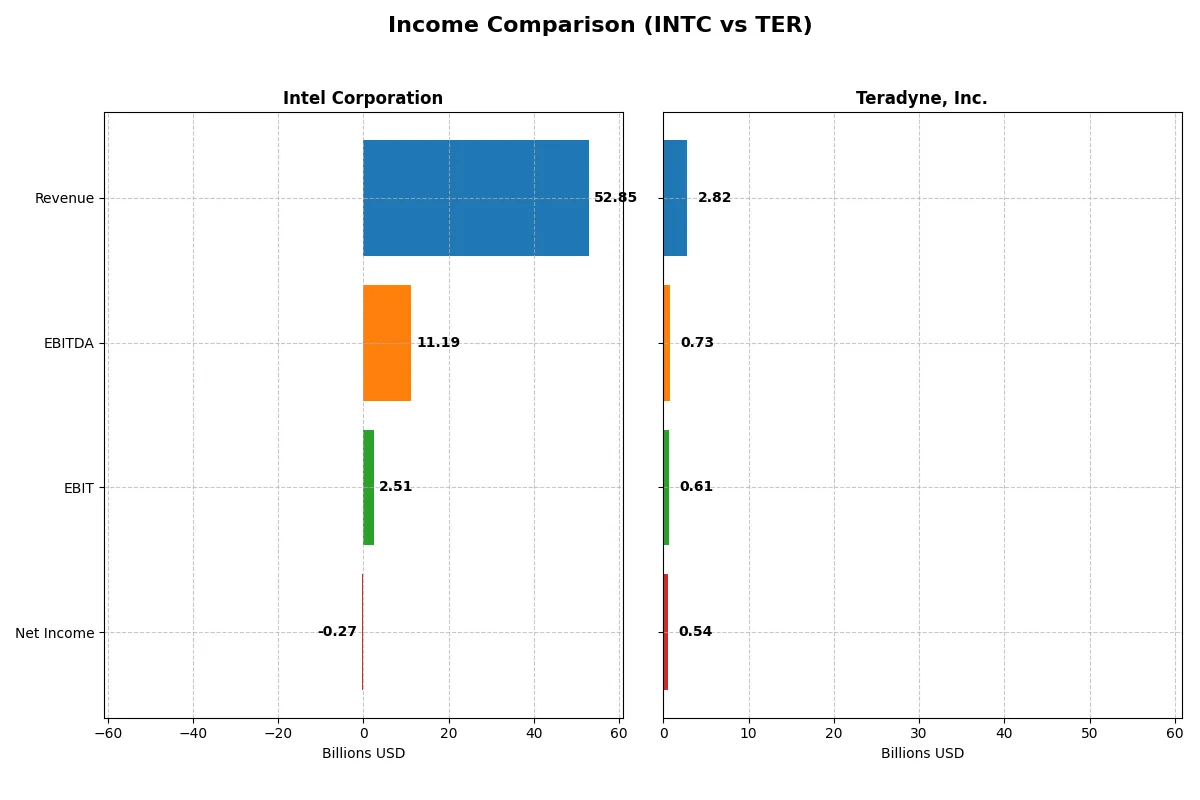
Income Statement Comparison
This data dissects the core profitability and scalability of both corporate engines to reveal who dominates the bottom line:
| Metric | Intel Corporation (INTC) | Teradyne, Inc. (TER) |
|---|---|---|
| Revenue | 52.85B | 2.82B |
| Cost of Revenue | 34.38B | 1.17B |
| Operating Expenses | 20.60B | 1.06B |
| Gross Profit | 18.48B | 1.65B |
| EBITDA | 11.19B | 732M |
| EBIT | 2.51B | 613M |
| Interest Expense | 953M | 3.59M |
| Net Income | -267M | 542M |
| EPS | -0.08 | 3.41 |
| Fiscal Year | 2025 | 2024 |
Income Statement Analysis: The Bottom-Line Duel
This income statement comparison reveals the fundamental efficiency and financial momentum driving each company’s corporate engine.
Intel Corporation Analysis
Intel’s revenue declined by 0.5% to $52.9B in 2025, while gross profit improved 6.5% to $18.5B, reflecting solid margin control. However, net income remains negative at -$267M, a sharp turnaround from prior profits. The 4.75% EBIT margin signals operational challenges despite a recent rebound in profitability momentum.
Teradyne, Inc. Analysis
Teradyne grew revenue 5.4% to $2.82B in 2024 with a robust 58.5% gross margin that supports strong profitability. Net income jumped 21% to $542M, underpinned by a 21.7% EBIT margin and disciplined cost management. The company shows consistent operational efficiency and margin expansion, reflecting healthy business momentum.
Margin Efficiency vs. Scale Challenges
Teradyne clearly outperforms on margin efficiency and net income growth, boasting superior profitability ratios and expanding earnings. Intel, despite larger scale, struggles with negative net income and compressed margins, reflecting operational headwinds. For investors prioritizing margin strength and earnings momentum, Teradyne’s profile offers a more compelling fundamental foundation.
Financial Ratios Comparison
These vital ratios act as a diagnostic tool to expose the underlying fiscal health, valuation premiums, and capital efficiency of the companies compared below:
| Ratios | Intel Corporation (INTC) | Teradyne, Inc. (TER) |
|---|---|---|
| ROE | -0.23% | 19.24% |
| ROIC | -0.02% | 17.25% |
| P/E | -658.4 | 36.9 |
| P/B | 1.54 | 7.11 |
| Current Ratio | 2.02 | 2.91 |
| Quick Ratio | 1.65 | 1.84 |
| D/E (Debt-to-Equity) | 0.41 | 0.03 |
| Debt-to-Assets | 22.0% | 2.1% |
| Interest Coverage | -2.23 | 165.54 |
| Asset Turnover | 0.25 | 0.76 |
| Fixed Asset Turnover | 0.50 | 4.88 |
| Payout ratio | 0% | 14.1% |
| Dividend yield | 0% | 0.38% |
| Fiscal Year | 2025 | 2024 |
Efficiency & Valuation Duel: The Vital Signs
Ratios act as a company’s DNA, exposing hidden risks and operational excellence through clear, quantifiable financial signals.
Intel Corporation
Intel’s profitability shows weakness with negative ROE and net margin, signaling operational challenges. Its P/E ratio is unusually negative, reflecting earnings distress, while P/B remains moderate. Intel’s solid current ratio and manageable debt highlight financial stability. The firm forgoes dividends, reinvesting heavily in R&D (26% of revenue), aiming to drive future growth despite current losses.
Teradyne, Inc.
Teradyne demonstrates robust profitability with a 19.2% ROE and strong margins. Its valuation appears stretched, with a high P/E near 37 and elevated P/B over 7, suggesting premium pricing. The company maintains excellent liquidity and minimal debt, supporting operational safety. Teradyne provides a modest dividend yield (0.38%) while continuing to invest in R&D (16% of revenue) to sustain innovation.
Premium Valuation vs. Operational Safety
Teradyne offers superior profitability and financial health but trades at a premium, increasing valuation risk. Intel’s lower valuation contrasts with weak profitability and no dividends, reflecting operational strain. Investors seeking growth with operational resilience may prefer Teradyne, while those focused on turnaround potential might consider Intel’s profile.
Which one offers the Superior Shareholder Reward?
I see Intel (INTC) pays no dividend in 2025, with a payout ratio at 0% and negative free cash flow of -1B. Its buyback program appears muted amid operating losses and weak margins. Teradyne (TER) offers a modest 0.38% dividend yield with a conservative 14% payout ratio, backed by strong free cash flow of 3B. TER’s share buybacks are significant, supported by robust profitability and solid cash flow. I believe TER’s balanced distribution—modest dividends plus aggressive buybacks—is more sustainable and attractive for long-term total returns in 2026.
Comparative Score Analysis: The Strategic Profile
The radar chart reveals the fundamental DNA and trade-offs of Intel Corporation and Teradyne, Inc., highlighting their unique financial strengths and weaknesses:
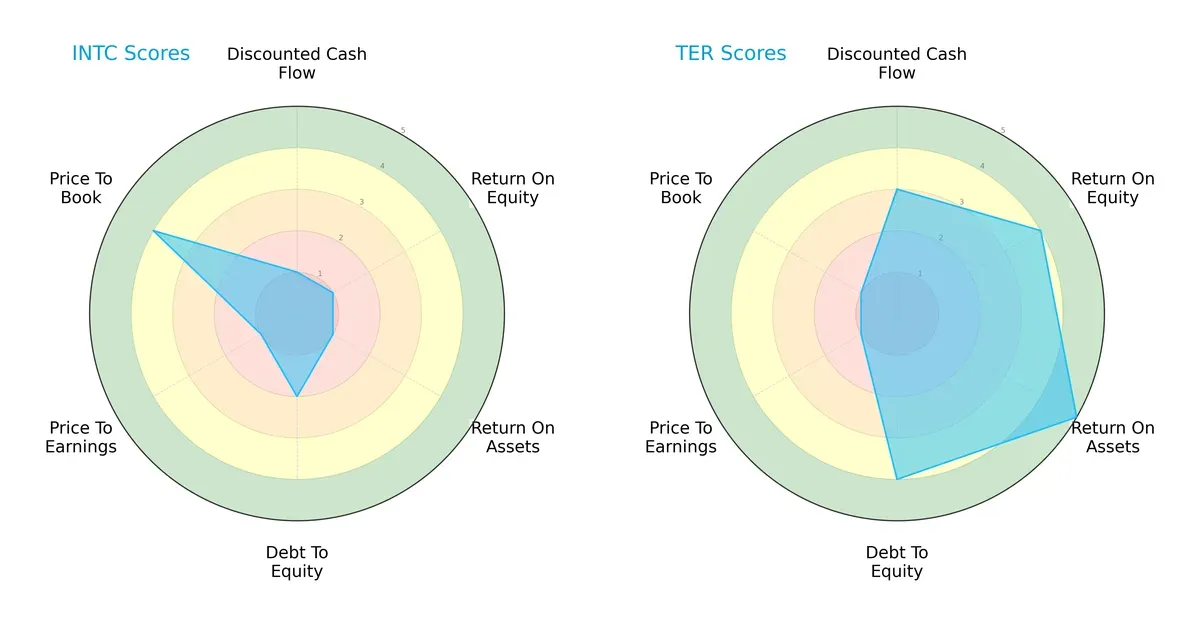
Teradyne boasts a more balanced and robust profile with strong DCF (3), ROE (4), ROA (5), and debt-to-equity (4) scores. Intel lags with very weak operational metrics but shows some value in price-to-book (4). Teradyne’s edge lies in operational efficiency, while Intel relies on valuation appeal amid weak profitability.
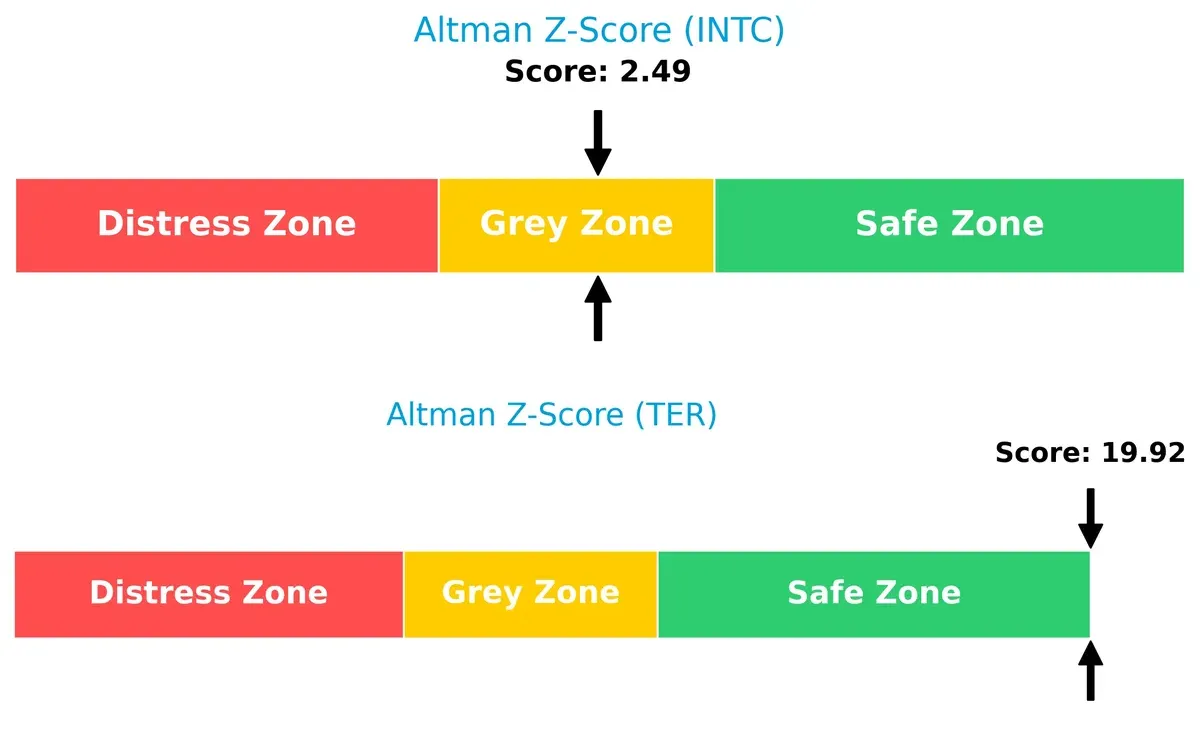
Bankruptcy Risk: Solvency Showdown
Teradyne’s Altman Z-Score of 19.9 places it firmly in the safe zone, signaling strong solvency and low bankruptcy risk. Intel’s 2.49 score sits in the grey zone, suggesting moderate financial distress risk in this cycle:
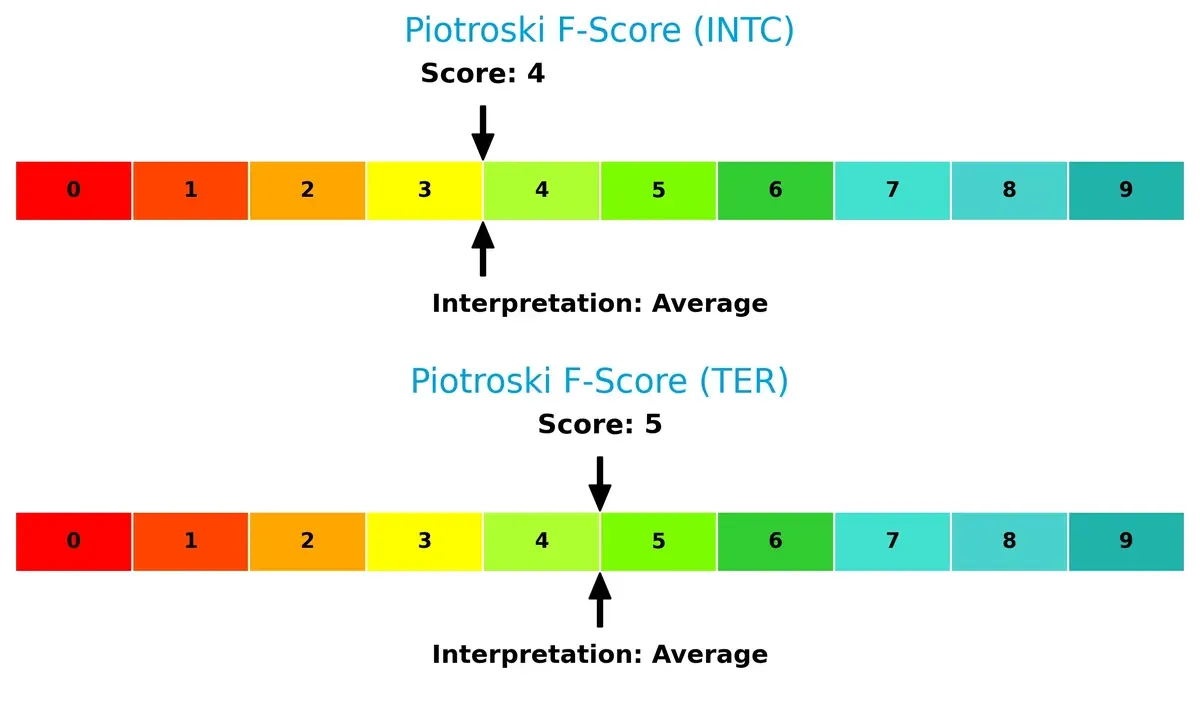
Financial Health: Quality of Operations
Both companies demonstrate average financial health via Piotroski F-Scores, with Teradyne slightly ahead at 5 versus Intel’s 4. Neither shows red flags, but Intel’s lower score signals weaker internal fundamentals:
How are the two companies positioned?
This section dissects Intel and Teradyne’s operational DNA by comparing their revenue distribution and internal dynamics. The goal is to confront their economic moats and identify which model offers the most resilient, sustainable advantage today.
Revenue Segmentation: The Strategic Mix
This visual comparison dissects how Intel Corporation and Teradyne, Inc. diversify their income streams and where their primary sector bets lie:
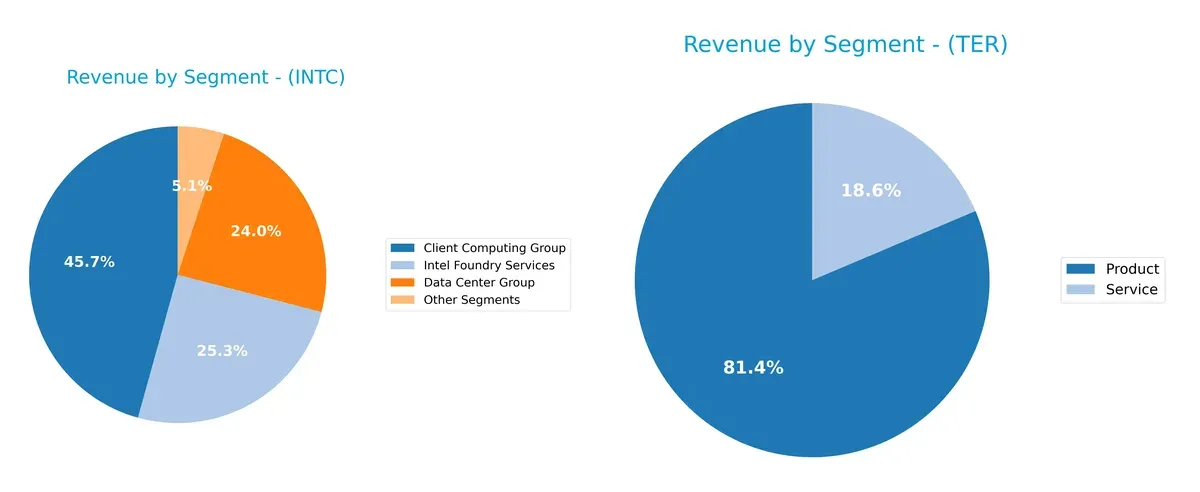
Intel Corporation anchors its revenue heavily in Client Computing Group at $32.2B and Intel Foundry Services at $17.8B, showing a strong focus on core semiconductor manufacturing and services. Teradyne, Inc. pivots mainly on Product sales at $2.3B, with Services contributing $525M, reflecting a narrower but solid industrial automation and testing niche. Intel’s diversified segments reduce concentration risk, while Teradyne’s reliance on fewer segments increases exposure but signals focused market leadership.
Strengths and Weaknesses Comparison
This table compares the strengths and weaknesses of Intel Corporation and Teradyne, Inc. based on diversification, profitability, financials, innovation, global presence, and market share:
Intel Corporation Strengths
- Diversified revenue across multiple segments including Client Computing and Data Center
- Global presence in US, Singapore, Taiwan, and China
- Strong current and quick ratios indicate liquidity
- Moderate debt levels support financial stability
Teradyne, Inc. Strengths
- High profitability with strong net margin, ROE, and ROIC
- Very favorable liquidity ratios with low debt levels
- Robust asset turnover and fixed asset efficiency
- Global presence including US, China, Korea, and Taiwan
Intel Corporation Weaknesses
- Negative profitability metrics including net margin and ROE
- Unfavorable asset turnover and fixed asset turnover
- No dividend yield limits income appeal
- Slightly unfavorable overall financial ratio profile
Teradyne, Inc. Weaknesses
- Higher WACC and valuation multiples suggest expensive stock
- Dividend yield is low despite profitability
- Less product revenue diversification relative to Intel
Intel demonstrates broad diversification and solid liquidity but faces challenges in profitability and asset efficiency. Teradyne excels in profitability and operational efficiency but carries valuation and cost of capital concerns. These differences reflect contrasting strategic and financial profiles in their respective markets.
The Moat Duel: Analyzing Competitive Defensibility
A structural moat is the only reliable shield protecting long-term profits from relentless competitive erosion:
Intel Corporation: Scale and Manufacturing Prowess
Intel’s moat stems from its massive manufacturing scale and proprietary process technology. Despite a troubling ROIC below WACC, its margin stability and product breadth provide some defense. New AI and autonomous driving markets in 2026 could deepen this moat if execution improves.
Teradyne, Inc.: Precision Automation and Test Expertise
Teradyne’s moat lies in specialized test equipment and automation technology, contrasting Intel’s scale focus. It consistently delivers ROIC above WACC with robust margins. Though ROIC trends down, expanding industrial automation and wireless test markets offer growth and moat reinforcement in 2026.
Manufacturing Scale vs. Specialized Automation: The Moat Verdict
Teradyne possesses the deeper moat, creating clear value with superior ROIC and margins. Intel’s scale is impressive but currently destroys value and faces profitability decline. Teradyne is better equipped to defend and grow its market share in the evolving semiconductor ecosystem.
Which stock offers better returns?
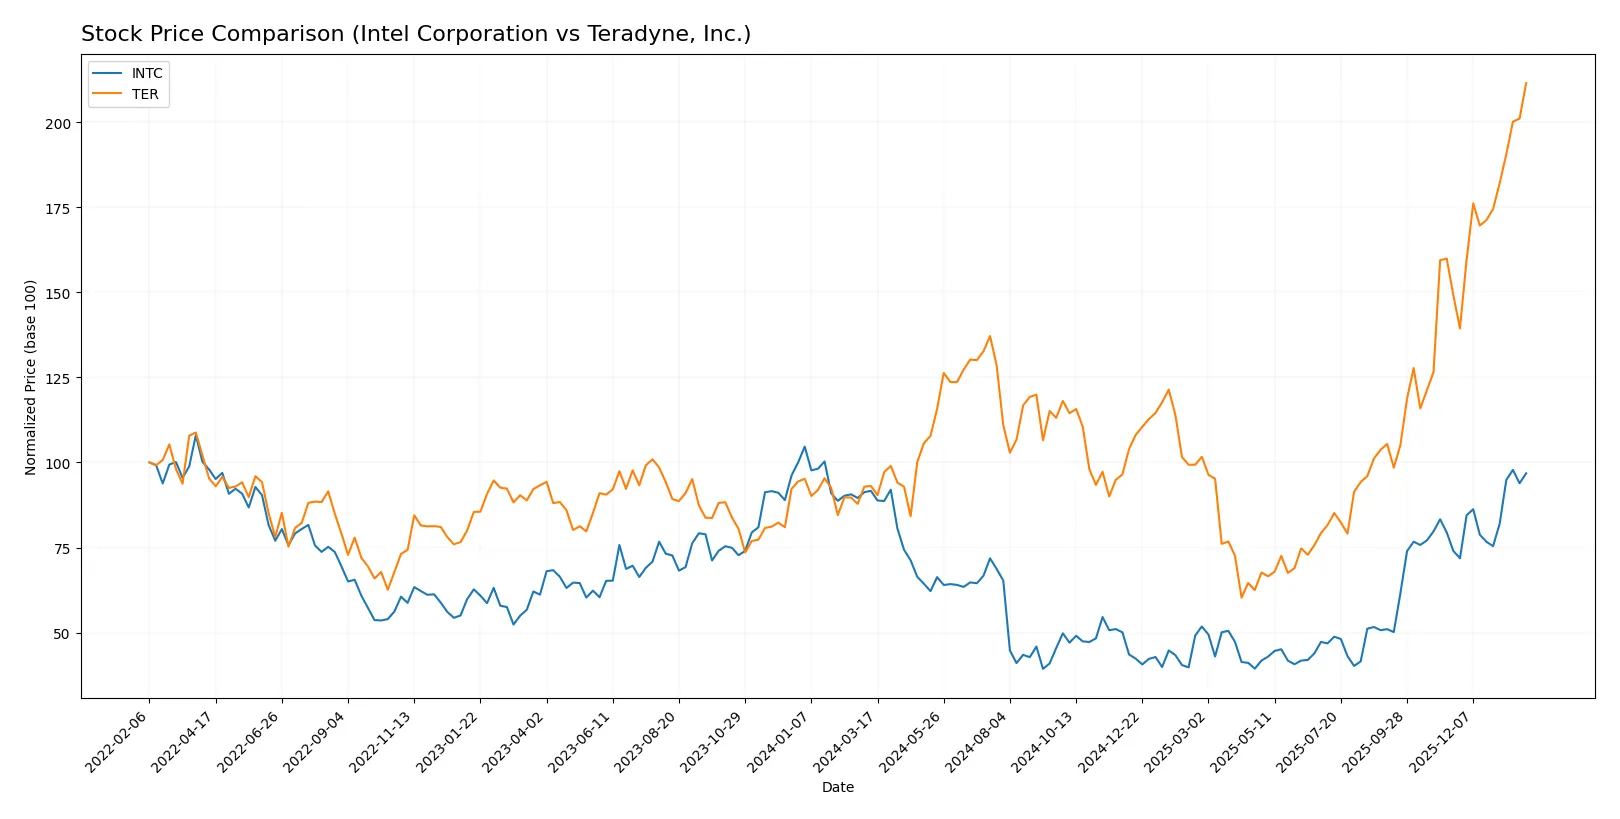
The past year reveals marked price advances and dynamic trading in both stocks, with Teradyne surging sharply and Intel showing steady growth amid increasing buyer interest.
Trend Comparison
Intel’s stock rose 5.61% over the last 12 months, marking a bullish trend with accelerating momentum and moderate volatility (8.11 std dev). The price ranged from $18.89 to $46.96.
Teradyne’s stock surged 127.15% over the same period, also bullish with acceleration and higher volatility (36.6 std dev). Its price fluctuated between $68.72 and $241.05.
Teradyne outperformed Intel significantly, delivering the highest market performance with a strong upward trend and greater buyer dominance.
Target Prices
Analysts present a balanced target consensus for Intel Corporation and Teradyne, Inc., reflecting moderate upside potential.
| Company | Target Low | Target High | Consensus |
|---|---|---|---|
| Intel Corporation | 20 | 66 | 46.95 |
| Teradyne, Inc. | 136 | 280 | 221.2 |
Intel’s consensus target aligns closely with its current price of $46.47, suggesting limited upside. Teradyne’s target consensus implies a 9% potential gain from the current $241.05 price level.

Don’t Let Luck Decide Your Entry Point
Optimize your entry points with our advanced ProRealTime indicators. You’ll get efficient buy signals with precise price targets for maximum performance. Start outperforming now!
How do institutions grade them?
The following tables summarize institutional grades for Intel Corporation and Teradyne, Inc.:
Intel Corporation Grades
The table below compiles recent grades from various reputable grading companies for Intel Corporation.
| Grading Company | Action | New Grade | Date |
|---|---|---|---|
| RBC Capital | Maintain | Sector Perform | 2026-01-23 |
| Keybanc | Maintain | Overweight | 2026-01-23 |
| Evercore ISI Group | Maintain | In Line | 2026-01-23 |
| Needham | Maintain | Hold | 2026-01-23 |
| Benchmark | Maintain | Buy | 2026-01-23 |
| Rosenblatt | Maintain | Sell | 2026-01-23 |
| UBS | Maintain | Neutral | 2026-01-23 |
| Citigroup | Maintain | Neutral | 2026-01-23 |
| Stifel | Maintain | Hold | 2026-01-23 |
| Wedbush | Maintain | Neutral | 2026-01-23 |
Teradyne, Inc. Grades
This table presents recent institutional grades from reputable sources for Teradyne, Inc.
| Grading Company | Action | New Grade | Date |
|---|---|---|---|
| Stifel | Maintain | Buy | 2026-01-30 |
| UBS | Maintain | Buy | 2026-01-26 |
| B of A Securities | Maintain | Buy | 2026-01-22 |
| Stifel | Maintain | Buy | 2026-01-14 |
| B of A Securities | Maintain | Buy | 2026-01-13 |
| Goldman Sachs | Upgrade | Buy | 2025-12-16 |
| Stifel | Upgrade | Buy | 2025-12-02 |
| Citigroup | Maintain | Buy | 2025-11-12 |
| JP Morgan | Maintain | Neutral | 2025-10-30 |
| UBS | Maintain | Buy | 2025-10-30 |
Which company has the best grades?
Teradyne, Inc. consistently receives Buy ratings from multiple institutions, including recent upgrades. Intel Corporation’s grades vary widely, from Buy to Sell, showing less consensus. This disparity influences investor confidence and risk assessment.
Risks specific to each company
The following categories identify the critical pressure points and systemic threats facing both firms in the 2026 market environment:
1. Market & Competition
Intel Corporation
- Faces intense competition in semiconductors with slowing innovation and negative net margin.
Teradyne, Inc.
- Operates in niche automatic test equipment with strong margins but high valuation risks.
2. Capital Structure & Debt
Intel Corporation
- Moderate debt level (D/E 0.41), interest coverage neutral at 2.63x; manageable but watch cash flow.
Teradyne, Inc.
- Minimal debt (D/E 0.03), excellent interest coverage of 170x; conservatively financed.
3. Stock Volatility
Intel Corporation
- Beta 1.35 indicates moderate volatility, with recent 4.5% price drop raising caution.
Teradyne, Inc.
- Higher beta at 1.82 implies more volatile stock; 4.3% price decline reflects market sensitivity.
4. Regulatory & Legal
Intel Corporation
- Subject to stringent US tech export controls and antitrust scrutiny.
Teradyne, Inc.
- Faces regulatory risks in automation and wireless test sectors but less exposed globally.
5. Supply Chain & Operations
Intel Corporation
- Large-scale manufacturing complexity poses supply chain risks amid global chip shortages.
Teradyne, Inc.
- Depends on semiconductor manufacturing customers; supply chain disruptions could affect demand.
6. ESG & Climate Transition
Intel Corporation
- Significant ESG initiatives but energy-intensive fabs challenge carbon footprint goals.
Teradyne, Inc.
- Automation solutions align with efficiency trends; smaller footprint but growing expectations.
7. Geopolitical Exposure
Intel Corporation
- Exposure to US-China tensions impacts supply chain and market access significantly.
Teradyne, Inc.
- Less direct exposure but reliant on global semiconductor market stability.
Which company shows a better risk-adjusted profile?
Intel’s largest risk is its negative profitability amid fierce competitive pressure and operational complexity. Teradyne’s key risk lies in its high valuation and stock volatility, despite solid profitability and balance sheet strength. Teradyne exhibits a better risk-adjusted profile, supported by a safer Altman Z-Score (19.9 vs. Intel’s 2.5) and stronger financial ratios. Intel’s recent sharp margin decline and negative ROIC raise red flags in a challenging semiconductor cycle.
Final Verdict: Which stock to choose?
Intel Corporation’s superpower lies in its scale and entrenched position within semiconductor manufacturing. Its strong liquidity cushions operational risks, but its ongoing value destruction and declining profitability warrant caution. Intel suits portfolios aiming for a turnaround play with a tolerance for execution risk and cyclical volatility.
Teradyne, Inc. offers a strategic moat through its specialization in automated test equipment, delivering strong returns on invested capital and a solid balance sheet. It presents a safer profile than Intel, supported by consistent profitability and value creation. Teradyne fits well with growth-at-a-reasonable-price investors seeking more stable cash flow and operational efficiency.
If you prioritize a potential revival in a legacy tech giant, Intel is the compelling choice due to its scale and recovery prospects despite current financial headwinds. However, if you seek durable value creation and financial stability, Teradyne outshines with its efficient capital use and robust moat, commanding a premium justified by its safer risk profile.
Disclaimer: Investment carries a risk of loss of initial capital. The past performance is not a reliable indicator of future results. Be sure to understand risks before making an investment decision.
Go Further
I encourage you to read the complete analyses of Intel Corporation and Teradyne, Inc. to enhance your investment decisions: