Home > Comparison > Technology > TSM vs INTC
The strategic rivalry between Taiwan Semiconductor Manufacturing Company Limited (TSM) and Intel Corporation (INTC) shapes the semiconductor industry’s future. TSM operates as a pure-play foundry, focusing on advanced wafer fabrication, while Intel integrates design and manufacturing in a capital-intensive model. This clash highlights a contest between manufacturing scale and integrated innovation. This analysis aims to identify which trajectory offers superior risk-adjusted returns for a diversified portfolio in a rapidly evolving sector.
Table of contents
Companies Overview
Taiwan Semiconductor Manufacturing Company Limited and Intel Corporation drive innovation in the global semiconductor industry.
Taiwan Semiconductor Manufacturing Company Limited: Global Foundry Leader
Taiwan Semiconductor Manufacturing Company Limited dominates as the world’s largest pure-play semiconductor foundry. It generates revenue by manufacturing integrated circuits using advanced wafer fabrication processes for clients across multiple industries. In 2026, it strategically emphasizes expanding high-performance computing and automotive chip production to capture emerging technology demands.
Intel Corporation: Integrated Chipmaker and Innovator
Intel Corporation operates primarily as a designer and manufacturer of computer products and technologies, focusing on CPUs, chipsets, and system-on-chip solutions. Its 2026 strategy centers on advancing AI-driven compute platforms and autonomous driving technologies while supporting cloud service providers with workload-optimized products.
Strategic Collision: Similarities & Divergences
Both companies compete fiercely in semiconductor manufacturing but diverge in business models: TSMC operates an open foundry, while Intel maintains a closed, vertically integrated ecosystem. Their primary battleground lies in high-performance and AI chips, where TSMC’s advanced process technology challenges Intel’s integrated design approach. This dynamic results in distinct investment profiles, with TSMC as a pure-play foundry and Intel as a diversified technology innovator.
Income Statement Comparison
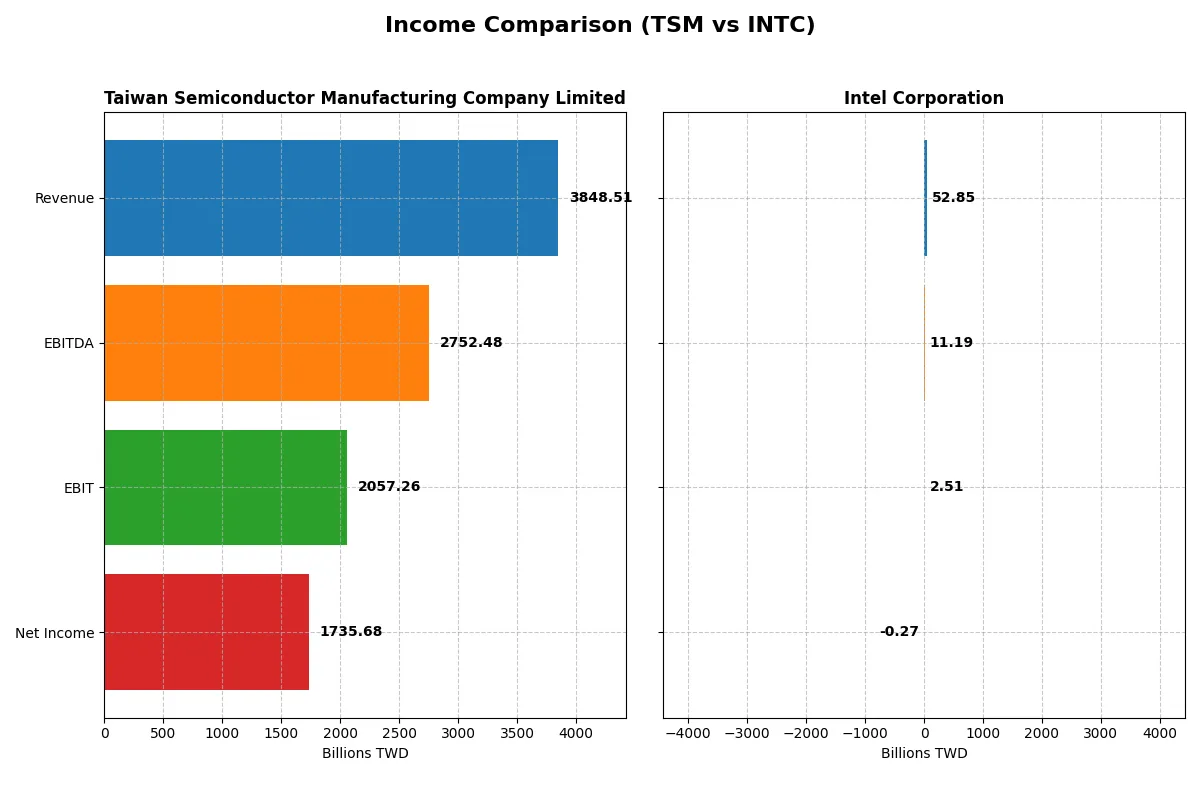
The following data dissects the core profitability and scalability of both corporate engines to reveal who dominates the bottom line:
| Metric | Taiwan Semiconductor Manufacturing Company Limited (TSM) | Intel Corporation (INTC) |
|---|---|---|
| Revenue | 3.85T TWD | 52.85B USD |
| Cost of Revenue | 1.54T TWD | 34.38B USD |
| Operating Expenses | 349.23B TWD | 20.60B USD |
| Gross Profit | 2.30T TWD | 18.48B USD |
| EBITDA | 2.75T TWD | 11.19B USD |
| EBIT | 2.06T TWD | 2.51B USD |
| Interest Expense | 0 | 953M USD |
| Net Income | 1.74T TWD | -267M USD |
| EPS | 334.6 TWD | -0.0817 USD |
| Fiscal Year | 2025 | 2025 |
Income Statement Analysis: The Bottom-Line Duel
The income statement comparison reveals which company converts revenue into profit most efficiently over a challenging market cycle.
Taiwan Semiconductor Manufacturing Company Limited Analysis
TSM shows a strong revenue climb from 1.59T TWD in 2021 to 3.85T TWD in 2025, nearly doubling in five years. Net income surged even faster, nearly tripling to 1.74T TWD in 2025. Gross and net margins remain robust at 59.9% and 45.1%, respectively, underscoring exceptional operational efficiency and disciplined cost management. The latest year highlights accelerating momentum with a 33% revenue increase and 13% net margin expansion.
Intel Corporation Analysis
Intel’s revenue declined from $79B in 2021 to $53B in 2025, reflecting sector headwinds and execution challenges. Net income swung from a $19.8B profit in 2021 to a $267M loss in 2025, dragging net margins into negative territory at -0.5%. Despite a slight gross margin rebound to 35%, operating income remained negative, signaling ongoing profitability pressures. The latest year’s flat revenue and modest gross profit growth mask deeper margin struggles.
Margin Dominance vs. Revenue Decline
TSM clearly outperforms Intel in profitability and growth, with superior margin expansion and strong net income gains. Intel’s shrinking revenue base and negative net margins highlight persistent turnaround risks. For investors, TSM’s profile offers stable growth and margin resilience, while Intel’s stalled recovery demands caution amid ongoing earnings volatility.
Financial Ratios Comparison
These vital ratios act as a diagnostic tool to expose the underlying fiscal health, valuation premiums, and capital efficiency of the companies compared below:
| Ratios | Taiwan Semiconductor Manufacturing Company Limited (TSM) | Intel Corporation (INTC) |
|---|---|---|
| ROE | 32.1% | -0.2% |
| ROIC | 24.9% | -0.02% |
| P/E | 28.5 | -658.4 |
| P/B | 9.14 | 1.54 |
| Current Ratio | 2.62 | 2.02 |
| Quick Ratio | 2.42 | 1.65 |
| D/E | 0.18 | 0.41 |
| Debt-to-Assets | 12.5% | 22.0% |
| Interest Coverage | 0 | -2.23 |
| Asset Turnover | 0.49 | 0.25 |
| Fixed Asset Turnover | 1.05 | 0.50 |
| Payout ratio | 27.2% | 0% |
| Dividend yield | 0.95% | 0% |
| Fiscal Year | 2025 | 2025 |
Efficiency & Valuation Duel: The Vital Signs
Ratios act as the company’s DNA, revealing hidden risks and operational excellence behind headline financials.
Taiwan Semiconductor Manufacturing Company Limited
Taiwan Semiconductor’s ROE of 32.12% and net margin of 45.1% signal strong profitability and operational excellence. Despite a stretched P/E of 28.45 and elevated P/B at 9.14, the stock remains efficient. The modest 0.95% dividend yield contrasts with reinvestment in R&D fueling sustainable growth and solid capital allocation.
Intel Corporation
Intel’s negative ROE and net margin highlight profitability challenges. While the deeply negative P/E is mathematically favorable, it reflects losses, not value. Intel maintains a solid current ratio of 2.02 but offers no dividend, focusing capital on heavy R&D investments amid operational headwinds. Asset turnover ratios remain weak, signaling inefficiency.
Premium Valuation vs. Operational Safety
Taiwan Semiconductor delivers superior profitability and operational efficiency but at a premium valuation. Intel faces significant profitability and efficiency risks despite better liquidity metrics. Investors prioritizing growth and operational strength may prefer Taiwan Semiconductor, while those seeking turnaround potential might consider Intel’s riskier profile.
Which one offers the Superior Shareholder Reward?
I observe that TSM delivers a balanced distribution strategy with a 1.08% dividend yield and a 31% payout ratio, supported by strong free cash flow of 211B TWD in 2025. Its robust buyback program enhances shareholder returns sustainably. In contrast, INTC suspends dividends and posts negative free cash flow (-1B USD), reflecting operational challenges and limited buyback activity. TSM’s model clearly outperforms for long-term total return in 2026.
Comparative Score Analysis: The Strategic Profile
The radar chart reveals the fundamental DNA and trade-offs of Taiwan Semiconductor Manufacturing Company Limited and Intel Corporation:
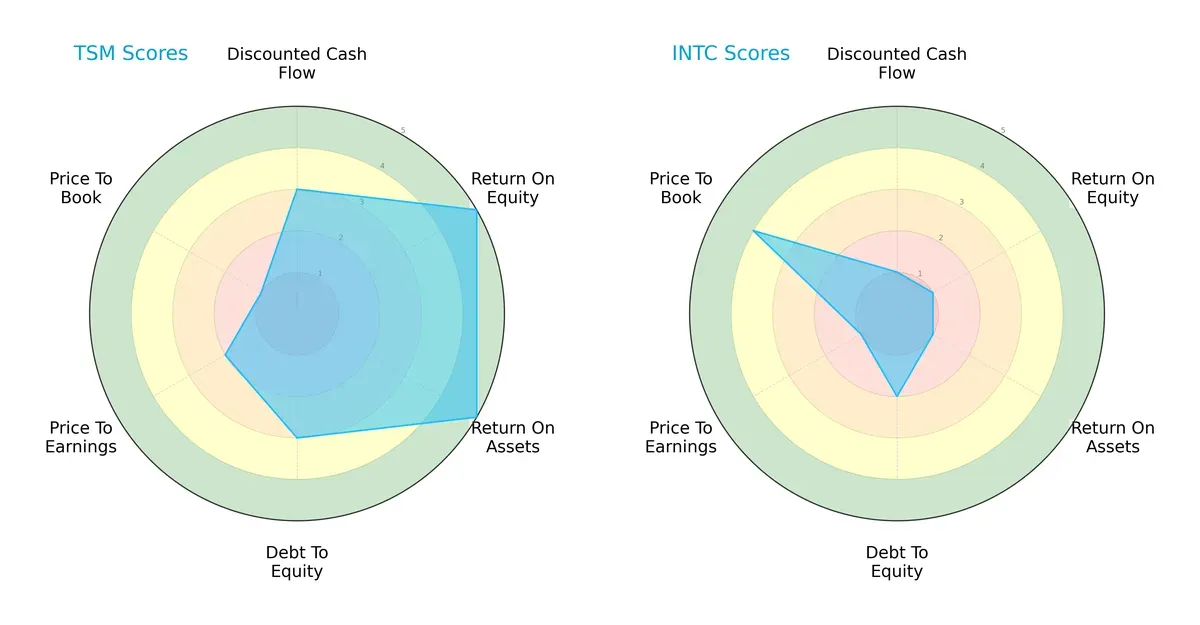
Taiwan Semiconductor demonstrates a balanced profile with strong ROE and ROA scores (5 each), indicating efficient profit generation and asset utilization. Its moderate DCF (3) and Debt/Equity (3) scores suggest reasonable valuation and financial stability. Intel leans heavily on its favorable price-to-book ratio (4), but suffers from weak profitability metrics (ROE and ROA at 1) and poor DCF (1), showing reliance on valuation rather than operational strength.
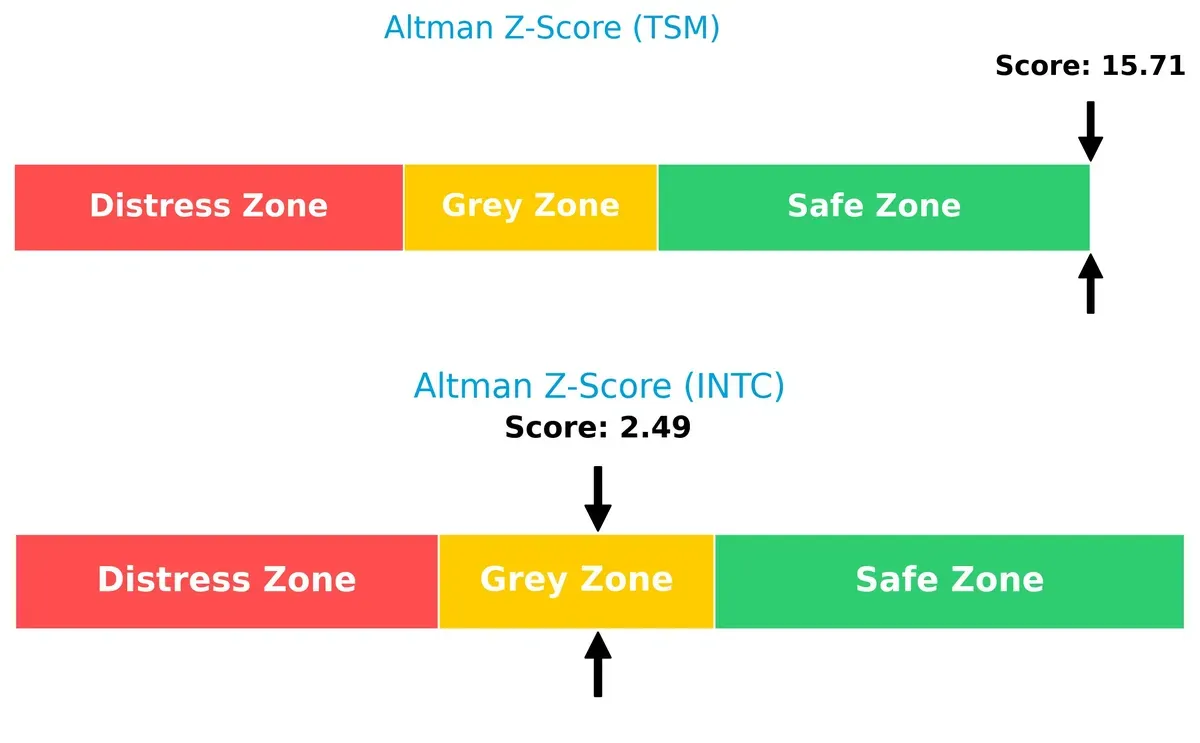
Bankruptcy Risk: Solvency Showdown
Taiwan Semiconductor’s Altman Z-Score of 15.7 places it well within the safe zone, signaling robust financial health. Intel’s score of 2.5 situates it in the grey zone, implying moderate bankruptcy risk in this cycle:
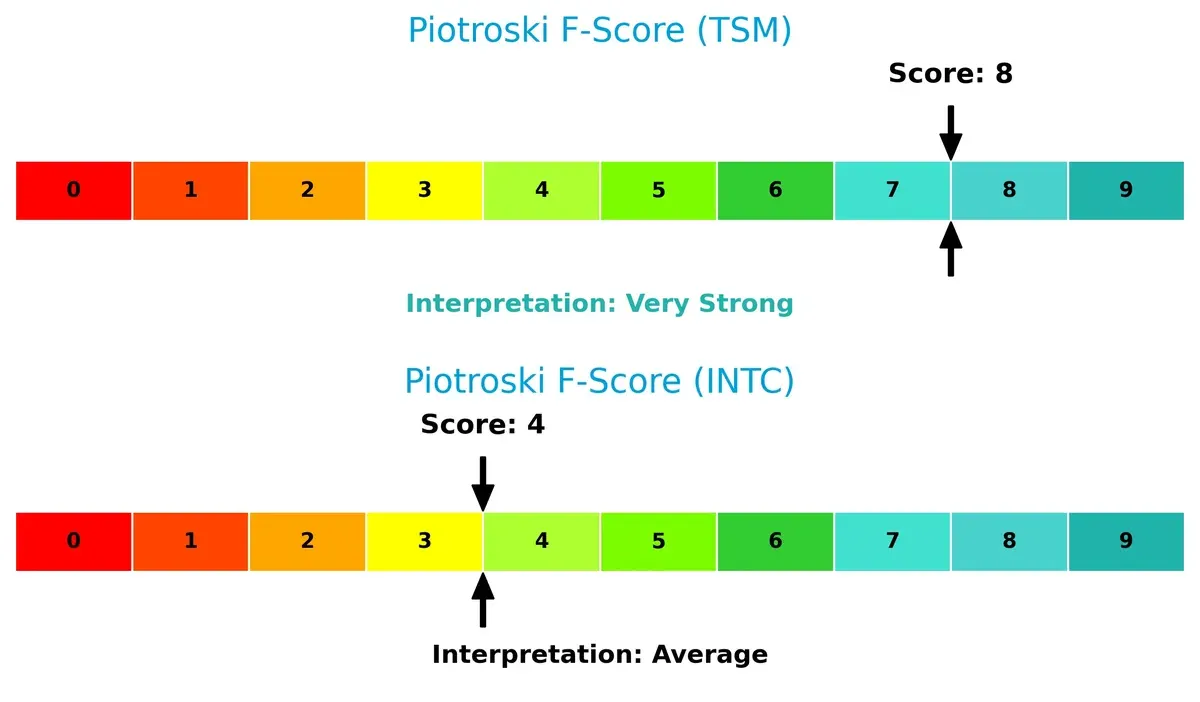
Financial Health: Quality of Operations
Taiwan Semiconductor’s Piotroski F-Score of 8 signals very strong financial health and solid internal metrics. Intel’s score of 4 is average, raising red flags about its operational quality and financial robustness compared to its peer:
How are the two companies positioned?
This section dissects the operational DNA of TSM and INTC by comparing their revenue distribution by segment and internal dynamics. The goal is to confront their economic moats to identify which model offers the most resilient, sustainable advantage today.
Revenue Segmentation: The Strategic Mix
This visual comparison dissects how Taiwan Semiconductor Manufacturing Company Limited and Intel Corporation diversify their income streams and where their primary sector bets lie:
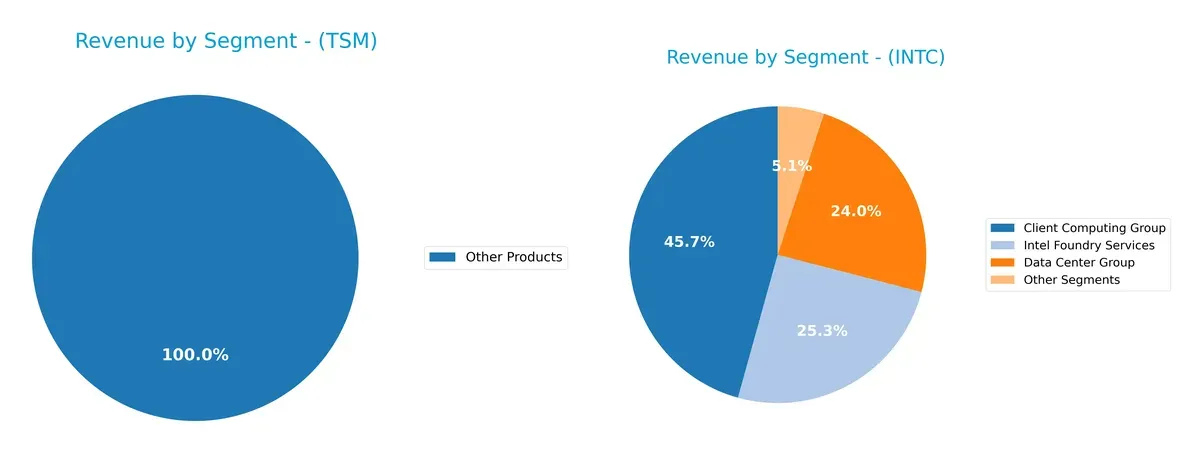
Taiwan Semiconductor Manufacturing Company Limited dwarfs Intel in wafer sales, anchoring over 1.9T TWD in 2022, while Intel pivots with a more diversified mix across Client Computing Group (32.2B USD), Data Center Group (16.9B USD), and Foundry Services (17.8B USD) in 2025. TSM’s wafer dominance suggests infrastructure lock-in but concentration risk, whereas Intel’s varied segments reduce dependency on any single market, enhancing strategic flexibility.
Strengths and Weaknesses Comparison
This table compares the Strengths and Weaknesses of Taiwan Semiconductor Manufacturing Company Limited (TSM) and Intel Corporation (INTC):
TSM Strengths
- High net margin (45.1%) and ROE (32.12%) demonstrate strong profitability
- Favorable liquidity ratios (current ratio 2.62, quick ratio 2.42)
- Low debt-to-assets (12.52%) and strong interest coverage
- Significant market share in wafer manufacturing (TWD 1.99T revenue in 2022)
- Global presence with strong sales in US, China, and Taiwan
INTC Strengths
- Favorable P/E ratio despite negative earnings, indicating market undervaluation
- Favorable debt management with D/E 0.41 and debt-to-assets 22.03%
- Diversified revenue with multiple segments including Client Computing and Data Center
- Global footprint with sales across US, China, Singapore, Taiwan
- Positive liquidity with current ratio 2.02 and quick ratio 1.65
TSM Weaknesses
- Unfavorable valuation multiples (P/E 28.45, P/B 9.14) may limit upside
- Asset turnover low at 0.49 signals less efficient asset use
- Dividend yield low at 0.95% may deter income investors
- Heavy reliance on wafer segment limits diversification
- High price multiples suggest premium valuation risk
INTC Weaknesses
- Negative net margin (-0.51%), ROE (-0.23%), and ROIC (-0.02%) indicate operational struggles
- Unfavorable asset turnover (0.25) and fixed asset turnover (0.5) reflect inefficiencies
- Dividend yield at zero reduces shareholder income
- Interest coverage low at 2.63 signals potential financial stress
- Revenue heavily concentrated in few segments limits diversification
Both companies show clear strengths and weaknesses. TSM excels in profitability and financial health but faces valuation and concentration risks. INTC struggles with profitability and efficiency yet maintains solid liquidity and a diversified revenue base. These contrasts highlight differing strategic challenges and market perceptions.
The Moat Duel: Analyzing Competitive Defensibility
A structural moat protects long-term profits from competition’s relentless erosion. Here’s how Taiwan Semiconductor and Intel stand:
Taiwan Semiconductor Manufacturing Company Limited: Advanced Process Leadership
TSMC’s moat is rooted in its cutting-edge manufacturing scale and technology mastery. Its 15%+ ROIC above WACC delivers exceptional margin stability and profit growth. New nodes and expanded capacity deepen this lead in 2026.
Intel Corporation: Legacy Scale with Market Recovery Challenge
Intel’s moat relies on scale and integrated design but lacks TSMC’s tech edge. Negative ROIC trends indicate value erosion, despite recent EBIT growth. Intel’s 2026 turnaround depends on successful new product launches and market shifts.
Advanced Foundry Dominance vs. Legacy Chipmaker Recovery
TSMC holds a wider, more durable moat with superior capital efficiency and innovation scale. Intel faces uphill battles defending share as its competitive advantage erodes. TSMC is better positioned to sustain and grow profits long term.
Which stock offers better returns?
Over the past year, Taiwan Semiconductor Manufacturing Company Limited surged over 125%, showing strong acceleration. Intel Corporation posted a modest 5.6% gain with steady acceleration.
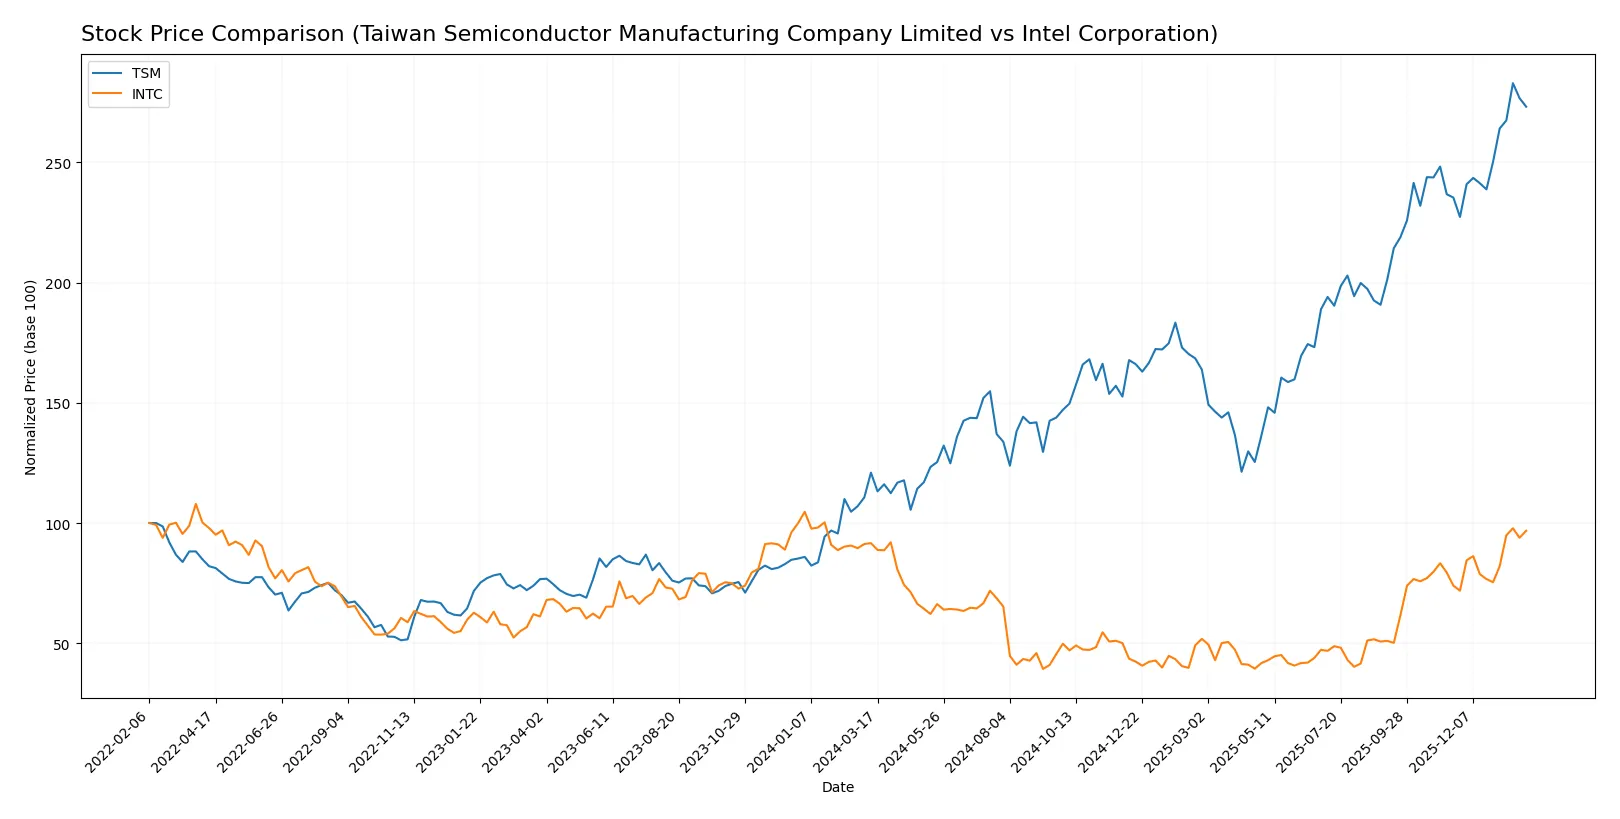
Trend Comparison
Taiwan Semiconductor Manufacturing Company Limited’s stock rose 125.84% over 12 months, marking a bullish trend with acceleration and high volatility (std dev 53.6). The price ranged from 127.7 to 342.4.
Intel Corporation’s shares climbed 5.61% in the same period, also bullish with acceleration but lower volatility (std dev 8.11). The stock moved between 18.89 and 46.96.
TSM’s performance substantially outpaced INTC’s, delivering the highest market returns over the past year by a wide margin.
Target Prices
Analysts present a broad but constructive target price consensus for TSM and INTC in the semiconductor sector.
| Company | Target Low | Target High | Consensus |
|---|---|---|---|
| Taiwan Semiconductor Manufacturing Company Limited | 330 | 450 | 397.5 |
| Intel Corporation | 20 | 66 | 46.95 |
The consensus target for TSM stands roughly 20% above its current 331 price, signaling moderate upside potential. INTC’s consensus aligns closely with its 46.5 price, reflecting more tempered market expectations.

Don’t Let Luck Decide Your Entry Point
Optimize your entry points with our advanced ProRealTime indicators. You’ll get efficient buy signals with precise price targets for maximum performance. Start outperforming now!
How do institutions grade them?
Taiwan Semiconductor Manufacturing Company Limited Grades
Here are the latest grades from reputable firms for TSM:
| Grading Company | Action | New Grade | Date |
|---|---|---|---|
| TD Cowen | Maintain | Hold | 2026-01-16 |
| Barclays | Maintain | Overweight | 2026-01-16 |
| Needham | Maintain | Buy | 2026-01-15 |
| Bernstein | Maintain | Outperform | 2025-12-08 |
| Susquehanna | Maintain | Positive | 2025-10-10 |
Intel Corporation Grades
The following table shows Intel’s recent institutional grades:
| Grading Company | Action | New Grade | Date |
|---|---|---|---|
| RBC Capital | Maintain | Sector Perform | 2026-01-23 |
| Keybanc | Maintain | Overweight | 2026-01-23 |
| Evercore ISI Group | Maintain | In Line | 2026-01-23 |
| Needham | Maintain | Hold | 2026-01-23 |
| Benchmark | Maintain | Buy | 2026-01-23 |
| Rosenblatt | Maintain | Sell | 2026-01-23 |
| UBS | Maintain | Neutral | 2026-01-23 |
Which company has the best grades?
TSM consistently receives stronger consensus grades, including Buy and Outperform ratings, versus Intel’s mix of Buy, Hold, and Sell. This divergence may influence investor sentiment and portfolio positioning.
Risks specific to each company
The following categories identify critical pressure points and systemic threats facing Taiwan Semiconductor Manufacturing Company Limited and Intel Corporation in the 2026 market environment:
1. Market & Competition
Taiwan Semiconductor Manufacturing Company Limited
- Dominates advanced semiconductor foundry with strong global demand but faces rising competition from emerging Asian players.
Intel Corporation
- Struggles to regain market share; faces intense rivalry from TSM and AMD in CPUs and foundry services.
2. Capital Structure & Debt
Taiwan Semiconductor Manufacturing Company Limited
- Maintains low debt-to-equity (0.18) and strong interest coverage, indicating financial stability and low leverage risk.
Intel Corporation
- Higher leverage (debt-to-equity 0.41) and moderate interest coverage (2.63) raise concerns about debt servicing ability.
3. Stock Volatility
Taiwan Semiconductor Manufacturing Company Limited
- Beta of 1.274 suggests moderate sensitivity to market swings, typical for semiconductor leaders.
Intel Corporation
- Higher beta at 1.354 indicates elevated stock price volatility, increasing investment risk.
4. Regulatory & Legal
Taiwan Semiconductor Manufacturing Company Limited
- Operates internationally with exposure to cross-border trade regulations and Taiwan-China political tensions.
Intel Corporation
- Faces stricter U.S. regulatory scrutiny and antitrust investigations affecting business operations.
5. Supply Chain & Operations
Taiwan Semiconductor Manufacturing Company Limited
- Benefits from advanced manufacturing scale but vulnerable to semiconductor raw material shortages.
Intel Corporation
- Suffers from legacy fab inefficiencies and supply chain disruptions impacting production timelines.
6. ESG & Climate Transition
Taiwan Semiconductor Manufacturing Company Limited
- Invests in sustainable manufacturing but faces risks from energy-intensive processes in Taiwan.
Intel Corporation
- Committed to ESG goals but legacy operations generate substantial emissions, requiring costly upgrades.
7. Geopolitical Exposure
Taiwan Semiconductor Manufacturing Company Limited
- High geopolitical risk due to Taiwan’s strategic location and China tensions.
Intel Corporation
- Less direct geopolitical risk but vulnerable to global trade tensions and U.S.-China tech conflicts.
Which company shows a better risk-adjusted profile?
TSMC’s most impactful risk is geopolitical exposure linked to Taiwan-China tensions. Intel’s greatest threat is operational inefficiency combined with declining profitability. TSMC’s very strong Altman Z-score (15.7) and Piotroski score (8) confirm robust financial health and low bankruptcy risk. Intel’s grey zone Altman Z-score (2.49) and average Piotroski score (4) reflect financial strain and operational challenges. Despite TSMC’s geopolitical risks, its superior financial stability and capital structure make it the better risk-adjusted investment in 2026.
Final Verdict: Which stock to choose?
Taiwan Semiconductor Manufacturing Company Limited (TSM) wields unmatched operational efficiency and a durable competitive moat. Its robust ROIC well above WACC signals consistent value creation and growing profitability. A point of vigilance remains its relatively high valuation multiples, which could temper near-term upside. TSM fits well in portfolios seeking aggressive growth with a focus on quality and sustainability.
Intel Corporation (INTC) presents a strategic moat rooted in its entrenched market position and substantial R&D investment, fueling potential technological rebounds. It offers a safer balance sheet relative to its recent struggles, but its declining profitability and value destruction signal caution. INTC might suit investors who favor GARP strategies, aiming for turnaround opportunities with a margin of safety.
If you prioritize durable profitability and strong capital efficiency, TSM outshines as the compelling choice due to its proven value creation and accelerating growth trajectory. However, if you seek contrarian plays with a focus on potential recovery and undervaluation, INTC offers better stability in valuation and a chance to capitalize on a possible operational turnaround. Both require careful risk management aligned with your investment profile.
Disclaimer: Investment carries a risk of loss of initial capital. The past performance is not a reliable indicator of future results. Be sure to understand risks before making an investment decision.
Go Further
I encourage you to read the complete analyses of Taiwan Semiconductor Manufacturing Company Limited and Intel Corporation to enhance your investment decisions: