Home > Comparison > Technology > INTC vs SNPS
The strategic rivalry between Intel Corporation and Synopsys, Inc. shapes the evolving landscape of the technology sector. Intel operates as a capital-intensive semiconductor giant, manufacturing hardware platforms and compute solutions. In contrast, Synopsys leads as a high-margin software infrastructure provider specializing in electronic design automation. This analysis explores their divergent models to identify which offers superior risk-adjusted returns for a diversified technology portfolio.
Table of contents
Companies Overview
Intel Corporation and Synopsys, Inc. hold pivotal roles in the technology sector, shaping semiconductor hardware and software innovation worldwide.
Intel Corporation: Semiconductor Powerhouse
Intel dominates the semiconductor industry by designing and manufacturing central processing units and chipsets. Its core revenue engine combines platform products with adjacent offerings like accelerators and connectivity solutions. In 2026, Intel focuses strategically on high-performance compute platforms and AI-driven autonomous driving technologies to strengthen its market position.
Synopsys, Inc.: EDA Software Innovator
Synopsys leads in electronic design automation software, enabling the design and testing of integrated circuits. The company’s revenue stems mainly from software platforms for digital design, verification, and FPGA prototyping. Its 2026 strategy prioritizes expanding IP solutions and security testing services across diverse industrial sectors.
Strategic Collision: Similarities & Divergences
Intel and Synopsys share a technology-led philosophy but diverge fundamentally: Intel controls hardware production, while Synopsys focuses on open software infrastructure. They primarily compete in the semiconductor innovation pipeline, Intel on chips and compute, Synopsys on design tools. Their distinct models offer investors contrasting exposure—Intel to capital-intensive manufacturing, Synopsys to scalable software solutions.
Income Statement Comparison
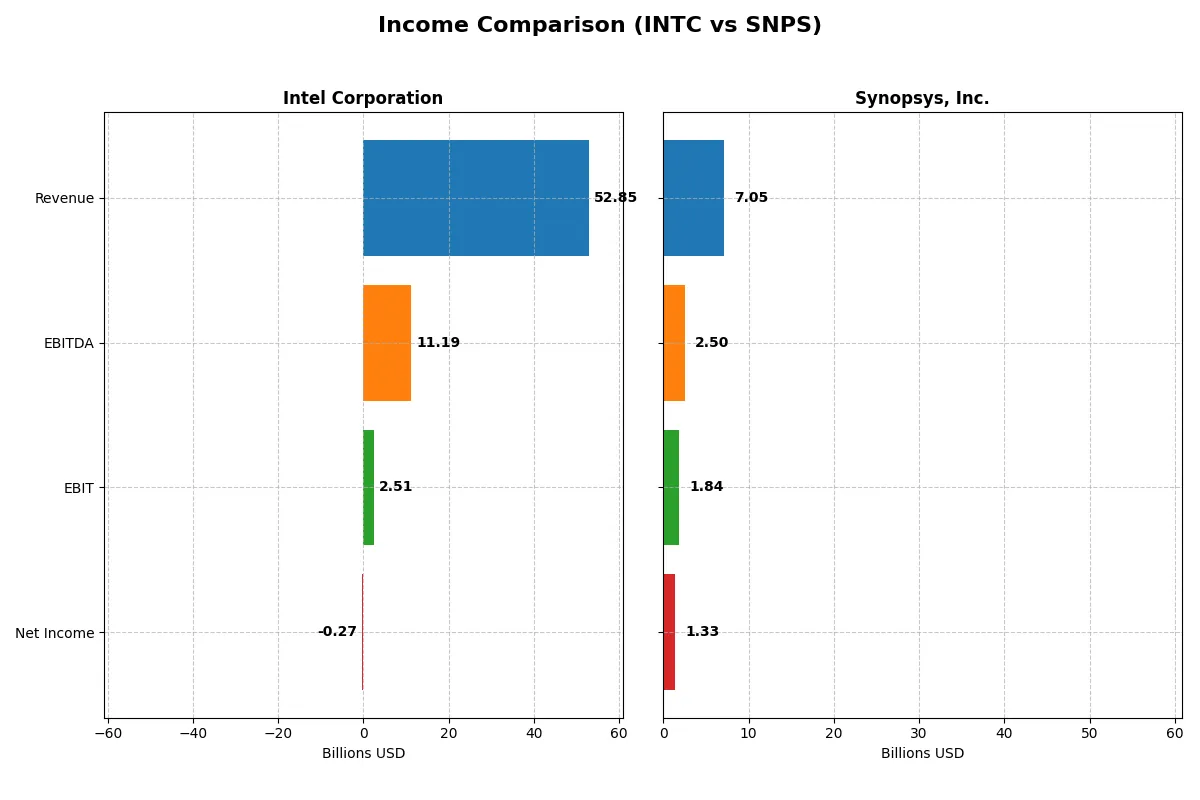
This data dissects the core profitability and scalability of both corporate engines to reveal who dominates the bottom line:
| Metric | Intel Corporation (INTC) | Synopsys, Inc. (SNPS) |
|---|---|---|
| Revenue | 52.9B | 7.1B |
| Cost of Revenue | 34.4B | 1.6B |
| Operating Expenses | 20.6B | 4.5B |
| Gross Profit | 18.5B | 5.4B |
| EBITDA | 11.2B | 2.5B |
| EBIT | 2.5B | 1.8B |
| Interest Expense | 953M | 447M |
| Net Income | -267M | 1.3B |
| EPS | -0.08 | 8.13 |
| Fiscal Year | 2025 | 2025 |
Income Statement Analysis: The Bottom-Line Duel
This income statement comparison reveals which company runs its business more efficiently and sustains profitability under current market conditions.
Intel Corporation Analysis
Intel’s revenue declined modestly to $52.9B in 2025, down from $53.1B in 2024, reflecting a challenging revenue environment. Gross margin remains solid at 35%, showing resilience despite top-line pressure. However, net income turned negative at -$267M, signaling operational struggles and margin compression. The company shows signs of improved EBIT margin momentum, up to 4.75%, reflecting some operational cost management.
Synopsys, Inc. Analysis
Synopsys posted strong revenue growth of 15.1% to $7.05B in 2025, demonstrating robust demand and expansion. Its gross margin is exceptionally high at 77%, highlighting a powerful competitive moat. EBIT margin stands at a healthy 26%, illustrating operational efficiency. Despite a recent dip in net margin growth, the company delivered $1.33B net income, underscoring strong profitability and effective capital allocation.
Margin Strength vs. Revenue Scale
Synopsys outperforms Intel in margin quality and consistent revenue growth, boasting superior profitability and expanding its moat. Intel, while showing some margin recovery, faces declining revenues and net losses that weigh heavily on its bottom line. For investors, Synopsys presents a growth and margin profile better aligned with durable earnings and capital efficiency.
Financial Ratios Comparison
These vital ratios act as a diagnostic tool to expose the underlying fiscal health, valuation premiums, and capital efficiency of the companies analyzed:
| Ratios | Intel Corporation (INTC) | Synopsys, Inc. (SNPS) |
|---|---|---|
| ROE | -0.23% | 4.70% |
| ROIC | -0.02% | 1.97% |
| P/E | -658.4 | 54.6 |
| P/B | 1.54 | 2.57 |
| Current Ratio | 2.02 | 1.62 |
| Quick Ratio | 1.65 | 1.52 |
| D/E | 0.41 | 0.50 |
| Debt-to-Assets | 22.0% | 29.6% |
| Interest Coverage | -2.23 | 2.05 |
| Asset Turnover | 0.25 | 0.15 |
| Fixed Asset Turnover | 0.50 | 5.04 |
| Payout ratio | 0 | 0 |
| Dividend yield | 0 | 0 |
| Fiscal Year | 2025 | 2025 |
Efficiency & Valuation Duel: The Vital Signs
Ratios serve as a company’s financial DNA, exposing hidden risks and highlighting operational strengths critical for investment decisions.
Intel Corporation
Intel displays weak profitability with negative ROE and net margins, signaling operational challenges. Its valuation appears stretched, reflected by a negative P/E. The company maintains a solid current ratio and low debt levels, offering some financial stability. Intel does not pay dividends, instead reinvesting heavily in R&D to fuel future growth.
Synopsys, Inc.
Synopsys shows healthier profitability with a positive net margin, though ROE and ROIC remain subdued. The stock trades at a high P/E, indicating premium valuation. Synopsys sustains good liquidity ratios and moderate debt. It also opts against dividends, focusing on R&D investment to support innovation and long-term expansion.
Premium Valuation vs. Operational Stability
Synopsys balances profitability and liquidity with a premium valuation, while Intel struggles with returns but exhibits financial prudence. Investors seeking operational stability might prefer Intel’s conservative profile. Those favoring growth potential and willingness to pay up could consider Synopsys’s innovation-driven approach.
Which one offers the Superior Shareholder Reward?
I compare Intel Corporation (INTC) and Synopsys, Inc. (SNPS) on shareholder rewards through dividends and buybacks. Intel offers a modest 1.84% dividend yield in 2025 but struggles with negative free cash flow (-1B) and no recent buybacks. Synopsys pays no dividends but generates robust free cash flow (8.4B) supporting aggressive buybacks, enhancing total return. Intel’s dividend payout looks vulnerable given weak profit margins and cash flow deficits. Synopsys reinvests via buybacks and maintains superior profitability (19% net margin), signaling a more sustainable and rewarding model. I favor Synopsys for 2026 total shareholder return due to its capital allocation strength and growth focus.
Comparative Score Analysis: The Strategic Profile
The radar chart reveals the fundamental DNA and trade-offs of Intel Corporation and Synopsys, Inc., highlighting their core financial strengths and weaknesses:
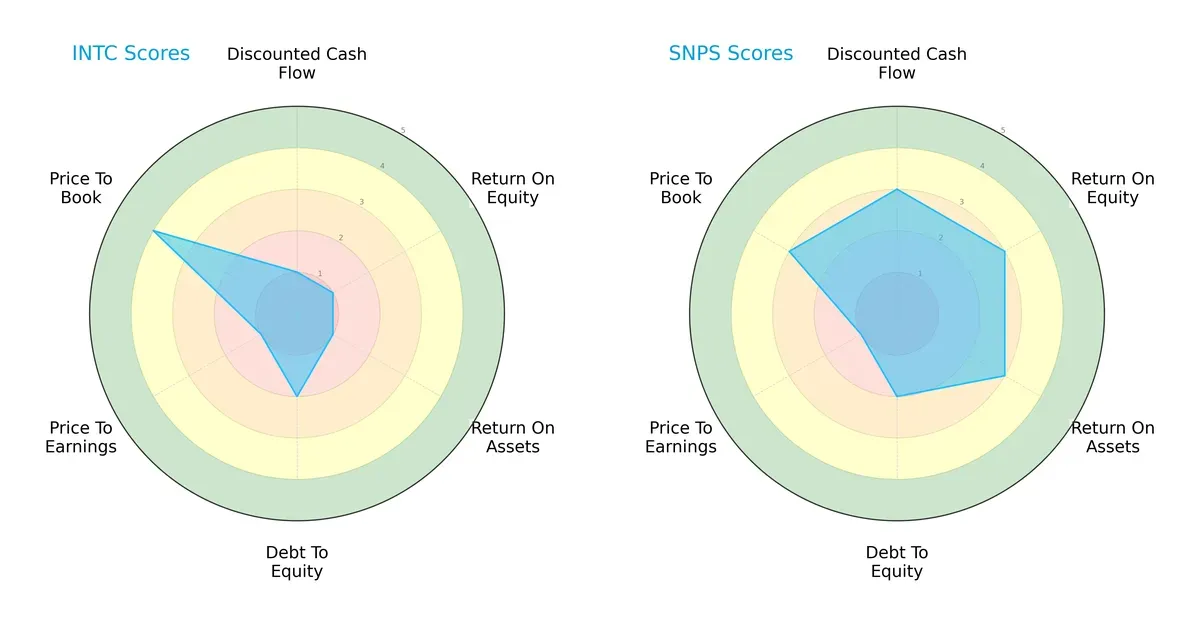
Synopsys shows a more balanced profile with moderate scores across DCF, ROE, ROA, and Debt/Equity, indicating steady operational efficiency and valuation discipline. Intel leans heavily on its Price-to-Book strength but suffers from very low scores in cash flow generation and profitability metrics, signaling reliance on book value rather than earnings quality.
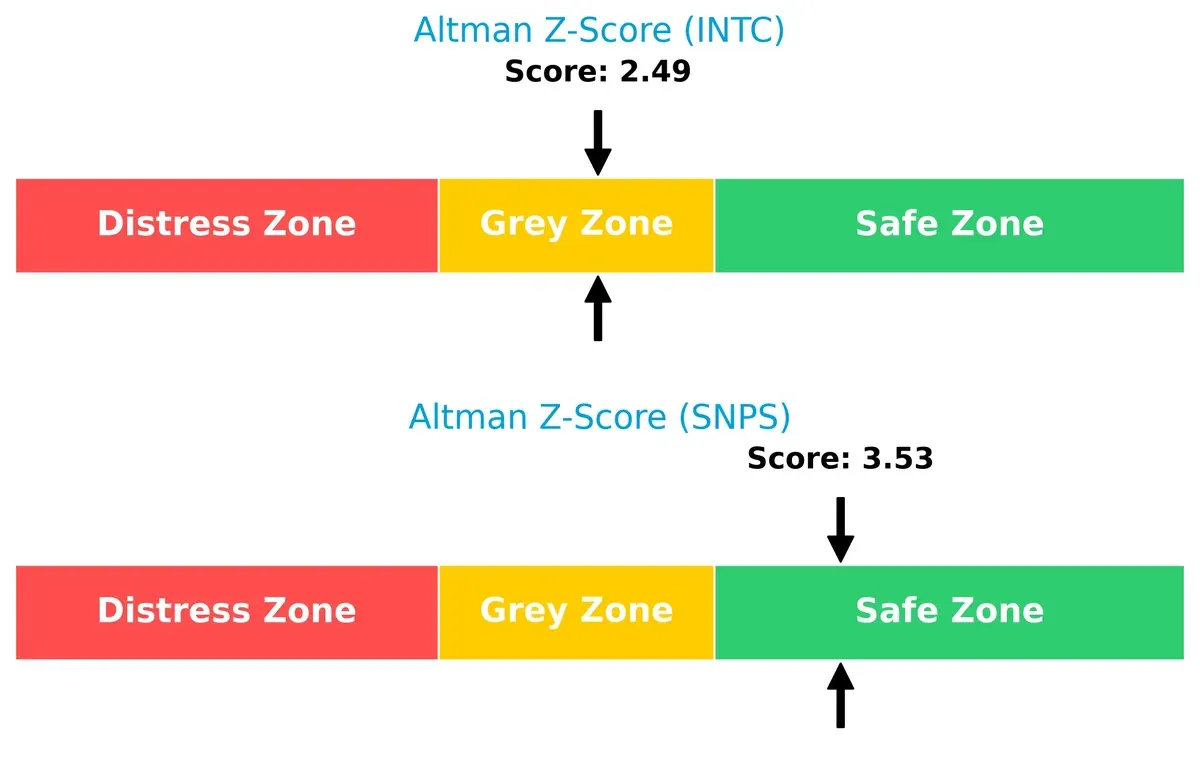
Bankruptcy Risk: Solvency Showdown
Synopsys’s Altman Z-Score places it safely above distress thresholds, suggesting robust solvency and lower bankruptcy risk. Intel’s score in the grey zone raises caution for long-term survival under economic stress:
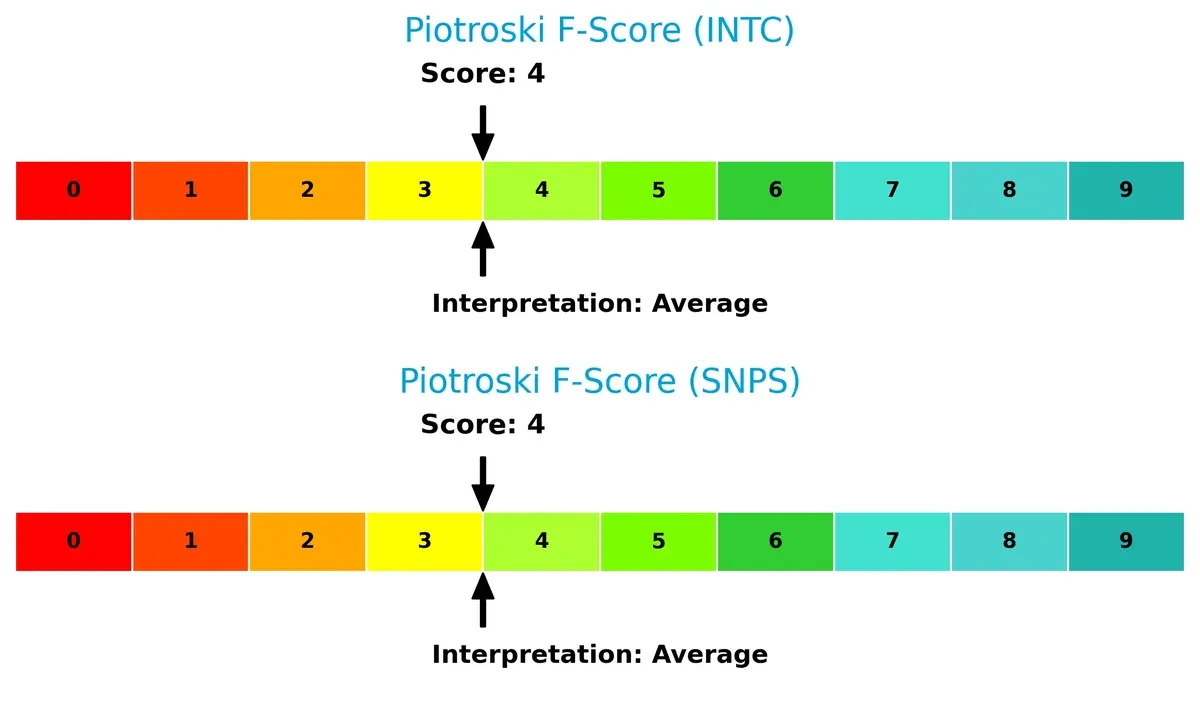
Financial Health: Quality of Operations
Both companies share an average Piotroski F-Score of 4, indicating moderate financial health. Neither shows peak strength nor severe red flags, but their operational quality leaves room for improvement:
How are the two companies positioned?
This section dissects Intel and Synopsys’s operational DNA by comparing their revenue distribution and internal strengths and weaknesses. The goal is to confront their economic moats to identify which model offers the most resilient, sustainable competitive advantage today.
Revenue Segmentation: The Strategic Mix
This visual comparison dissects how Intel Corporation and Synopsys, Inc. diversify their income streams and where their primary sector bets lie:
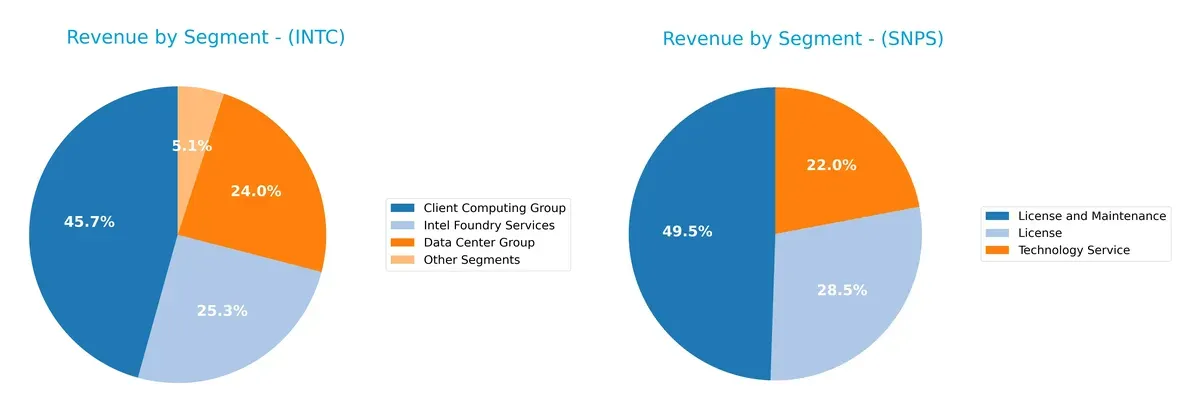
Intel’s revenue pivots on three major segments: Client Computing Group at $32.2B, Intel Foundry Services at $17.8B, and Data Center Group at $16.9B. This mix shows moderate diversification but anchors heavily in computing and foundry services. Synopsys leans on License and Maintenance ($3.5B) and License ($2.0B), with Technology Service ($1.6B) as a smaller stream, reflecting a focused software licensing model. Intel faces concentration risk in hardware, while Synopsys benefits from a stable, recurring revenue ecosystem.
Strengths and Weaknesses Comparison
This table compares the Strengths and Weaknesses of Intel Corporation and Synopsys, Inc.:
Intel Corporation Strengths
- Diverse revenue streams across computing, data center, foundry, and IoT segments
- Strong current and quick ratios indicating liquidity
- Conservative leverage with favorable debt to assets ratio
- Significant global presence including US, Singapore, Taiwan
Synopsys, Inc. Strengths
- Favorable net margin reflecting profitability
- Favorable fixed asset turnover showing efficient asset use
- Solid current and quick ratios for liquidity
- Geographic diversification led by US and Asia markets
Intel Corporation Weaknesses
- Negative net margin, ROE, and ROIC indicating profitability challenges
- Unfavorable asset turnover ratios suggesting operational inefficiency
- Zero dividend yield may deter income-focused investors
- High intersegment eliminations complicate revenue clarity
Synopsys, Inc. Weaknesses
- Moderate ROE and ROIC below cost of capital
- Unfavorable P/E ratio reflecting market valuation concerns
- Lower asset turnover impacting operational efficiency
- Zero dividend yield limits shareholder income
Intel shows broad diversification and strong liquidity but struggles with profitability and operational efficiency. Synopsys delivers better profit margins and asset use yet has valuation and return on capital pressures. Both companies face zero dividend yield, impacting income investor appeal.
The Moat Duel: Analyzing Competitive Defensibility
A structural moat shields long-term profits from relentless competition erosion. Let’s dissect how Intel and Synopsys defend their economic value:
Intel Corporation: Scale and Manufacturing Prowess Moat
Intel leverages cost advantage through massive scale and in-house chip manufacturing. Its margin stability falters with negative net margins in 2025, signaling pressure. Expansion into AI and autonomous driving may deepen its moat if execution improves.
Synopsys, Inc.: Intellectual Property & Software Ecosystem Moat
Synopsys defends with intangible assets—strong IP and software platforms creating high switching costs. It commands robust margins, with a 26% EBIT margin outpacing Intel. Continued innovation in electronic design automation sustains its moat amid tech shifts.
Verdict: Scale Advantages vs. IP Dominance
Both companies face shrinking ROIC and value destruction, but Synopsys boasts stronger margin profiles and software lock-in. I see Synopsys holding a deeper moat, better equipped to defend its market share in 2026’s competitive landscape.
Which stock offers better returns?
The past year saw Intel’s stock gain 5.61%, showing steady acceleration, while Synopsys declined 18.58%, despite recent signs of recovery from late 2025 to early 2026.
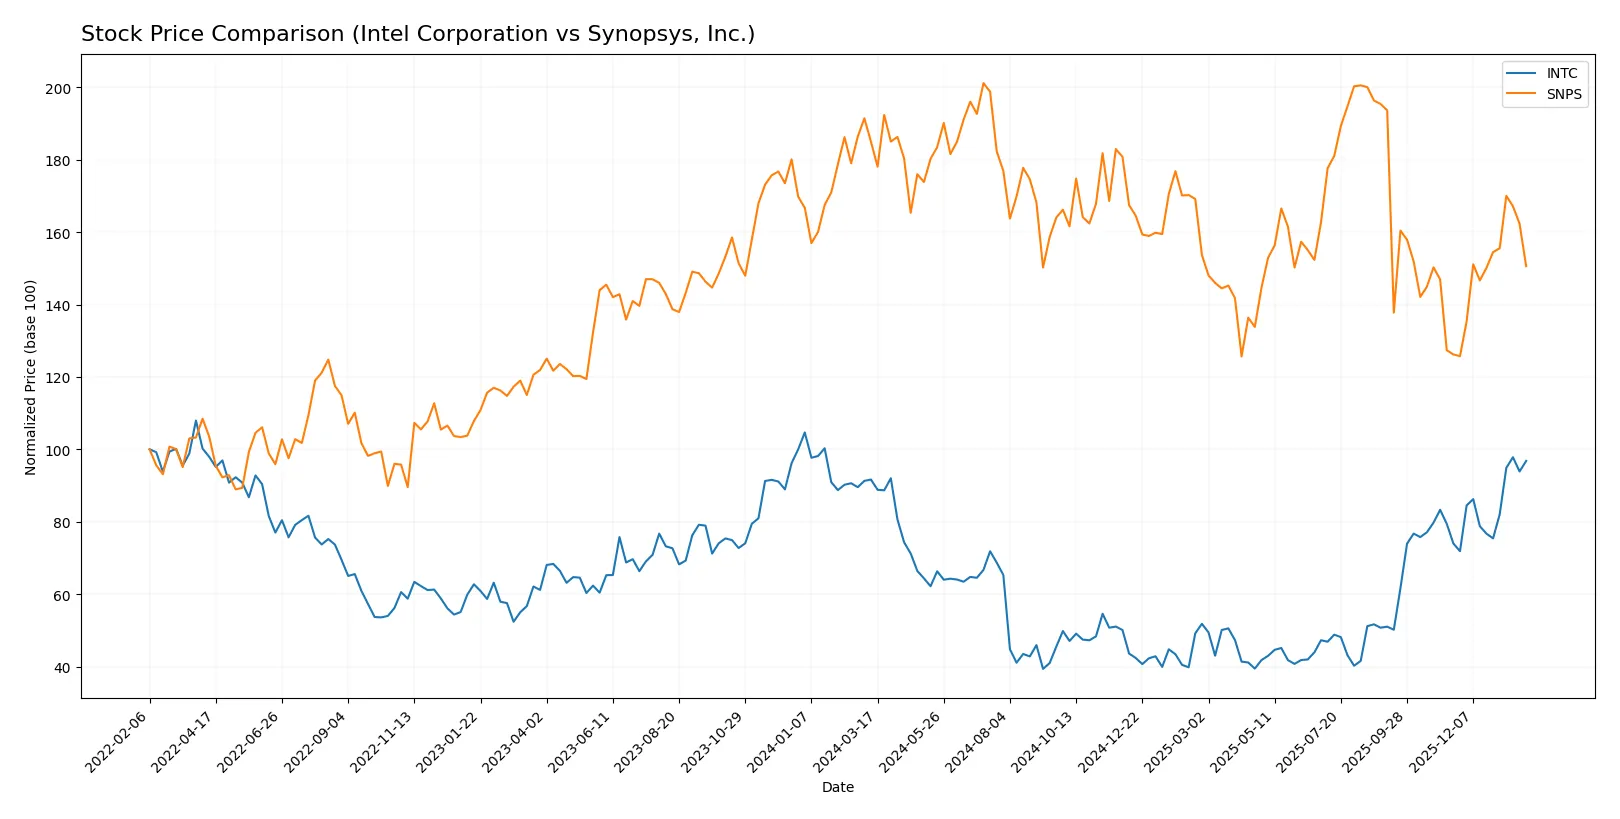
Trend Comparison
Intel’s stock rose 5.61% over the past 12 months, marking a bullish trend with accelerating momentum and moderate volatility of 8.11%. Its price ranged from 18.89 to 46.96.
Synopsys experienced an 18.58% decline over the same period, reflecting a bearish trend with sharp acceleration and high volatility at 58.25%. The recent rebound gained 19.31%.
Intel’s bullish trajectory outperformed Synopsys’s bearish trend, delivering stronger market returns despite Synopsys’s recent partial recovery.
Target Prices
Analysts present a wide but actionable target consensus for Intel Corporation and Synopsys, Inc.
| Company | Target Low | Target High | Consensus |
|---|---|---|---|
| Intel Corporation | 20 | 66 | 46.95 |
| Synopsys, Inc. | 425 | 600 | 530 |
Intel’s target consensus at $46.95 closely matches its current price of $46.47, signaling a balanced risk-reward profile. Synopsys shows strong upside potential, with consensus targets about 14% above the current $465 price.

Don’t Let Luck Decide Your Entry Point
Optimize your entry points with our advanced ProRealTime indicators. You’ll get efficient buy signals with precise price targets for maximum performance. Start outperforming now!
How do institutions grade them?
Here is a comparison of institutional grades for Intel Corporation and Synopsys, Inc.:
Intel Corporation Grades
The following table summarizes recent grades from reputable grading companies for Intel Corporation:
| Grading Company | Action | New Grade | Date |
|---|---|---|---|
| RBC Capital | Maintain | Sector Perform | 2026-01-23 |
| Keybanc | Maintain | Overweight | 2026-01-23 |
| Evercore ISI Group | Maintain | In Line | 2026-01-23 |
| Needham | Maintain | Hold | 2026-01-23 |
| Benchmark | Maintain | Buy | 2026-01-23 |
| Rosenblatt | Maintain | Sell | 2026-01-23 |
| UBS | Maintain | Neutral | 2026-01-23 |
| Citigroup | Maintain | Neutral | 2026-01-23 |
| Stifel | Maintain | Hold | 2026-01-23 |
| Wedbush | Maintain | Neutral | 2026-01-23 |
Synopsys, Inc. Grades
The following table summarizes recent grades from reputable grading companies for Synopsys, Inc.:
| Grading Company | Action | New Grade | Date |
|---|---|---|---|
| Piper Sandler | Downgrade | Neutral | 2026-01-13 |
| Morgan Stanley | Maintain | Overweight | 2025-12-12 |
| B of A Securities | Upgrade | Buy | 2025-12-11 |
| Rosenblatt | Maintain | Buy | 2025-12-11 |
| Piper Sandler | Maintain | Overweight | 2025-12-11 |
| Keybanc | Maintain | Overweight | 2025-12-11 |
| JP Morgan | Maintain | Overweight | 2025-12-11 |
| Wells Fargo | Maintain | Equal Weight | 2025-12-11 |
| Needham | Maintain | Buy | 2025-12-11 |
| Rosenblatt | Upgrade | Buy | 2025-12-09 |
Which company has the best grades?
Synopsys, Inc. generally receives more positive grades, including multiple “Buy” and “Overweight” ratings. Intel’s grades cluster around “Hold” and “Neutral,” with some divergence. Better grades for Synopsys may attract investors seeking stronger analyst conviction.
Risks specific to each company
The following categories identify critical pressure points and systemic threats facing Intel Corporation and Synopsys, Inc. in the 2026 market environment:
1. Market & Competition
Intel Corporation
- Faces fierce competition in semiconductors from AMD, Nvidia, and TSMC, pressuring margins and market share.
Synopsys, Inc.
- Competes in software infrastructure with Cadence and Mentor Graphics, relying on sustained innovation in EDA tools.
2. Capital Structure & Debt
Intel Corporation
- Maintains moderate leverage (D/E 0.41), manageable interest coverage (2.63), but with slightly unfavorable returns on capital.
Synopsys, Inc.
- Holds slightly higher leverage (D/E 0.5) but better interest coverage (4.12), supporting stable financial flexibility.
3. Stock Volatility
Intel Corporation
- Exhibits higher beta (1.35), indicating greater sensitivity to market swings and sector cyclicality.
Synopsys, Inc.
- Shows lower beta (1.12), reflecting more stable price movements amid tech sector volatility.
4. Regulatory & Legal
Intel Corporation
- Subject to global trade restrictions and antitrust scrutiny in semiconductor manufacturing.
Synopsys, Inc.
- Faces regulatory risks related to software export controls and IP protection in multiple jurisdictions.
5. Supply Chain & Operations
Intel Corporation
- Vulnerable to semiconductor fabrication delays, high capital expenditure, and raw material price volatility.
Synopsys, Inc.
- Relies on software development and licensing; less exposed to physical supply chain disruptions.
6. ESG & Climate Transition
Intel Corporation
- Under pressure to reduce carbon footprint and water usage amid intensive manufacturing processes.
Synopsys, Inc.
- Faces moderate ESG risks, primarily related to software energy efficiency and data privacy concerns.
7. Geopolitical Exposure
Intel Corporation
- High exposure to US-China tensions affecting chip exports and investments.
Synopsys, Inc.
- Geopolitical risk lower but present via global software sales and collaboration restrictions.
Which company shows a better risk-adjusted profile?
Intel’s most impactful risk is operational complexity and capital-intensive manufacturing amid fierce competition. Synopsys’s key risk lies in sustaining innovation and managing regulatory pressures on software exports. Synopsys exhibits a better risk-adjusted profile, supported by a stronger Altman Z-score (3.53 safe zone vs. Intel’s 2.49 grey zone) and more stable financial metrics. Intel’s negative net margin and returns signal caution despite its market leadership.
Final Verdict: Which stock to choose?
Intel Corporation’s superpower lies in its solid liquidity and capital structure, providing a stable financial foundation amid industry volatility. However, its value destruction trend and declining profitability remain points of vigilance. Intel suits investors with an appetite for turnaround stories and aggressive growth seeking potential rebounds.
Synopsys, Inc. boasts a strategic moat in its software dominance and recurring revenue streams, delivering consistent income quality and a safer balance sheet than Intel. Despite a premium valuation, its robust margins and safer financial profile fit well with Growth at a Reasonable Price (GARP) investors prioritizing steady expansion over speculation.
If you prioritize turnaround potential and liquidity strength, Intel offers a compelling scenario due to its capital stability despite profitability headwinds. However, if you seek a more stable growth trajectory and recurring revenue moat, Synopsys outshines Intel by combining software dominance with better financial safety, albeit at a higher valuation.
Disclaimer: Investment carries a risk of loss of initial capital. The past performance is not a reliable indicator of future results. Be sure to understand risks before making an investment decision.
Go Further
I encourage you to read the complete analyses of Intel Corporation and Synopsys, Inc. to enhance your investment decisions: