Home > Comparison > Technology > INTC vs STM
The strategic rivalry between Intel Corporation and STMicroelectronics N.V. defines the current trajectory of the global semiconductor industry. Intel, a dominant U.S.-based chip designer and manufacturer, contrasts with STMicroelectronics, a diversified European semiconductor supplier focusing on automotive and industrial applications. This head-to-head highlights a battle between scale-driven platform innovation and specialized analog and sensor solutions. This analysis aims to identify which corporate path offers superior risk-adjusted returns for a diversified portfolio in 2026.
Table of contents
Companies Overview
Intel Corporation and STMicroelectronics N.V. are key players shaping the global semiconductor industry.
Intel Corporation: Global Chip Powerhouse
Intel dominates as a leading semiconductor designer and manufacturer. It generates revenue primarily from central processing units, chipsets, and advanced compute solutions across data centers, AI, and autonomous driving sectors. In 2026, Intel sharpens its strategic focus on high-performance computing and AI-driven platforms, targeting cloud providers and embedded verticals to maintain its competitive edge.
STMicroelectronics N.V.: European Analog and Automotive Specialist
STMicroelectronics excels in analog, MEMS, and automotive integrated circuits. Its revenue stems from industrial ASICs, power transistors, sensors, and microcontrollers serving automotive, industrial, and consumer markets. The company’s 2026 strategy prioritizes innovation in power-efficient solutions and connectivity products, strengthening its foothold in automotive electronics and industrial applications worldwide.
Strategic Collision: Similarities & Divergences
Intel and STMicroelectronics both innovate in semiconductors but differ in scope and approach. Intel pursues a platform-centric model with emphasis on compute power and AI, while STMicroelectronics adopts a component-focused strategy targeting analog and embedded systems. Their primary battle unfolds in automotive and industrial markets. Intel’s scale contrasts with ST’s niche specialization, offering distinct investment profiles defined by scale versus focused innovation.
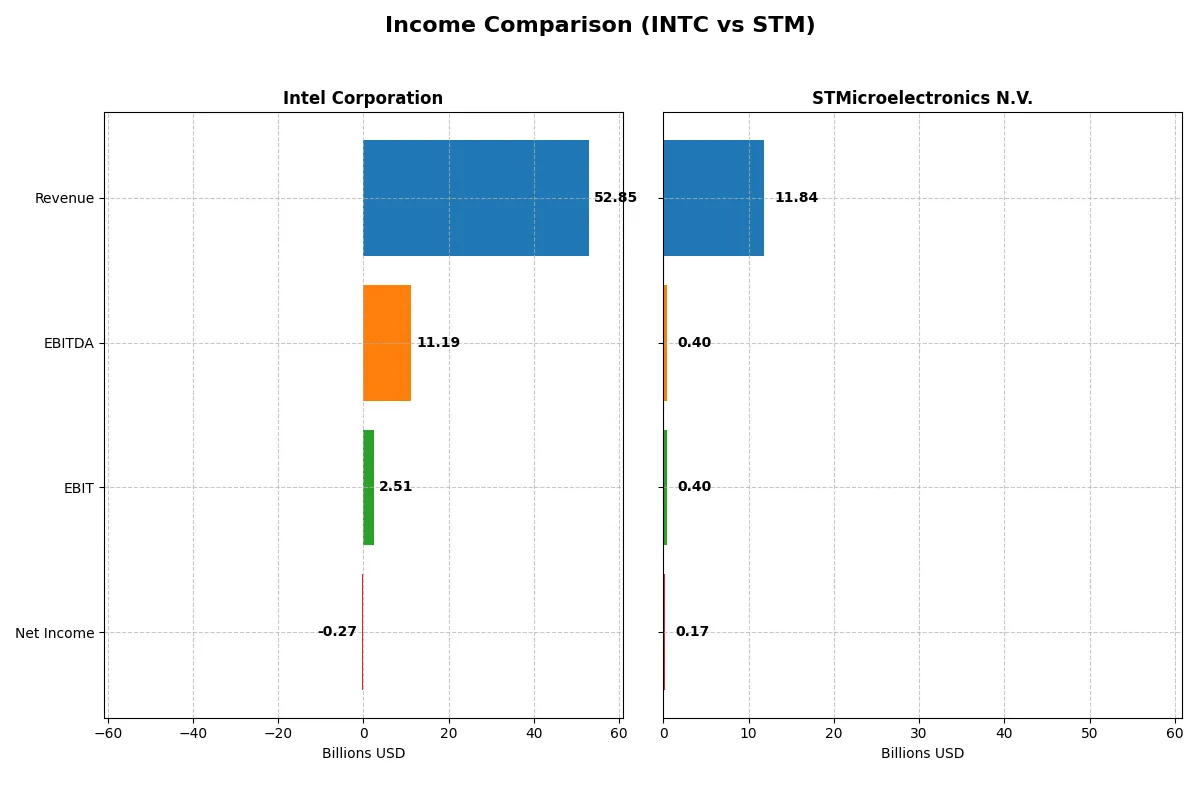
Income Statement Comparison
This data dissects the core profitability and scalability of both corporate engines to reveal who dominates the bottom line:
| Metric | Intel Corporation (INTC) | STMicroelectronics N.V. (STM) |
|---|---|---|
| Revenue | 52.9B | 11.8B |
| Cost of Revenue | 34.4B | 7.8B |
| Operating Expenses | 20.6B | 3.7B |
| Gross Profit | 18.5B | 4.0B |
| EBITDA | 11.2B | 0.4B |
| EBIT | 2.5B | 0.4B |
| Interest Expense | 953M | 0 |
| Net Income | -267M | 0 |
| EPS | -0.08 | 0.19 |
| Fiscal Year | 2025 | 2025 |
Income Statement Analysis: The Bottom-Line Duel
This income statement comparison exposes the true efficiency and profitability dynamics of Intel Corporation and STMicroelectronics N.V. over recent years.
Intel Corporation Analysis
Intel’s revenue declined by 0.47% in 2025, continuing a downtrend since 2021. Gross profit expanded 6.5%, reflecting improved cost control despite top-line pressure. The net income swung negative at -$267M in 2025, eroding net margins to -0.51%. Yet, EBIT growth surged 125%, signaling operational recovery momentum amid restructuring challenges.
STMicroelectronics N.V. Analysis
STMicroelectronics’ revenue fell 10.8% in 2025, with gross profit contracting 23.1%, marking deteriorating margin health. Net income dropped sharply to $167M, compressing net margin to 1.41%. EBIT plunged nearly 80%, indicating weakening operating efficiency. The company faces sustained pressure, with negative growth trends dominating its recent financial profile.
Margin Power vs. Revenue Scale
Intel demonstrates stronger margin resilience and operational improvement despite revenue declines, while STMicroelectronics suffers from steeper margin erosion and profitability contraction. Intel’s scale and improving EBIT mark it as the fundamental winner, appealing more to investors valuing margin recovery and operational leverage.
Financial Ratios Comparison
These vital ratios act as a diagnostic tool to expose the underlying fiscal health, valuation premiums, and capital efficiency of the companies compared below:
| Ratios | Intel Corporation (INTC) | STMicroelectronics N.V. (STM) |
|---|---|---|
| ROE | -0.23% | 0.93% |
| ROIC | -0.02% | 0.67% |
| P/E | -658.38 | 0 (no positive earnings) |
| P/B | 1.54 | 0 |
| Current Ratio | 2.02 | 3.36 |
| Quick Ratio | 1.65 | 2.43 |
| D/E | 0.41 | 0.12 |
| Debt-to-Assets | 22.0% | 8.6% |
| Interest Coverage | -2.23 | 0 (no interest expense) |
| Asset Turnover | 0.25 | 0.48 |
| Fixed Asset Turnover | 0.50 | 1.07 |
| Payout ratio | 0% | 0% |
| Dividend yield | 0% | 0% |
| Fiscal Year | 2025 | 2025 |
Efficiency & Valuation Duel: The Vital Signs
Financial ratios serve as a company’s DNA, exposing hidden risks and showcasing operational strengths that numbers alone cannot reveal.
Intel Corporation
Intel displays negative core profitability with ROE at -0.23% and net margin at -0.51%, signaling operational challenges. Its P/E ratio appears favorable due to negative earnings, but this reflects earnings distress rather than undervaluation. Intel maintains a strong current ratio (2.02) and reinvests heavily in R&D (26% of revenue), foregoing dividends.
STMicroelectronics N.V.
STMicroelectronics posts low but positive profitability: ROE at 0.93% and net margin at 1.41%, indicating modest efficiency. Its valuation metrics are favorable, with P/E and P/B ratios showing no red flags. The company has a high current ratio (3.36) and focuses on growth through R&D (17% of revenue), also paying no dividends.
Balanced Valuation vs. Operational Struggles
STMicroelectronics offers a more balanced risk profile with modest profitability and favorable valuation, while Intel shows operational weakness despite solid liquidity. Investors seeking stability may lean toward ST’s modest growth, whereas Intel’s profile suggests a turnaround play with higher risk.
Which one offers the Superior Shareholder Reward?
Intel Corporation (INTC) currently suspends dividends with a 0% yield and a negative free cash flow of -$1B in 2025, reflecting operational challenges and a halt in payout. Its buyback activity seems minimal given the cash flow constraints. STMicroelectronics (STM) pays a modest dividend yield of 1.28% in 2024, with a very low payout ratio of 18%, signaling a conservative but sustainable distribution. STM also maintains positive free cash flow, supporting ongoing dividends and steady buybacks. I find STM’s balanced dividend and buyback strategy offers a more sustainable and attractive total return profile for 2026 investors.
Comparative Score Analysis: The Strategic Profile
The radar chart reveals the fundamental DNA and trade-offs of Intel Corporation and STMicroelectronics N.V., highlighting their distinct strategic strengths and weaknesses:
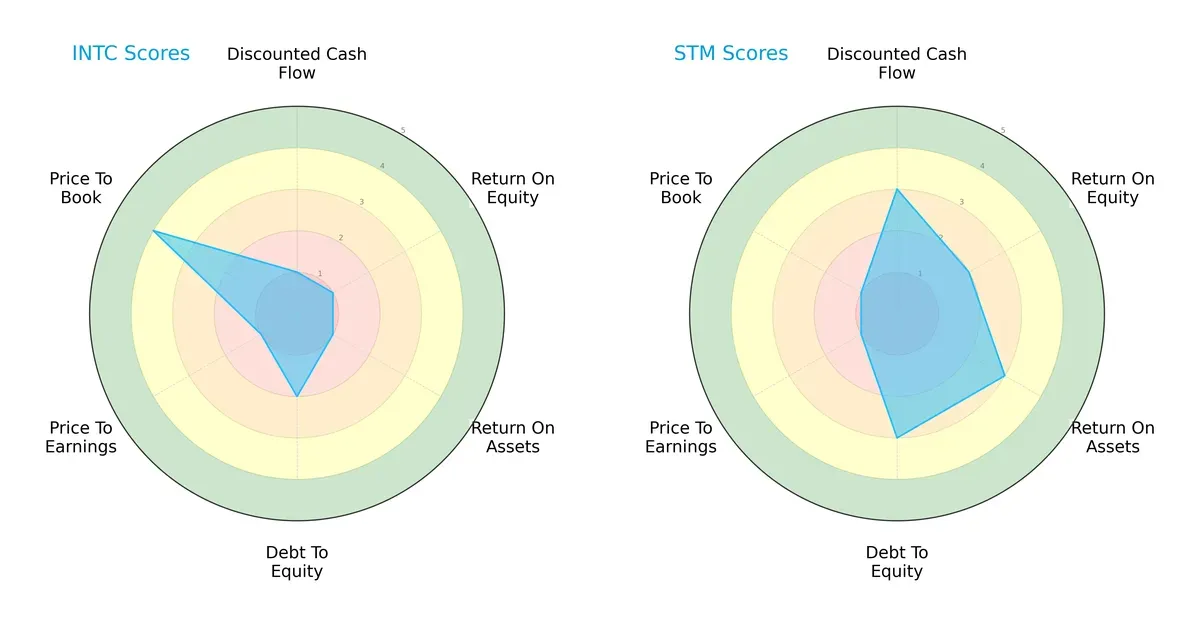
Intel suffers from very weak profitability metrics with DCF, ROE, and ROA scores all at 1, signaling operational challenges. Its debt profile is moderate (score 2), but valuation metrics show a mixed picture—very favorable P/B at 4 but very unfavorable P/E at 1. Conversely, STM displays more balance: moderate DCF (3), ROE (2), ROA (3), and debt-to-equity (3) scores, though both firms share poor valuation scores (P/E and P/B at 1). STM’s diversified strengths suggest a healthier operational footing, while Intel relies heavily on asset valuation for support.
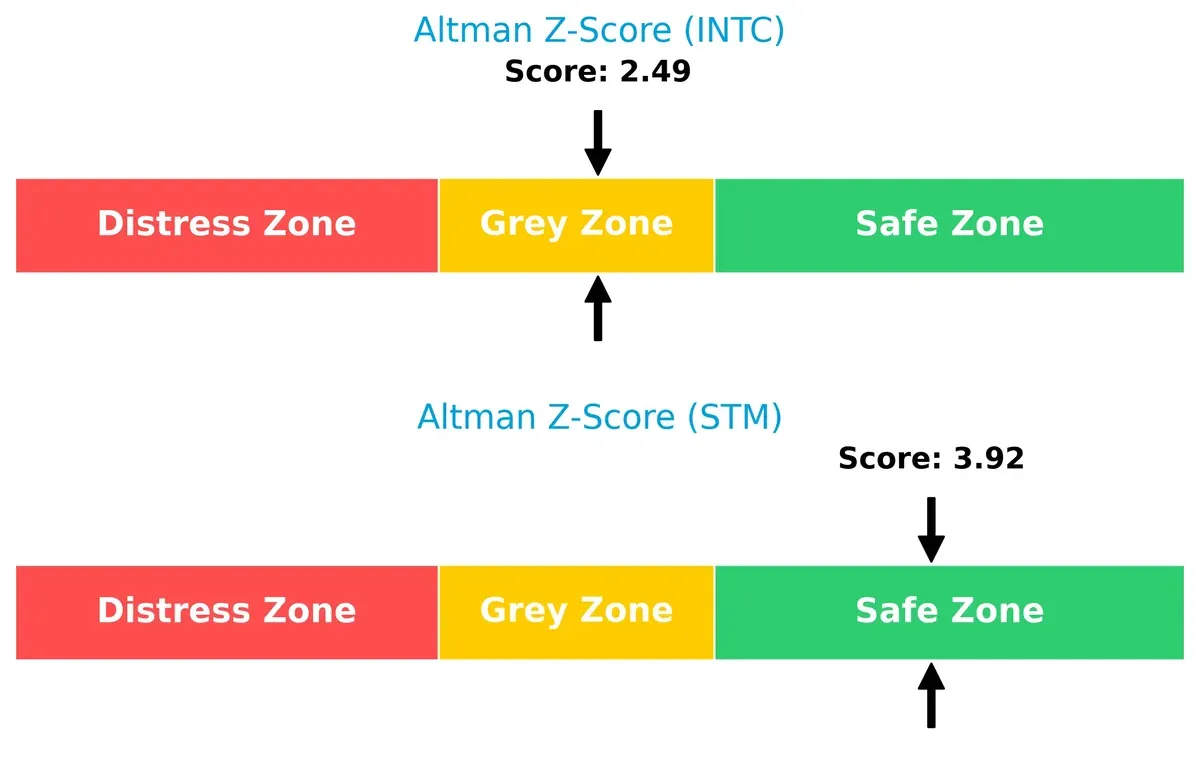
Bankruptcy Risk: Solvency Showdown
Intel’s Altman Z-Score stands at 2.49 (grey zone), while STM boasts a safer 3.92 (safe zone). This gap signals STM’s stronger resilience to economic stress and lower bankruptcy risk in the current cycle:
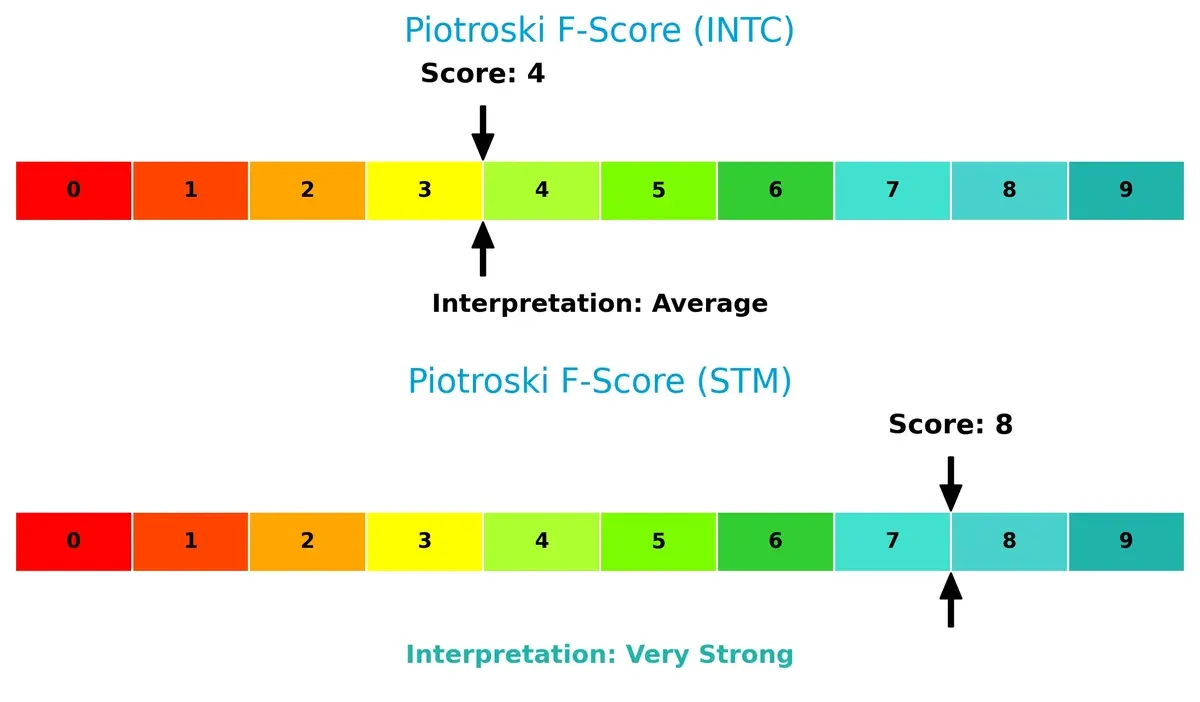
Financial Health: Quality of Operations
Intel’s Piotroski F-Score of 4 indicates average financial health with potential red flags in profitability and efficiency. STM’s robust 8 score signals very strong internal metrics and operational quality, highlighting a clear edge in financial strength:
How are the two companies positioned?
This section dissects the operational DNA of Intel and STMicroelectronics by comparing their revenue distribution by segment and internal dynamics. The goal is to confront their economic moats and identify which business model delivers the most resilient and sustainable competitive advantage today.
Revenue Segmentation: The Strategic Mix
The following visual comparison dissects how Intel Corporation and STMicroelectronics N.V. diversify their income streams and where their primary sector bets lie:
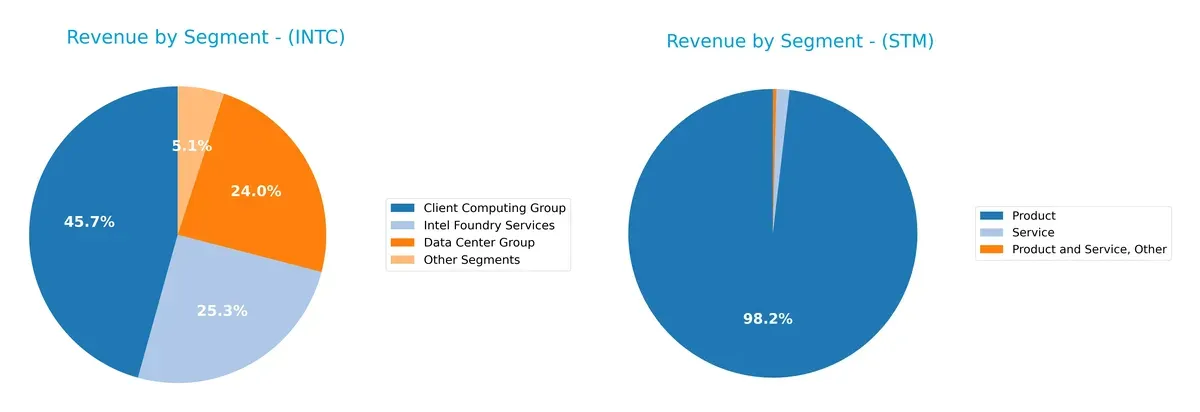
Intel pivots on its Client Computing Group with $32.2B, but also dwarfs competitors through its Intel Foundry Services at $17.8B and Data Center Group at $16.9B. This mix reveals a strong ecosystem lock-in with balanced infrastructure dominance. In contrast, STMicroelectronics relies heavily on a single Product segment at $13.2B, showing less diversification. This concentration risks exposure to product cycle fluctuations, limiting resilience compared to Intel’s broader portfolio.
Strengths and Weaknesses Comparison
This table compares the Strengths and Weaknesses of Intel Corporation and STMicroelectronics N.V.:
Intel Corporation Strengths
- Diversified segments including Client Computing and Foundry Services
- Strong global presence across US, Singapore, Taiwan
- Favorable liquidity ratios indicating financial stability
STMicroelectronics N.V. Strengths
- Diversified product and service offerings
- Favorable debt ratios and infinite interest coverage
- Global presence with strong Singapore and Switzerland exposure
Intel Corporation Weaknesses
- Negative profitability metrics: net margin, ROE, and ROIC
- Unfavorable asset turnover ratios
- Zero dividend yield
STMicroelectronics N.V. Weaknesses
- Low profitability despite positive net margin and ROIC
- Unfavorable asset turnover and elevated current ratio
- Zero dividend yield
Intel shows broad diversification and solid liquidity but suffers from weak profitability and efficiency. STM holds a neutral financial stance with better leverage metrics but struggles with profitability and asset use, highlighting areas for strategic focus.
The Moat Duel: Analyzing Competitive Defensibility
A structural moat is the only barrier that safeguards long-term profits from relentless competitive erosion. Let’s dissect the economic moats of two semiconductor giants:
Intel Corporation: Scale and Platform Integration Moat
Intel’s advantage stems from its massive scale and integrated chip manufacturing. High gross margins near 35% reveal operational leverage, but declining ROIC signals weakening efficiency. Expansion into AI and autonomous driving platforms could reinvigorate its moat if execution improves in 2026.
STMicroelectronics N.V.: Specialized Product Diversification Moat
STMicroelectronics relies on diversified analog, MEMS, and microcontroller products, contrasting Intel’s scale. Despite favorable gross margins, steep declines in revenue and profits highlight vulnerability. Its niche automotive and industrial focus offers growth potential if it navigates market disruptions successfully.
Scale and Integration vs. Specialized Diversification
Both companies exhibit very unfavorable ROIC trends, signaling value destruction amid intense industry pressure. Intel’s broader platform reach grants a wider moat, but ST’s specialization offers pockets of resilience. Intel remains better positioned to defend market share if it reverses profitability decline.
Which stock offers better returns?
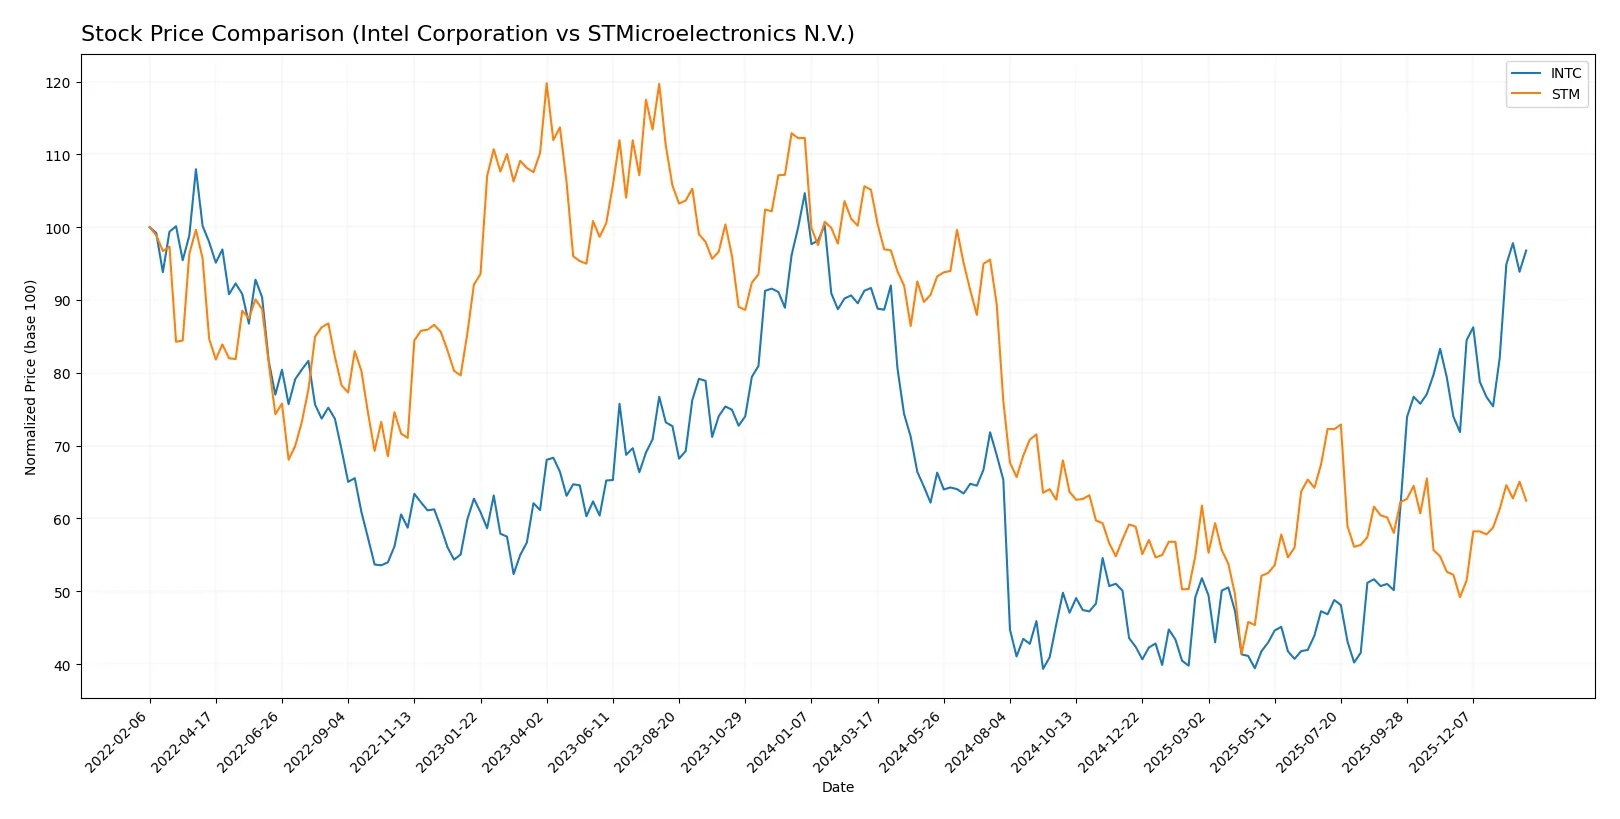
The past year shows Intel Corporation’s shares rising steadily with accelerating gains, while STMicroelectronics N.V. faced a sharp overall decline but recent partial recovery.
Trend Comparison
Intel’s stock gained 5.61% over the past year with accelerating bullish momentum, hitting a high of 46.96 and a low of 18.89, supported by high volatility (8.11 std deviation).
STMicroelectronics’ stock dropped 40.6% over the year, showing an accelerating bearish trend. Despite a recent 19.49% rebound, the decline remains significant with volatility at 6.77 std deviation.
Intel outperformed STMicroelectronics clearly, delivering positive market returns versus a steep overall decline for STM.
Target Prices
Analysts present a mixed but generally optimistic target price consensus for Intel Corporation and STMicroelectronics N.V.
| Company | Target Low | Target High | Consensus |
|---|---|---|---|
| Intel Corporation | 20 | 66 | 46.95 |
| STMicroelectronics N.V. | 28 | 45 | 37.67 |
Intel’s consensus target aligns closely with its current price of $46.47, indicating moderate upside potential. STMicroelectronics shows upside potential from its $27.89 price point, with a consensus near $37.67.

Don’t Let Luck Decide Your Entry Point
Optimize your entry points with our advanced ProRealTime indicators. You’ll get efficient buy signals with precise price targets for maximum performance. Start outperforming now!
How do institutions grade them?
Intel Corporation Grades
The following table summarizes recent institutional grades for Intel Corporation:
| Grading Company | Action | New Grade | Date |
|---|---|---|---|
| Intel Corporation | Maintain | Sector Perform | 2026-01-23 |
| Intel Corporation | Maintain | Overweight | 2026-01-23 |
| Intel Corporation | Maintain | In Line | 2026-01-23 |
| Intel Corporation | Maintain | Hold | 2026-01-23 |
| Intel Corporation | Maintain | Buy | 2026-01-23 |
| Intel Corporation | Maintain | Sell | 2026-01-23 |
| Intel Corporation | Maintain | Neutral | 2026-01-23 |
| Intel Corporation | Maintain | Neutral | 2026-01-23 |
| Intel Corporation | Maintain | Hold | 2026-01-23 |
| Intel Corporation | Maintain | Neutral | 2026-01-23 |
STMicroelectronics N.V. Grades
Below is a summary of recent grades for STMicroelectronics N.V.:
| Grading Company | Action | New Grade | Date |
|---|---|---|---|
| STMicroelectronics N.V. | Maintain | Buy | 2025-10-24 |
| STMicroelectronics N.V. | Maintain | Positive | 2025-10-22 |
| STMicroelectronics N.V. | Maintain | Positive | 2025-07-25 |
| STMicroelectronics N.V. | Upgrade | Outperform | 2025-07-22 |
| STMicroelectronics N.V. | Maintain | Positive | 2025-07-22 |
| STMicroelectronics N.V. | Upgrade | Buy | 2025-02-19 |
| STMicroelectronics N.V. | Downgrade | Market Perform | 2025-02-05 |
| STMicroelectronics N.V. | Maintain | Positive | 2025-01-31 |
| STMicroelectronics N.V. | Downgrade | Underweight | 2025-01-22 |
| STMicroelectronics N.V. | Downgrade | Neutral | 2024-12-09 |
Which company has the best grades?
STMicroelectronics N.V. generally holds more positive and upgrade actions with multiple “Buy” and “Positive” grades. Intel’s grades are more mixed, with a balance of “Hold,” “Neutral,” and some negative “Sell” indications. This may suggest STMicroelectronics has stronger recent analyst sentiment, potentially influencing investor confidence differently.
Risks specific to each company
The following categories identify the critical pressure points and systemic threats facing both firms in the 2026 market environment:
1. Market & Competition
Intel Corporation
- Faces intense competition from global semiconductor leaders, impacting profitability and market share.
STMicroelectronics N.V.
- Competes in diverse segments with strong European presence but smaller scale limits global reach.
2. Capital Structure & Debt
Intel Corporation
- Maintains moderate leverage with debt-to-assets at 22%, interest coverage is borderline at 2.63x.
STMicroelectronics N.V.
- Exhibits low leverage with debt-to-assets at 8.6%, and infinite interest coverage, reflecting strong financial stability.
3. Stock Volatility
Intel Corporation
- Beta of 1.35 signals above-market volatility; recent price swings stress investor caution.
STMicroelectronics N.V.
- Beta of 1.29 indicates slightly lower volatility but still sensitive to sector fluctuations.
4. Regulatory & Legal
Intel Corporation
- Subject to US tech regulations and export controls, increasing compliance risks.
STMicroelectronics N.V.
- Faces EU regulatory scrutiny and geopolitical trade tensions, adding complexity to operations.
5. Supply Chain & Operations
Intel Corporation
- Complex global supply chain vulnerable to geopolitical disruptions and manufacturing delays.
STMicroelectronics N.V.
- Strong focus on automotive and industrial, but supply chain exposed to semiconductor shortages.
6. ESG & Climate Transition
Intel Corporation
- Ongoing efforts to reduce carbon footprint; transition risks remain as energy-intensive fabs operate.
STMicroelectronics N.V.
- Advances in sustainable products and manufacturing, though long-term climate regulations may raise costs.
7. Geopolitical Exposure
Intel Corporation
- Heavily exposed to US-China tech tensions, risking supply chain and market access.
STMicroelectronics N.V.
- European base offers diversification, but global trade conflicts still pose risks.
Which company shows a better risk-adjusted profile?
Intel’s primary risk lies in its weak profitability and capital efficiency amid tough competition and regulatory pressures. STMicroelectronics faces lower leverage and stronger financial health but contends with supply chain constraints and valuation concerns. Overall, STM shows a better risk-adjusted profile supported by a safer Altman Z-Score (3.92 vs. 2.49) and a strong Piotroski score (8 vs. 4), reflecting superior financial stability and operational resilience in 2026.
Final Verdict: Which stock to choose?
Intel Corporation’s superpower lies in its formidable scale and operational resilience, driving consistent cash flow generation despite recent profitability challenges. The main point of vigilance is its declining return on invested capital, signaling potential value erosion. Intel fits well within a portfolio seeking aggressive growth with a tolerance for cyclical volatility.
STMicroelectronics N.V. boasts a strategic moat through diversified semiconductor exposure and a notably strong balance sheet, offering better financial stability than Intel. Its solid capital structure and higher Altman Z-Score profile it as a safer pick. STM suits investors focused on growth at a reasonable price with an appetite for steadier fundamentals.
If you prioritize aggressive growth potential and are comfortable navigating profitability headwinds, Intel outshines with its scale and recent operational improvements. However, if you seek better financial stability and a stronger margin of safety, STM offers superior balance sheet health and a more robust risk profile. Both present distinct analytical scenarios tailored to differing risk tolerances.
Disclaimer: Investment carries a risk of loss of initial capital. The past performance is not a reliable indicator of future results. Be sure to understand risks before making an investment decision.
Go Further
I encourage you to read the complete analyses of Intel Corporation and STMicroelectronics N.V. to enhance your investment decisions: