Home > Comparison > Technology > INTC vs SWKS
The strategic rivalry between Intel Corporation and Skyworks Solutions defines the current trajectory of the semiconductor industry. Intel, a capital-intensive giant, emphasizes diverse platform and adjacent product innovation. Skyworks, a specialized semiconductor designer, focuses on proprietary wireless analog and mixed-signal solutions. This analysis explores their contrasting operational models and growth strategies to identify which company offers a superior risk-adjusted return for a diversified technology portfolio.
Table of contents
Companies Overview
Intel Corporation and Skyworks Solutions dominate critical niches within the semiconductor industry, shaping global technology trends.
Intel Corporation: Semiconductor Giant with Diverse Platforms
Intel leads as a semiconductor powerhouse, generating revenue from CPUs, chipsets, and system-on-chip products. Its 2026 strategy emphasizes expanding high-performance compute solutions for cloud, enterprise, and autonomous driving markets. Intel leverages a broad product portfolio spanning traditional platforms and emerging adjacent technologies to maintain its competitive edge.
Skyworks Solutions, Inc.: Specialist in Analog and Mixed-Signal Semiconductors
Skyworks operates as a specialist in proprietary analog semiconductor components, focusing on amplifiers, filters, and front-end modules for wireless and broadband applications. In 2026, the company targets growth across automotive, industrial, and mobile sectors by innovating in connectivity and power management solutions, supporting diverse end markets from aerospace to wearables.
Strategic Collision: Similarities & Divergences
Both firms excel in semiconductor innovation, but Intel pursues a broad platform approach while Skyworks focuses on niche analog solutions. They battle mainly in wireless and connectivity markets where integration and performance dictate leadership. Intel offers scale and diversification, contrasting with Skyworks’ precision and specialization, defining distinct risk and reward profiles for investors.
Income Statement Comparison
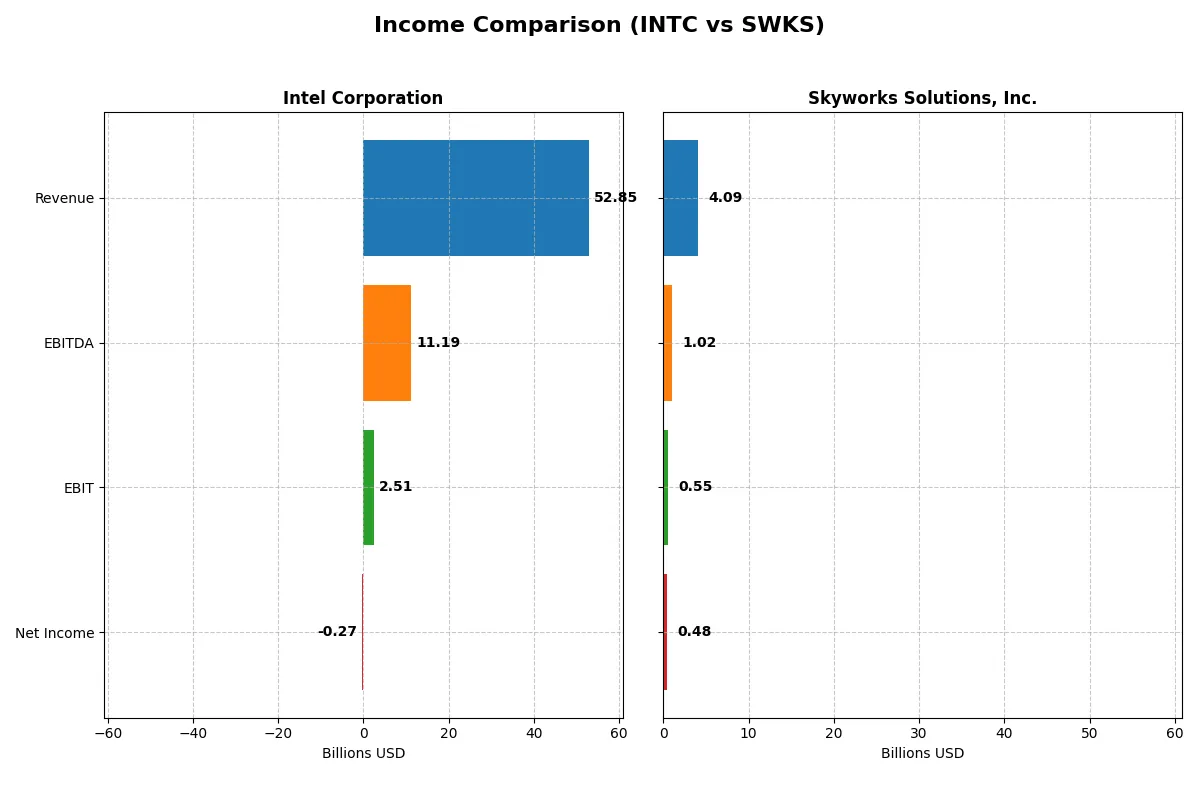
This data dissects core profitability and scalability of both corporate engines to reveal who dominates the bottom line in their most recent fiscal year:
| Metric | Intel Corporation (INTC) | Skyworks Solutions, Inc. (SWKS) |
|---|---|---|
| Revenue | 52.9B | 4.1B |
| Cost of Revenue | 34.4B | 2.4B |
| Operating Expenses | 20.6B | 1.2B |
| Gross Profit | 18.5B | 1.7B |
| EBITDA | 11.2B | 1.0B |
| EBIT | 2.5B | 554M |
| Interest Expense | 953M | 27M |
| Net Income | -267M | 477M |
| EPS | -0.08 | 3.09 |
| Fiscal Year | 2025 | 2025 |
Income Statement Analysis: The Bottom-Line Duel
This income statement comparison reveals which company operates a more efficient and profitable business engine over recent years.
Intel Corporation Analysis
Intel’s revenue declined from 79B in 2021 to 52.9B in 2025, reflecting a 33% drop over five years. Net income swung dramatically from a 19.9B profit in 2021 to a 267M loss in 2025, showing significant volatility. Gross margins hovered near 35%, but the net margin turned negative in 2025, signaling margin pressure despite a recent improvement in EBIT and EPS growth.
Skyworks Solutions, Inc. Analysis
Skyworks’ revenue shrank from 5.1B in 2021 to 4.1B in 2025, a 20% decline. Net income dropped from 1.5B to 477M, mirroring shrinking scale and profitability. However, the company consistently maintained a robust gross margin above 41% and a healthy net margin of 11.7% in 2025, indicating solid operational efficiency despite a recent downturn in growth metrics.
Margin Resilience vs. Scale Decline
Intel’s scale advantage is offset by steep declines in profitability and volatile earnings, challenging its efficiency. Skyworks maintains stronger margins and steadier profitability, albeit on a smaller revenue base. For investors, Skyworks’ profile suggests a more consistent margin-focused model, while Intel’s profile reflects riskier scale-driven fluctuations.
Financial Ratios Comparison
These vital ratios act as a diagnostic tool to expose the underlying fiscal health, valuation premiums, and capital efficiency of the companies compared below:
| Ratios | Intel Corporation (INTC) | Skyworks Solutions, Inc. (SWKS) |
|---|---|---|
| ROE | -0.23% | 8.29% |
| ROIC | -0.02% | 6.35% |
| P/E | -658.38 | 24.95 |
| P/B | 1.54 | 2.07 |
| Current Ratio | 2.02 | 2.33 |
| Quick Ratio | 1.65 | 1.76 |
| D/E (Debt-to-Equity) | 0.41 | 0.21 |
| Debt-to-Assets | 22.03% | 15.20% |
| Interest Coverage | -2.23 | 18.45 |
| Asset Turnover | 0.25 | 0.52 |
| Fixed Asset Turnover | 0.50 | 2.95 |
| Payout ratio | 0 | 90.67% |
| Dividend yield | 0 | 3.63% |
| Fiscal Year | 2025 | 2025 |
Efficiency & Valuation Duel: The Vital Signs
Financial ratios serve as a company’s DNA, revealing hidden risks and operational strengths investors must understand.
Intel Corporation
Intel shows negative profitability with ROE at -0.23% and net margin at -0.51%, signaling operational challenges. Its P/E ratio is anomalously low and favorable, yet the lack of dividends points to a reinvestment focus on R&D, consuming substantial cash flow. Asset turnover remains weak, reflecting inefficiency.
Skyworks Solutions, Inc.
Skyworks posts a solid net margin of 11.67% and a positive ROE of 8.29%, though slightly below its sector’s elite. Its P/E of 24.95 is neutral, suggesting fair valuation. The company rewards shareholders with a 3.63% dividend yield, supported by strong cash flow and prudent debt management.
Balanced Strength vs. Recovery Risks
Skyworks offers a healthier mix of profitability and shareholder returns, with fewer red flags than Intel’s stretched metrics and operating losses. Investors prioritizing steady income and operational efficiency may find Skyworks’ profile more aligned with risk-managed growth.
Which one offers the Superior Shareholder Reward?
I compare Intel Corporation (INTC) and Skyworks Solutions, Inc. (SWKS) on dividends, buybacks, and sustainability. Intel pays no dividend in 2025, with a -1.02 FCF per share and zero dividend payout. It lacks buyback intensity amid cash flow struggles. Skyworks yields 3.63% in 2025, with a 90.7% payout ratio and robust 7.16 FCF per share, underpinning sustainable dividends. Skyworks also maintains modest debt and strong operating cash flow coverage. I see Skyworks’ distribution model as far more sustainable, delivering superior total shareholder return in 2026.
Comparative Score Analysis: The Strategic Profile
The radar chart reveals the fundamental DNA and trade-offs of Intel Corporation and Skyworks Solutions, Inc., highlighting their financial strengths and vulnerabilities:
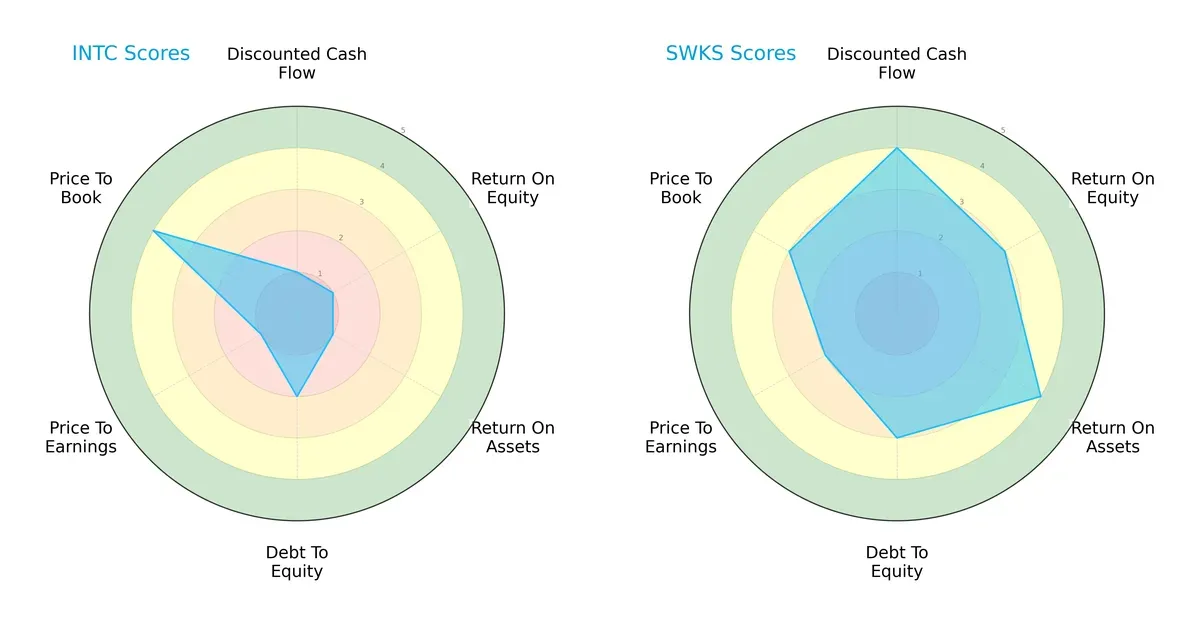
Skyworks Solutions displays a more balanced and favorable profile, excelling in discounted cash flow (DCF), return on equity (ROE), and return on assets (ROA). Intel relies heavily on its price-to-book valuation as its main strength, while lagging significantly in profitability and valuation metrics. Intel’s debt-to-equity position is moderate but weaker than Skyworks’, which shows a more consistent financial framework across all scores.
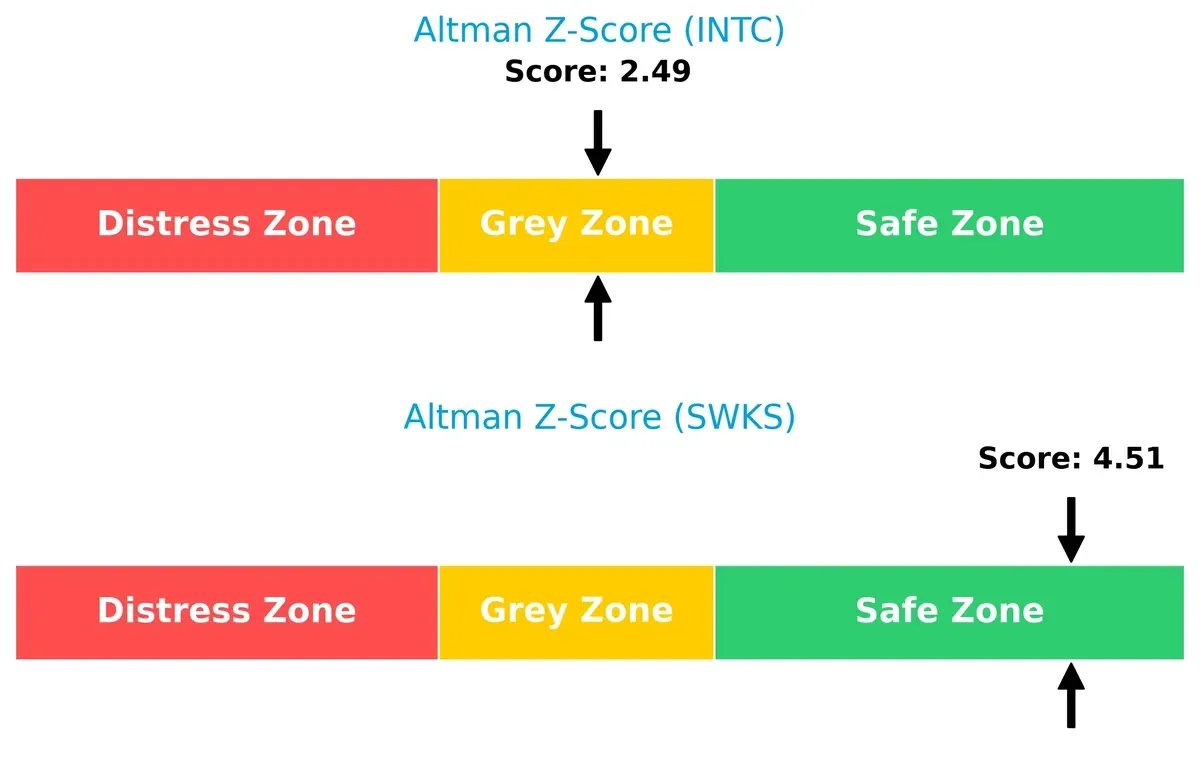
Bankruptcy Risk: Solvency Showdown
Skyworks Solutions’ Altman Z-Score of 4.51 places it comfortably in the safe zone, signaling robust long-term solvency. Intel’s score of 2.49 falls into the grey zone, indicating moderate bankruptcy risk under current market cycles:
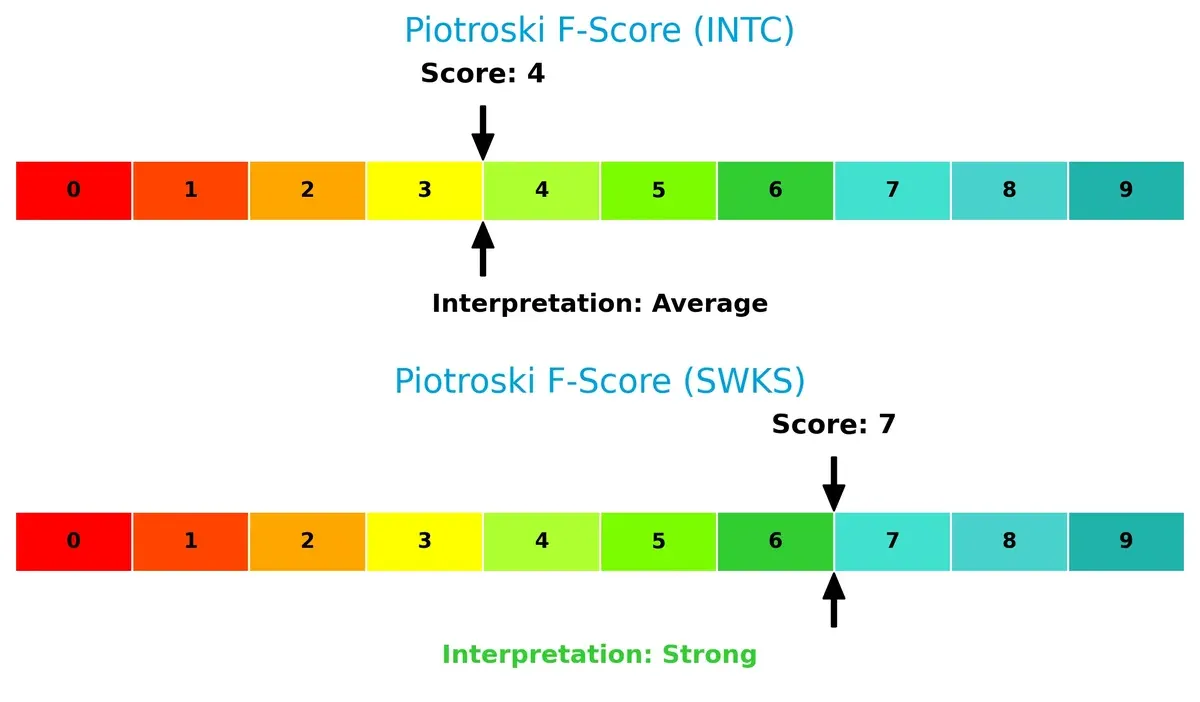
Financial Health: Quality of Operations
Skyworks leads with a Piotroski F-Score of 7, reflecting strong internal financial health and operational quality. Intel’s score of 4 suggests average financial strength, revealing potential red flags in profitability or liquidity compared to its peer:
How are the two companies positioned?
This section dissects the operational DNA of Intel and Skyworks by comparing their revenue distribution and internal strengths and weaknesses. The goal is to confront their economic moats to identify which model offers the most resilient competitive advantage today.
Revenue Segmentation: The Strategic Mix
The following visual comparison dissects how both firms diversify their income streams and where their primary sector bets lie:
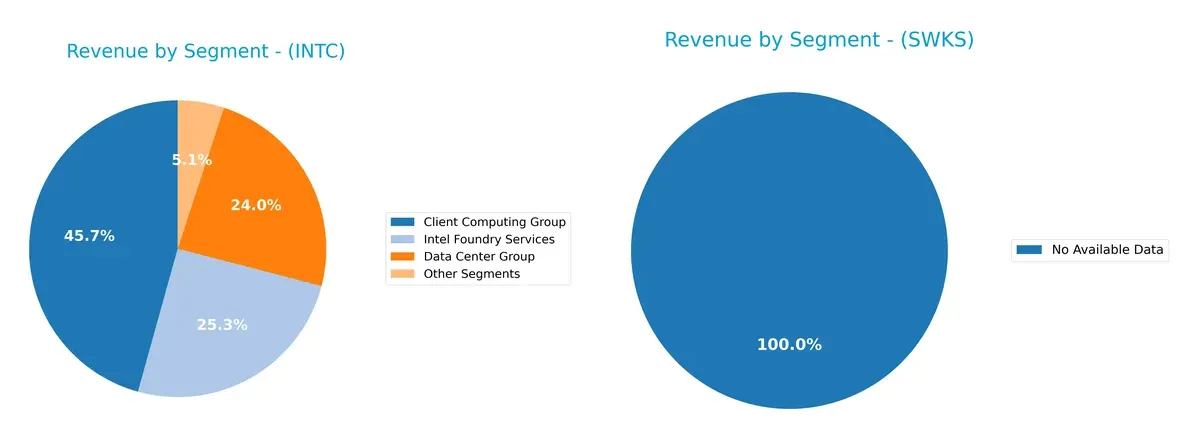
Intel Corporation’s revenue pivots around three major segments: Client Computing Group at $32.2B, Intel Foundry Services at $17.8B, and Data Center Group at $16.9B in 2025. This mix shows a strong diversification with no single segment overwhelmingly dominant. Skyworks Solutions, Inc. lacks available data for segmentation comparison, highlighting a transparency gap. Intel’s balanced portfolio mitigates concentration risk while leveraging ecosystem lock-in in computing and foundry infrastructure.
Strengths and Weaknesses Comparison
This table compares the strengths and weaknesses of Intel Corporation and Skyworks Solutions, Inc.:
Intel Corporation Strengths
- Diverse product segments including Client Computing, Data Center, Foundry Services
- Strong global presence with significant revenues from US, Singapore, Taiwan
- Favorable liquidity ratios with current ratio at 2.02 and quick ratio at 1.65
- Low debt-to-assets ratio at 22.03% indicating prudent leverage management
Skyworks Solutions Strengths
- Favorable net margin at 11.67% indicating profitability
- Strong interest coverage ratio at 20.44 reflecting solid earnings to cover debt
- Good liquidity with current ratio 2.33 and quick ratio 1.76
- Diversified geographic revenues with US dominance and expanding Asian markets
- Positive dividend yield at 3.63% supporting shareholder returns
Intel Corporation Weaknesses
- Negative profitability metrics: net margin -0.51%, ROE -0.23%, ROIC -0.02%
- Low asset turnover ratios indicating inefficiency in asset utilization
- Unfavorable dividend yield at 0% suggesting lack of income distribution
- Slightly unfavorable overall financial ratio profile
Skyworks Solutions Weaknesses
- ROE at 8.29% below typical industry benchmarks
- Neutral ROIC at 6.35% close to WACC of 9.21%, limiting value creation upside
- Moderate price-to-earnings ratio at 24.95, not clearly undervalued
Intel’s strengths lie in its diversified product base and global footprint but are offset by weak profitability and operational efficiency. Skyworks shows healthier profitability and balance sheet metrics but faces pressure to improve returns on equity and capital. These contrasts highlight differing strategic challenges and operational focuses.
The Moat Duel: Analyzing Competitive Defensibility
A structural moat alone shields long-term profits from relentless competitive erosion. Let’s dissect how Intel and Skyworks defend their turf:
Intel Corporation: Scale and Integration Moat
Intel leverages massive scale and manufacturing integration, sustaining moderate gross margins near 35%. Yet, declining ROIC signals pressure on its capital efficiency. In 2026, expansion into AI and autonomous driving could deepen barriers but also faces fierce competition.
Skyworks Solutions, Inc.: Specialized Niche Moat
Skyworks specializes in proprietary analog semiconductors, commanding superior 41% gross margins and higher EBIT margins than Intel. Its niche focus delivers stronger profitability but declining ROIC warns of margin compression risks. Growth hinges on 5G and automotive markets.
Scale Dominance vs. Niche Expertise: Which Moat Holds Stronger?
Both lose value as ROIC trends downward, signaling shrinking economic moats. Intel’s broader scale offers wider moats but less efficiency. Skyworks’ focused niche yields deeper margins yet faces narrower competitive moats. Intel’s scale better equips it to defend market share long-term despite current profitability erosion.
Which stock offers better returns?
The past year shows contrasting stock price dynamics: Intel Corporation registers steady gains with accelerating momentum, while Skyworks Solutions, Inc. faces a pronounced decline and decelerating trend.
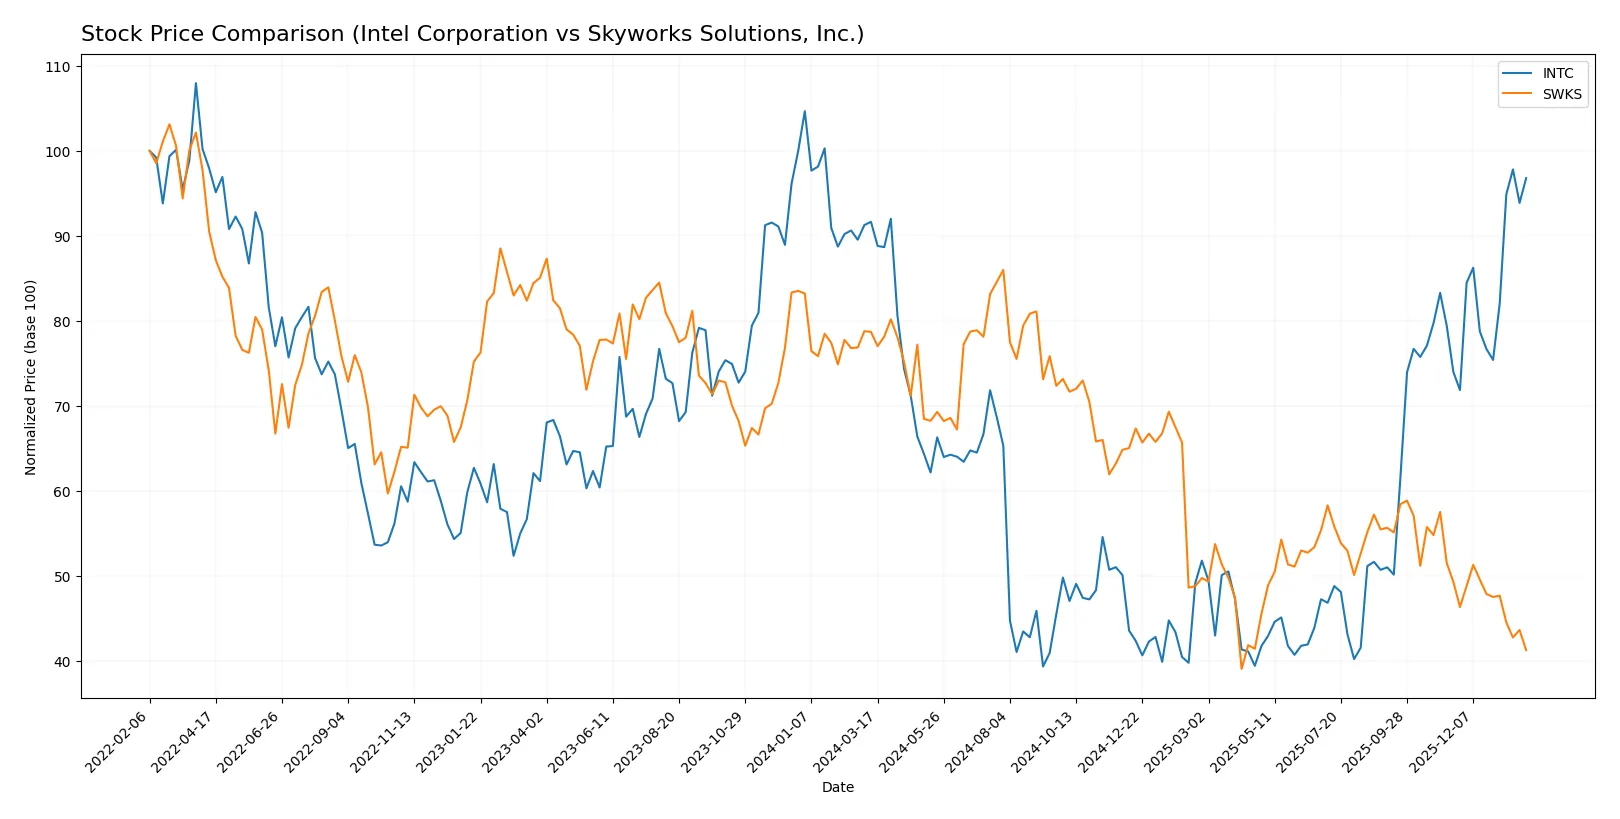
Trend Comparison
Intel’s stock rises 5.61% over the last 12 months, marking a bullish trend with accelerating price gains and moderate volatility (8.11 std dev). The recent quarter saw a sharp 30.83% increase.
Skyworks’ stock falls 47.55% across the same period, confirming a bearish trend marked by deceleration and high volatility (16.49 std dev). Its recent decline was 16.28%, continuing a downtrend.
Intel’s stock shows superior market performance with positive returns and acceleration, while Skyworks endures substantial losses and decelerating price action.
Target Prices
Analysts provide a broad target range for Intel Corporation and Skyworks Solutions, indicating varied market expectations.
| Company | Target Low | Target High | Consensus |
|---|---|---|---|
| Intel Corporation | 20 | 66 | 46.95 |
| Skyworks Solutions, Inc. | 60 | 140 | 80.9 |
Intel’s consensus target of $46.95 aligns closely with its current $46.47 share price, reflecting a balanced outlook. Skyworks’ $80.9 consensus target suggests significant upside from the current $55.76 price, indicating bullish analyst sentiment.

Don’t Let Luck Decide Your Entry Point
Optimize your entry points with our advanced ProRealTime indicators. You’ll get efficient buy signals with precise price targets for maximum performance. Start outperforming now!
How do institutions grade them?
Intel Corporation Grades
The table below summarizes recent analyst grades for Intel Corporation:
| Grading Company | Action | New Grade | Date |
|---|---|---|---|
| RBC Capital | maintain | Sector Perform | 2026-01-23 |
| Keybanc | maintain | Overweight | 2026-01-23 |
| Evercore ISI Group | maintain | In Line | 2026-01-23 |
| Needham | maintain | Hold | 2026-01-23 |
| Benchmark | maintain | Buy | 2026-01-23 |
| Rosenblatt | maintain | Sell | 2026-01-23 |
| UBS | maintain | Neutral | 2026-01-23 |
| Citigroup | maintain | Neutral | 2026-01-23 |
| Stifel | maintain | Hold | 2026-01-23 |
| Wedbush | maintain | Neutral | 2026-01-23 |
Skyworks Solutions, Inc. Grades
Here is a summary of recent analyst grades for Skyworks Solutions, Inc.:
| Grading Company | Action | New Grade | Date |
|---|---|---|---|
| B. Riley Securities | maintain | Neutral | 2026-01-26 |
| Mizuho | maintain | Neutral | 2026-01-26 |
| Susquehanna | maintain | Neutral | 2026-01-22 |
| UBS | maintain | Neutral | 2026-01-20 |
| Mizuho | upgrade | Neutral | 2025-11-11 |
| UBS | maintain | Neutral | 2025-11-05 |
| JP Morgan | maintain | Neutral | 2025-11-05 |
| UBS | maintain | Neutral | 2025-10-29 |
| Barclays | upgrade | Equal Weight | 2025-10-29 |
| Keybanc | upgrade | Overweight | 2025-10-29 |
Which company has the best grades?
Intel shows a wider range of grades from Buy to Sell, while Skyworks maintains mostly Neutral ratings. Intel’s multiple Buy and Overweight ratings suggest a stronger institutional confidence, which could attract investors seeking diversified opinions and potential upside.
Risks specific to each company
The following categories identify the critical pressure points and systemic threats facing both firms in the 2026 market environment:
1. Market & Competition
Intel Corporation
- Faces declining net margins and negative ROIC, signaling competitive pressures and efficiency challenges.
Skyworks Solutions, Inc.
- Maintains favorable net margin and neutral ROIC, indicating stronger competitive positioning and operational efficiency.
2. Capital Structure & Debt
Intel Corporation
- Moderate debt-to-equity ratio (0.41) with neutral interest coverage (2.63x), posing manageable leverage risk.
Skyworks Solutions, Inc.
- Lower debt-to-equity (0.21) and strong interest coverage (20.44x) demonstrate conservative leverage and financial stability.
3. Stock Volatility
Intel Corporation
- Higher beta (1.354) suggests greater stock volatility and market sensitivity.
Skyworks Solutions, Inc.
- Slightly lower beta (1.317) indicates marginally less volatility in comparison.
4. Regulatory & Legal
Intel Corporation
- Large global footprint exposes Intel to diverse regulatory risks, especially in emerging technology sectors.
Skyworks Solutions, Inc.
- Also exposed globally but smaller scale reduces regulatory complexity and potential legal impact.
5. Supply Chain & Operations
Intel Corporation
- Lower asset turnover (0.25) and fixed asset turnover (0.5) reveal operational inefficiencies.
Skyworks Solutions, Inc.
- Better asset turnover metrics (0.52 and 2.95) suggest more efficient asset utilization and supply chain management.
6. ESG & Climate Transition
Intel Corporation
- Large workforce and manufacturing footprint increase ESG risks, particularly regarding climate transition.
Skyworks Solutions, Inc.
- Smaller operational scale likely reduces ESG exposure, but semiconductor industry remains sensitive to sustainability demands.
7. Geopolitical Exposure
Intel Corporation
- Significant global operations increase exposure to geopolitical tensions affecting supply chains and markets.
Skyworks Solutions, Inc.
- Global presence but smaller scale may limit geopolitical risk impact compared to Intel.
Which company shows a better risk-adjusted profile?
Intel’s most impactful risk lies in its operational inefficiency and weakening profitability amid intense competition. Skyworks faces less severe competitive pressure and shows robust financial health, with stronger margins and efficient capital use. Skyworks’ Altman Z-Score in the safe zone and higher Piotroski score confirm superior financial stability. I view Skyworks as the better risk-adjusted choice, supported by its favorable debt profile and operational metrics.
Final Verdict: Which stock to choose?
Intel Corporation’s superpower lies in its massive scale and operational resilience, enabling it to navigate cyclical headwinds with strategic R&D investment. However, a point of vigilance remains its declining profitability and value destruction over recent years. Intel fits portfolios seeking deep turnaround potential amid semiconductor industry shifts.
Skyworks Solutions, Inc. boasts a strategic moat rooted in its focused analog semiconductor niche and solid recurring revenue streams. Its financial stability and healthier cash flow profile offer better downside protection compared to Intel. Skyworks suits investors favoring steady growth with a moderate risk appetite and income potential.
If you prioritize turnaround plays and can tolerate volatility, Intel’s scale and recent bullish price momentum might outshine Skyworks. However, if you seek better stability and consistent cash generation, Skyworks offers a safer profile with less value erosion. Each scenario aligns with distinct investor risk tolerances and strategic goals.
Disclaimer: Investment carries a risk of loss of initial capital. The past performance is not a reliable indicator of future results. Be sure to understand risks before making an investment decision.
Go Further
I encourage you to read the complete analyses of Intel Corporation and Skyworks Solutions, Inc. to enhance your investment decisions: