Home > Comparison > Technology > INTC vs SLAB
The strategic rivalry between Intel Corporation and Silicon Laboratories Inc. shapes the semiconductor industry’s evolution. Intel, a capital-intensive giant, leads with broad platform products and high-performance compute solutions. Silicon Labs, a nimble fabless firm, specializes in analog-intensive mixed-signal solutions for IoT applications. This analysis compares their distinct operational models to identify which offers superior risk-adjusted returns for diversified portfolios navigating a complex tech landscape.
Table of contents
Companies Overview
Intel and Silicon Laboratories both shape the semiconductor landscape with distinct scale and focus.
Intel Corporation: Global Semiconductor Powerhouse
Intel dominates as a semiconductor giant with a $232B market cap. It earns revenue from diverse products like CPUs, chipsets, accelerators, and high-performance compute solutions. In 2026, it emphasizes AI-driven innovation and autonomous driving platforms to expand its technology leadership across computing and embedded systems.
Silicon Laboratories Inc.: IoT-Focused Mixed-Signal Innovator
Silicon Labs operates as a fabless semiconductor specialist with a $4.7B market cap. It generates revenue from wireless microcontrollers and sensor products designed for IoT applications like smart homes and industrial automation. The company’s 2026 strategy centers on broadening its analog-intensive mixed-signal portfolio to capture growing IoT market demand.
Strategic Collision: Similarities & Divergences
Both compete within semiconductors but diverge sharply in scale and scope. Intel pursues a broad platform approach spanning cloud to automotive, while Silicon Labs targets niche IoT verticals with specialized mixed-signal solutions. Their primary battleground lies in embedded and connected device markets. Intel offers a diversified, capital-intensive profile; Silicon Labs presents a focused, agile growth story.
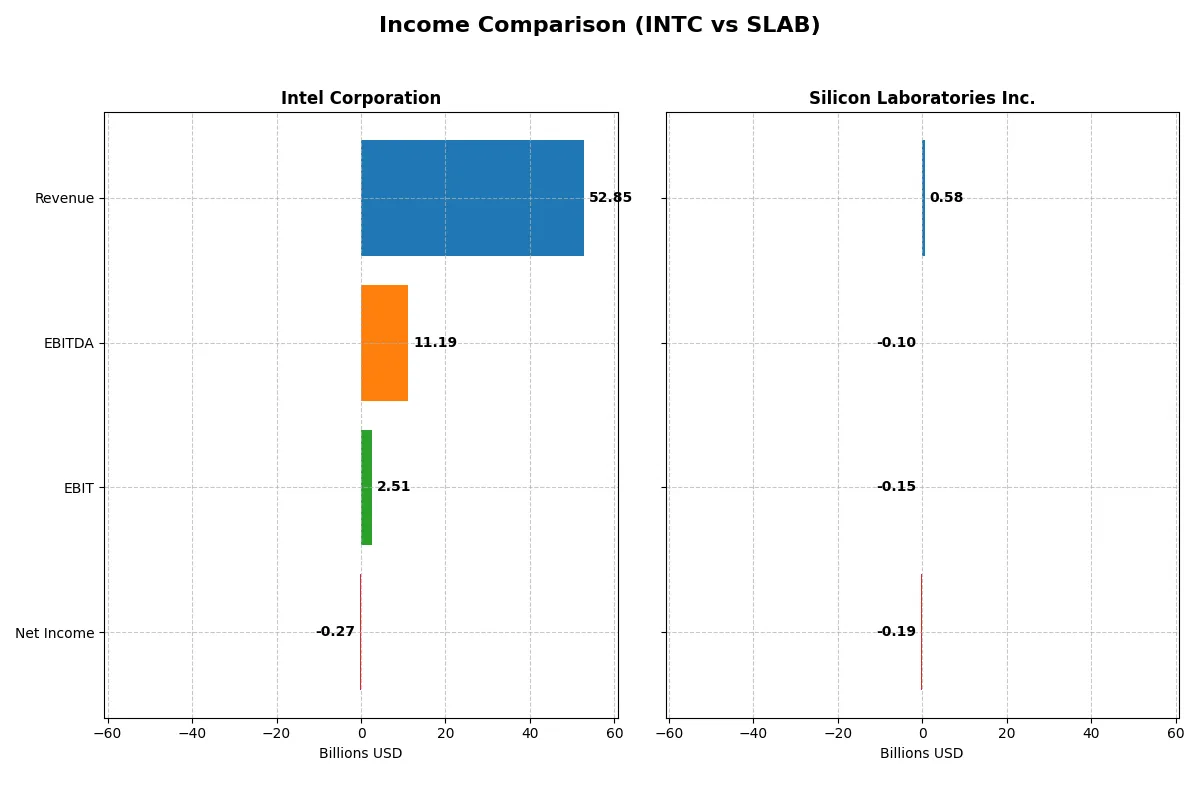
Income Statement Comparison
This data dissects the core profitability and scalability of both corporate engines to reveal who dominates the bottom line:
| Metric | Intel Corporation (INTC) | Silicon Laboratories Inc. (SLAB) |
|---|---|---|
| Revenue | 52.9B | 584M |
| Cost of Revenue | 34.4B | 272M |
| Operating Expenses | 20.6B | 478M |
| Gross Profit | 18.5B | 312M |
| EBITDA | 11.2B | -105M |
| EBIT | 2.5B | -154M |
| Interest Expense | 953M | 1.3M |
| Net Income | -267M | -191M |
| EPS | -0.08 | -5.93 |
| Fiscal Year | 2025 | 2024 |
Income Statement Analysis: The Bottom-Line Duel
This income statement comparison exposes the true operational efficiency and profitability of Intel Corporation and Silicon Laboratories Inc.
Intel Corporation Analysis
Intel’s revenue declined slightly from $53.1B in 2024 to $52.9B in 2025. Despite this, gross profit improved to $18.5B, lifting gross margins to a favorable 35%. However, net income swung to a loss of $267M in 2025 from a steep $18.8B loss in 2024, reflecting ongoing operational challenges but showing signs of margin recovery and improved EBIT.
Silicon Laboratories Inc. Analysis
Silicon Labs saw revenue drop 25% to $584M in 2024 from $782M in 2023. Gross margin remained favorable at 53% but EBIT margin deteriorated to -26%, and net income plunged to a loss of $191M, deepening from a $34.5M loss the prior year. This indicates weakening profitability and operational stress amid shrinking sales.
Margin Strength vs. Revenue Resilience
Intel displays stronger scale with improving gross margins and a narrowing net loss, signaling operational stabilization despite revenue contraction. Silicon Labs, while boasting higher gross margins, suffers from steep profitability declines and worsening net losses. From a fundamentals perspective, Intel’s size and margin recovery offer a more attractive profile for investors prioritizing resilience and margin improvement.
Financial Ratios Comparison
These vital ratios act as a diagnostic tool to expose the underlying fiscal health, valuation premiums, and capital efficiency of the companies analyzed:
| Ratios | Intel Corporation (INTC) | Silicon Laboratories Inc. (SLAB) |
|---|---|---|
| ROE | -0.23% | -17.69% |
| ROIC | -0.02% | -14.71% |
| P/E | -658.4 | -21.53 |
| P/B | 1.54 | 3.81 |
| Current Ratio | 2.02 | 6.15 |
| Quick Ratio | 1.65 | 5.07 |
| D/E | 0.41 | 0.01 |
| Debt-to-Assets | 22.03% | 1.27% |
| Interest Coverage | -2.23 | -126.33 |
| Asset Turnover | 0.25 | 0.48 |
| Fixed Asset Turnover | 0.50 | 4.42 |
| Payout ratio | 0 | 0 |
| Dividend yield | 0 | 0 |
| Fiscal Year | 2025 | 2024 |
Efficiency & Valuation Duel: The Vital Signs
Ratios act as a company’s DNA, exposing hidden risks and operational strengths that shape investor decisions over market cycles.
Intel Corporation
Intel’s profitability struggles with negative ROE (-0.23%) and net margin (-0.51%), signaling operational challenges. The valuation shows a favorable negative P/E, suggesting low price relative to earnings. Intel maintains a strong balance sheet with a 2.02 current ratio and no dividends, opting to reinvest heavily in R&D (26% of revenue) to drive growth.
Silicon Laboratories Inc.
Silicon Labs exhibits steep losses with a negative ROE (-17.69%) and a severely negative net margin (-32.69%), reflecting profit erosion. Its P/E ratio is favorable despite stretched valuations with a high price-to-book at 3.81. The company avoids dividends, channeling substantial resources into R&D (57% of revenue), but suffers from weak interest coverage and high operating risks.
Operational Efficiency vs. Growth Investment
Intel balances modest valuation with operational weakness but leverages strong liquidity and reinvestment to stabilize. Silicon Labs faces heavier losses and valuation concerns despite aggressive R&D investment. Intel suits investors prioritizing financial stability. Silicon Labs fits those seeking high growth amid elevated risk.
Which one offers the Superior Shareholder Reward?
I observe that Intel Corporation (INTC) pays a modest dividend yield around 1.8% in 2024 with no recent buybacks, relying on steady dividends despite negative free cash flow. Silicon Laboratories Inc. (SLAB) pays no dividends and shows negative operating cash flow, focusing on reinvestment and growth but with weak profitability and no buybacks. Intel’s dividend payout ratio and coverage indicate a cautious but sustainable income model. SLAB’s zero dividend and negative cash flow raise sustainability concerns. I conclude Intel offers a more attractive total return profile in 2026 due to its consistent shareholder distributions and stronger capital allocation discipline.
Comparative Score Analysis: The Strategic Profile
The radar chart reveals the fundamental DNA and trade-offs of Intel Corporation and Silicon Laboratories Inc., highlighting their core financial strengths and weaknesses:
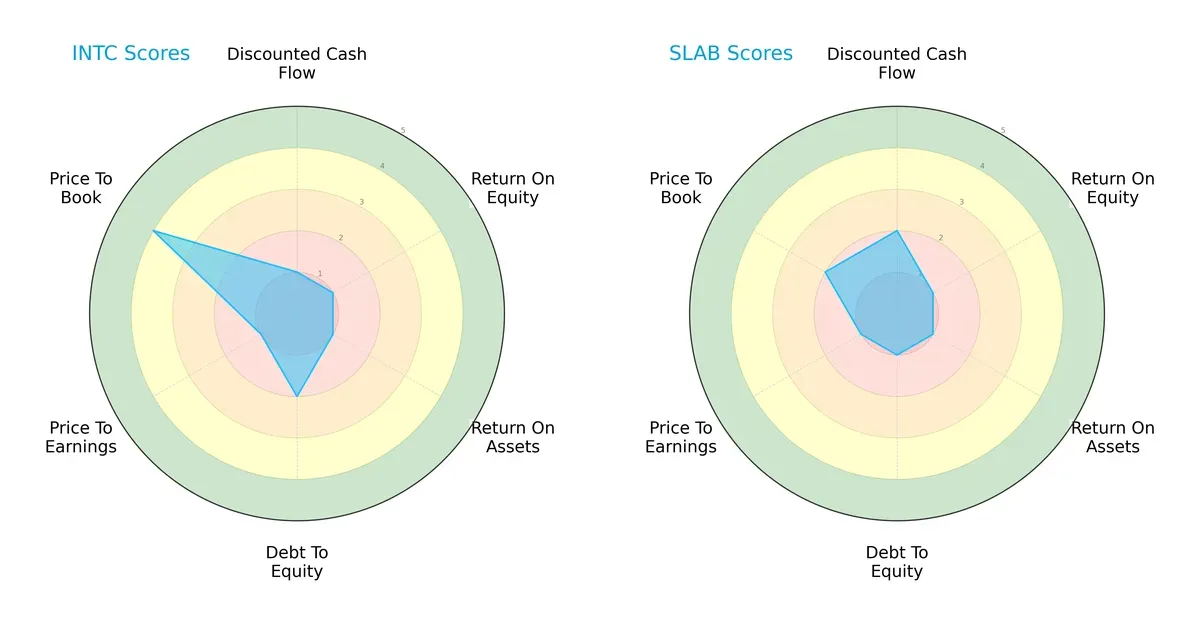
Intel shows a more balanced profile with moderate debt management and favorable price-to-book valuation. Silicon Laboratories leans on a stronger discounted cash flow score but struggles with leverage and valuation. Neither firm excels in profitability metrics, indicating sector-wide challenges.
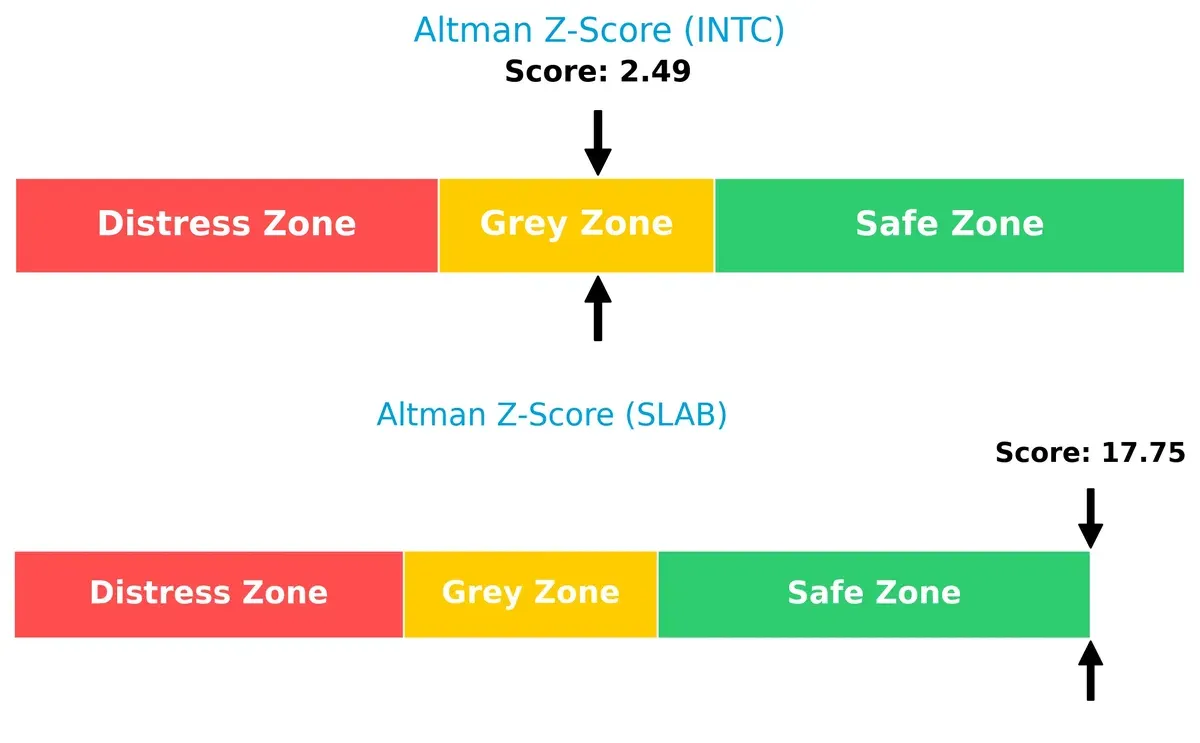
Bankruptcy Risk: Solvency Showdown
Intel’s Altman Z-Score of 2.49 places it in the grey zone, signaling moderate bankruptcy risk. Silicon Laboratories scores a robust 17.75, firmly in the safe zone, suggesting superior long-term solvency in this cycle:
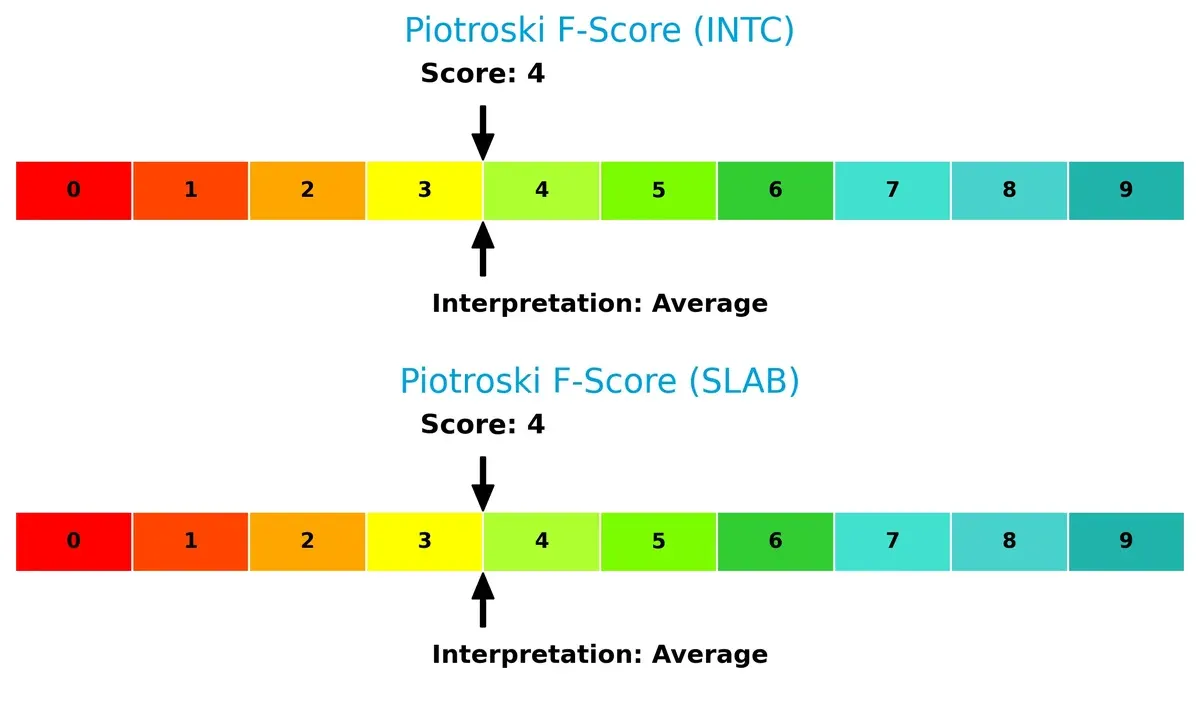
Financial Health: Quality of Operations
Both firms share a Piotroski F-Score of 4, reflecting average financial health. Neither displays clear red flags, but neither demonstrates strong internal financial strength relative to industry best practices:
How are the two companies positioned?
This section dissects the operational DNA of Intel and Silicon Laboratories by comparing their revenue distribution and internal dynamics. The goal is to confront their economic moats to reveal which business model offers the most resilient, sustainable competitive advantage today.
Revenue Segmentation: The Strategic Mix
This comparison dissects how Intel Corporation and Silicon Laboratories Inc. diversify their income streams and highlights where their primary sector bets lie:
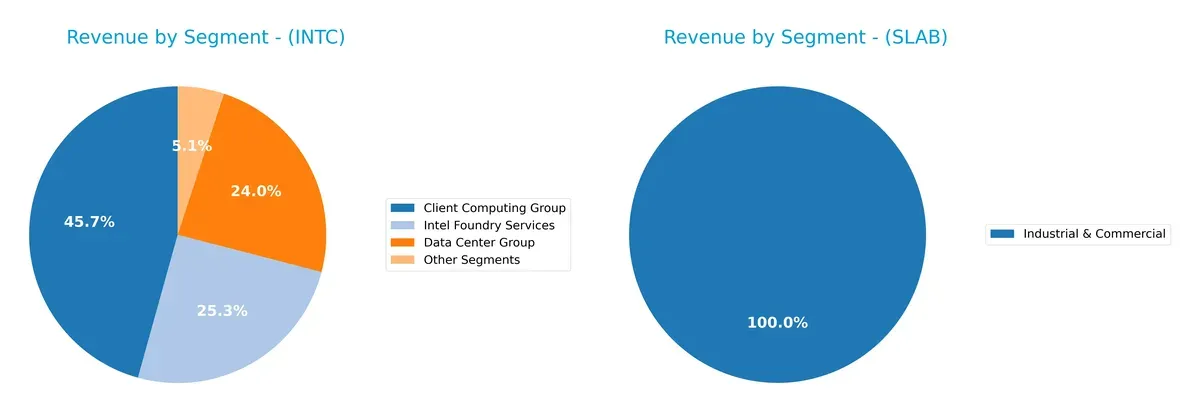
Intel’s revenue pivots around three large segments: Client Computing Group at $32.2B, Intel Foundry Services at $17.8B, and Data Center Group at $16.9B. This mix reflects a broad ecosystem lock-in with notable infrastructure dominance. Silicon Laboratories relies almost entirely on its Industrial & Commercial segment at $339M, signaling high concentration risk and limited diversification. Intel’s expansive portfolio offers resilience; Silicon Labs’ focus demands close monitoring of market shifts.
Strengths and Weaknesses Comparison
This table compares the Strengths and Weaknesses of Intel Corporation and Silicon Laboratories Inc.:
Intel Strengths
- Diversified revenue streams across multiple segments
- Strong global presence with significant sales in US and Asia
- Favorable liquidity ratios indicating solid short-term financial health
Silicon Laboratories Strengths
- Favorable quick ratio and low debt-to-assets ratio reflect strong financial stability
- High fixed asset turnover suggests efficient use of long-term assets
- Presence in diverse geographic markets including China and US
Intel Weaknesses
- Negative profitability metrics including net margin and ROIC
- Unfavorable asset turnover ratios imply lower operational efficiency
- Zero dividend yield may deter income-focused investors
Silicon Laboratories Weaknesses
- Deeply negative profitability ratios with high net margin loss
- Unfavorable weighted average cost of capital (WACC) and interest coverage
- High price-to-book ratio may signal overvaluation risk
Intel leads with broader diversification and a strong global footprint, while Silicon Labs shows asset efficiency and financial stability but struggles with profitability and cost of capital. Both face distinct challenges that shape their strategic priorities.
The Moat Duel: Analyzing Competitive Defensibility
A structural moat is the only reliable shield protecting long-term profits from relentless competitive erosion in any industry:
Intel Corporation: Scale-Driven Cost Advantage
Intel’s moat centers on massive scale and manufacturing expertise, yielding solid gross margins near 35%. However, its declining ROIC signals weakening capital efficiency. New AI and autonomous driving ventures could deepen its moat if executed well by 2026.
Silicon Laboratories Inc.: Niche Intangible Assets
Silicon Labs relies on specialized mixed-signal products and IoT focus, creating a narrow intangible asset moat. Despite a superior gross margin of 53%, its sharply negative EBIT and ROIC trends reveal profitability struggles. Expansion into emerging IoT markets offers growth potential but carries execution risk.
Scale Dominance vs. Niche Specialization in Semiconductor Moats
Intel’s broader scale-based moat currently faces durability challenges with declining returns. Silicon Labs’ niche moat is financially weaker due to persistent losses. Intel remains better positioned to defend market share given its diversified product platforms and investment capacity.
Which stock offers better returns?
The past year shows Intel’s stock gaining steadily with accelerating momentum, while Silicon Laboratories’ price declines overall despite a recent rebound.
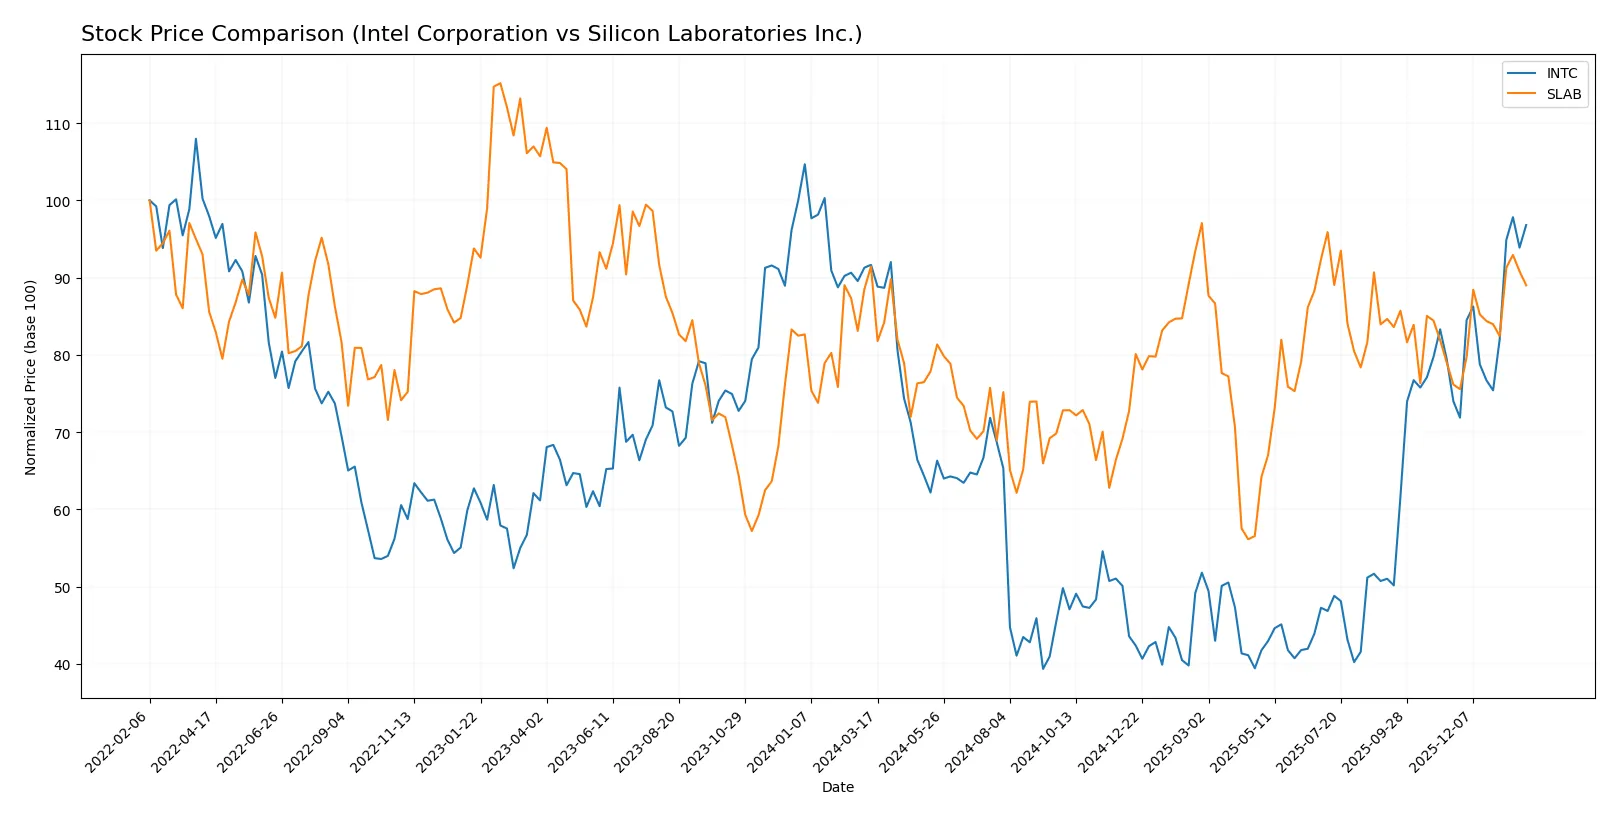
Trend Comparison
Intel’s stock price increased 5.61% over the last 12 months, signaling a bullish trend with accelerating gains and moderate volatility. The price ranged from $18.89 to $46.96.
Silicon Laboratories’ stock declined 2.65% over the same period, marking a bearish trend despite accelerating movement and higher volatility, with prices between $89.82 and $155.33.
Intel’s consistent 5.61% gain outperforms Silicon Laboratories’ 2.65% loss, delivering the stronger market performance over the past year.
Target Prices
Analysts present a mixed but generally positive target price consensus for Intel and Silicon Laboratories.
| Company | Target Low | Target High | Consensus |
|---|---|---|---|
| Intel Corporation | 20 | 66 | 46.95 |
| Silicon Laboratories Inc. | 130 | 165 | 151.67 |
Intel’s consensus target price of $46.95 aligns closely with its current price of $46.47, indicating market expectations are fairly balanced. Silicon Laboratories’ consensus target price of $151.67 suggests upside potential compared to its current $142.45 price.

Don’t Let Luck Decide Your Entry Point
Optimize your entry points with our advanced ProRealTime indicators. You’ll get efficient buy signals with precise price targets for maximum performance. Start outperforming now!
How do institutions grade them?
Intel Corporation Grades
Here are the latest grades from reputable institutions for Intel Corporation:
| Grading Company | Action | New Grade | Date |
|---|---|---|---|
| RBC Capital | Maintain | Sector Perform | 2026-01-23 |
| Keybanc | Maintain | Overweight | 2026-01-23 |
| Evercore ISI Group | Maintain | In Line | 2026-01-23 |
| Needham | Maintain | Hold | 2026-01-23 |
| Benchmark | Maintain | Buy | 2026-01-23 |
| Rosenblatt | Maintain | Sell | 2026-01-23 |
| UBS | Maintain | Neutral | 2026-01-23 |
| Citigroup | Maintain | Neutral | 2026-01-23 |
| Stifel | Maintain | Hold | 2026-01-23 |
| Wedbush | Maintain | Neutral | 2026-01-23 |
Silicon Laboratories Inc. Grades
Below are the recent grades from recognized firms for Silicon Laboratories Inc.:
| Grading Company | Action | New Grade | Date |
|---|---|---|---|
| Susquehanna | Maintain | Neutral | 2025-08-06 |
| Morgan Stanley | Maintain | Equal Weight | 2025-08-06 |
| Barclays | Maintain | Equal Weight | 2025-08-05 |
| Susquehanna | Maintain | Neutral | 2025-07-22 |
| Stifel | Maintain | Buy | 2025-07-18 |
| Keybanc | Maintain | Overweight | 2025-07-08 |
| Benchmark | Maintain | Buy | 2025-05-27 |
| Benchmark | Maintain | Buy | 2025-05-14 |
| Needham | Maintain | Buy | 2025-05-14 |
| Susquehanna | Maintain | Neutral | 2025-05-14 |
Which company has the best grades?
Silicon Laboratories Inc. holds more Buy and Overweight ratings than Intel Corporation, which features mixed grades including Sell and Hold. This difference may affect investor sentiment and portfolio positioning.
Risks specific to each company
The following categories identify the critical pressure points and systemic threats facing both firms in the 2026 market environment:
1. Market & Competition
Intel Corporation
- Faces intense competition in semiconductors, with pressure from emerging chipmakers and evolving tech demands.
Silicon Laboratories Inc.
- Operates in niche mixed-signal and IoT markets but faces competition from larger, diversified analog and sensor firms.
2. Capital Structure & Debt
Intel Corporation
- Maintains moderate leverage with a debt-to-equity ratio of 0.41, manageable but interest coverage is only neutral at 2.63x.
Silicon Laboratories Inc.
- Very low leverage (debt-to-equity 0.01), but severely negative interest coverage signals operational losses and risk of financial distress.
3. Stock Volatility
Intel Corporation
- Beta of 1.35 indicates above-market volatility, usual for cyclicals in semiconductors.
Silicon Laboratories Inc.
- Beta of 1.54 reflects higher volatility, increasing risk for investors in this smaller, more volatile firm.
4. Regulatory & Legal
Intel Corporation
- Subject to antitrust scrutiny and export controls due to global scale and dominant market share.
Silicon Laboratories Inc.
- Faces regulatory risks primarily from international trade policies affecting IoT product components.
5. Supply Chain & Operations
Intel Corporation
- Complex, global supply chain vulnerable to geopolitical disruptions but benefits from scale and vertical integration.
Silicon Laboratories Inc.
- Relies on external foundries, increasing supply chain risk amid chip shortages and geopolitical tensions.
6. ESG & Climate Transition
Intel Corporation
- Faces pressure to reduce carbon footprint and improve sustainability in manufacturing processes.
Silicon Laboratories Inc.
- Smaller footprint but limited public ESG commitments may concern ESG-focused investors.
7. Geopolitical Exposure
Intel Corporation
- Significant exposure to US-China tensions impacting semiconductor exports and technology sharing.
Silicon Laboratories Inc.
- Moderate geopolitical exposure, mainly from supply chain and international sales dynamics.
Which company shows a better risk-adjusted profile?
Intel’s moderate leverage, diversified operations, and scale provide better risk mitigation despite competitive pressures. Silicon Labs shows higher operational risk, with severe profitability issues and weak interest coverage, magnified by its smaller size and higher stock volatility. Intel’s Altman Z-Score in the grey zone reflects moderate financial distress risk, while Silicon Labs scores safely but suffers from poor operational earnings and a very unfavorable debt-to-equity score. The most impactful risk for Intel is geopolitical exposure, while Silicon Labs’ biggest threat is its negative profitability and financial instability. Recent ratio evaluations confirm Intel’s more balanced risk-adjusted profile despite sector headwinds.
Final Verdict: Which stock to choose?
Intel Corporation’s superpower lies in its scale and operational resilience. Despite recent profitability challenges, it maintains a strong balance sheet and steady cash flow generation. The key point of vigilance is its declining ROIC, signaling potential value destruction. Intel suits portfolios seeking established tech with turnaround potential.
Silicon Laboratories Inc. boasts a strategic moat through its specialized research and development focus, driving innovation. It offers a safer financial profile with minimal debt compared to Intel. However, its profitability struggles and margin instability require caution. Silicon Labs fits well for investors pursuing growth at a reasonable price with a tolerance for volatility.
If you prioritize scale and operational turnaround, Intel outshines due to its entrenched market position and improving cash flow. However, if you seek innovation-driven growth with better balance sheet stability, Silicon Labs offers superior financial safety despite current earnings weakness. Each represents distinct analytical scenarios for different risk appetites.
Disclaimer: Investment carries a risk of loss of initial capital. The past performance is not a reliable indicator of future results. Be sure to understand risks before making an investment decision.
Go Further
I encourage you to read the complete analyses of Intel Corporation and Silicon Laboratories Inc. to enhance your investment decisions: