Home > Comparison > Technology > INTC vs Q
The strategic rivalry between Intel Corporation and Qnity Electronics defines the trajectory of the semiconductor sector. Intel operates as a capital-intensive semiconductor giant with diverse end-market exposure. In contrast, Qnity Electronics focuses on specialized electronic materials essential to chip manufacturing, representing a niche player in the industry. This analysis compares their operational models to identify which offers superior risk-adjusted returns for a diversified portfolio in a rapidly evolving technology landscape.
Table of contents
Companies Overview
Intel Corporation and Qnity Electronics, Inc. anchor critical niches within the semiconductor industry, shaping technology’s future.
Intel Corporation: Semiconductor Powerhouse
Intel dominates as a global leader in semiconductor design and manufacturing. Its core revenue derives from platform products like CPUs and chipsets, alongside adjacent technologies such as accelerators and connectivity solutions. In 2026, Intel strategically focuses on high-performance compute platforms and AI-driven innovations, targeting cloud providers and emerging verticals like autonomous driving.
Qnity Electronics, Inc.: Advanced Materials Specialist
Qnity Electronics specializes in electronic solutions and materials crucial for semiconductor chip production. Its primary business centers on supplying advanced electronic materials that underpin chip manufacturing. Since its rebranding in 2025, Qnity has sharpened its strategic focus on enhancing materials technology to support semiconductor innovation, positioning itself as a vital upstream player.
Strategic Collision: Similarities & Divergences
Intel pursues a broad platform approach integrating hardware and software, while Qnity concentrates on specialized materials innovation. Their competitive battleground lies in the semiconductor value chain—Intel downstream with chip production, Qnity upstream with materials supply. This divergence creates distinct investment profiles: Intel offers scale and diversified tech exposure, Qnity presents focused growth in essential semiconductor inputs.
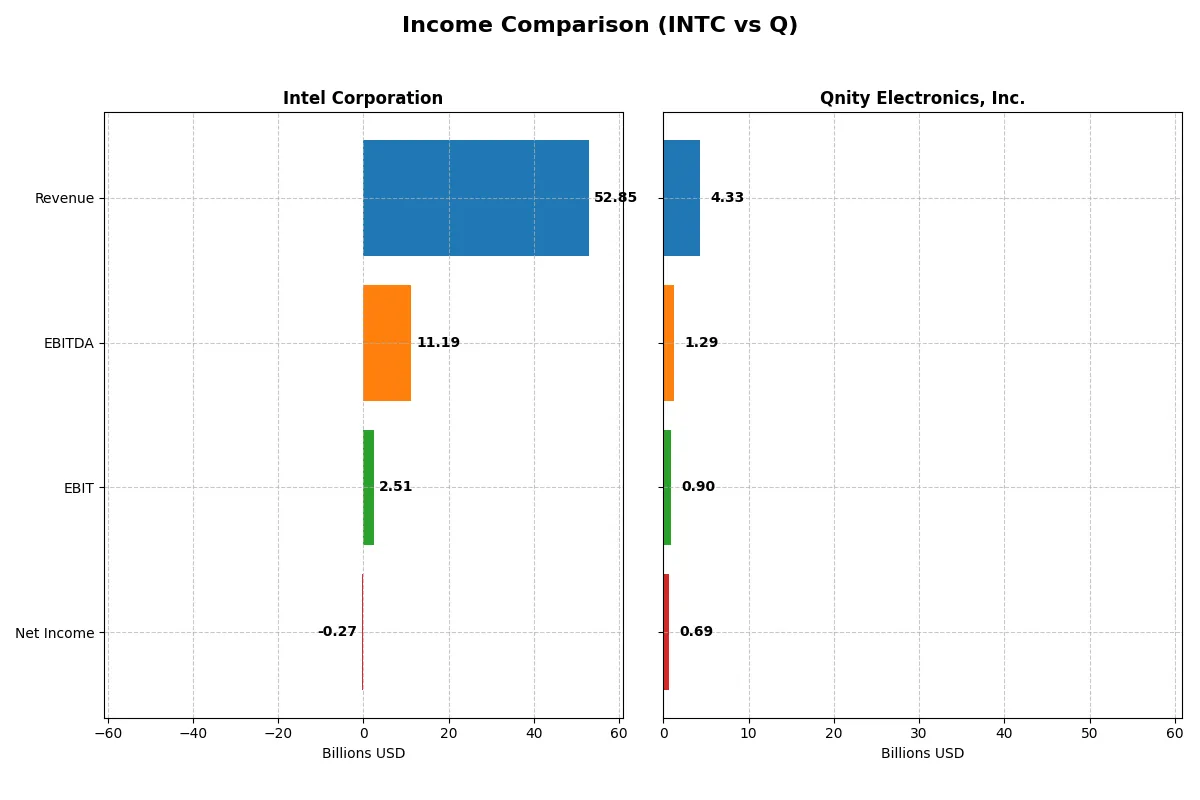
Income Statement Comparison
The following data dissects the core profitability and scalability of both corporate engines to reveal who dominates the bottom line:
| Metric | Intel Corporation (INTC) | Qnity Electronics, Inc. (Q) |
|---|---|---|
| Revenue | 52.85B | 4.34B |
| Cost of Revenue | 34.38B | 2.34B |
| Operating Expenses | 20.60B | 1.16B |
| Gross Profit | 18.48B | 2.00B |
| EBITDA | 11.19B | 1.29B |
| EBIT | 2.51B | 898M |
| Interest Expense | 953M | 280M |
| Net Income | -267M | 693M |
| EPS | -0.08 | 3.31 |
| Fiscal Year | 2025 | 2024 |
Income Statement Analysis: The Bottom-Line Duel
This income statement comparison reveals which company operates with greater financial efficiency and profit sustainability over recent years.
Intel Corporation Analysis
Intel’s revenue declined from $79B in 2021 to $53B in 2025, reflecting a 33% drop over five years. Net income deteriorated sharply, moving from $19.9B profit in 2021 to a $267M loss in 2025, signaling margin pressure. Despite a rebound in gross profit in 2025, net margin remained negative at -0.51%, showing ongoing challenges in cost management and profitability.
Qnity Electronics, Inc. Analysis
Qnity’s revenue showed modest growth, rising to $4.3B in 2024 from $4.0B in 2023, with a 7.4% one-year increase. Net income improved to $693M in 2024, supporting a healthy net margin of 15.99%. The company sustains strong gross and EBIT margins near 46% and 21%, respectively, reflecting operational efficiency and disciplined expense control.
Margin Power vs. Revenue Scale
Qnity Electronics leads on margin strength and profitability momentum, maintaining consistent growth and robust net margins. Intel’s scale is unmatched but offset by steep revenue decline and eroding net income, indicating weaker operational leverage. For investors prioritizing margin resilience, Qnity presents a more attractive efficiency profile despite its smaller size.
Financial Ratios Comparison
These vital ratios act as a diagnostic tool to expose the underlying fiscal health, valuation premiums, and capital efficiency of the companies compared:
| Ratios | Intel Corporation (INTC) | Qnity Electronics, Inc. (Q) |
|---|---|---|
| ROE | -0.23% | 6.51% |
| ROIC | -0.02% | 5.92% |
| P/E | -658.4 | 28.8 |
| P/B | 1.54 | 1.88 |
| Current Ratio | 2.02 | 1.77 |
| Quick Ratio | 1.65 | 1.06 |
| D/E (Debt-to-Equity) | 0.41 | 0.02 |
| Debt-to-Assets | 22.0% | 1.56% |
| Interest Coverage | -2.23 | 3.03 |
| Asset Turnover | 0.25 | 0.35 |
| Fixed Asset Turnover | 0.50 | 2.59 |
| Payout ratio | 0% | 0% |
| Dividend yield | 0% | 0% |
| Fiscal Year | 2025 | 2024 |
Efficiency & Valuation Duel: The Vital Signs
Financial ratios act as the company’s DNA, exposing hidden risks and operational strengths that shape investment decisions.
Intel Corporation
Intel shows negative core profitability with ROE at -0.23% and net margin at -0.51%, signaling operational struggles. Its valuation appears favorable with a deeply negative P/E, suggesting market skepticism. The company returns no dividends, instead investing heavily in R&D, dedicating over 26% of revenue to innovation to fuel future growth.
Qnity Electronics, Inc.
Qnity posts a healthy net margin of 15.99%, although its ROE is modest at 6.51%. The stock trades at a stretched P/E of 28.8, reflecting growth expectations. It pays no dividends but maintains efficient capital use with low debt and a strong current ratio, focusing on steady reinvestment in R&D, about 7% of revenue.
Premium Valuation vs. Operational Safety
Qnity offers stronger profitability and a healthier balance sheet, though at a higher valuation multiple. Intel struggles with returns but invests heavily in R&D, risking near-term earnings for long-term innovation. Investors seeking growth with operational resilience may prefer Qnity, while those betting on turnaround potential might watch Intel closely.
Which one offers the Superior Shareholder Reward?
I compare Intel Corporation (INTC) and Qnity Electronics, Inc. (Q) on shareholder distributions in 2026. Intel offers no dividend currently, reflecting strained free cash flow (-1B FCF/share in 2025) and a cautious stance on buybacks amid negative net margins. Q pays no dividends either but invests heavily in growth, delivering strong free cash flow of 4.1B/share and a robust buyback program supported by a conservative debt profile (debt/assets 1.6%). Q’s payout policy, focused on reinvestment and share repurchases, aligns with sustainable value creation. I judge Q’s total shareholder return prospects superior to Intel’s, given Q’s healthier cash flow, disciplined capital allocation, and stronger profitability margins.
Comparative Score Analysis: The Strategic Profile
The radar chart reveals the core financial DNA and strategic trade-offs of Intel Corporation and Qnity Electronics, Inc.:
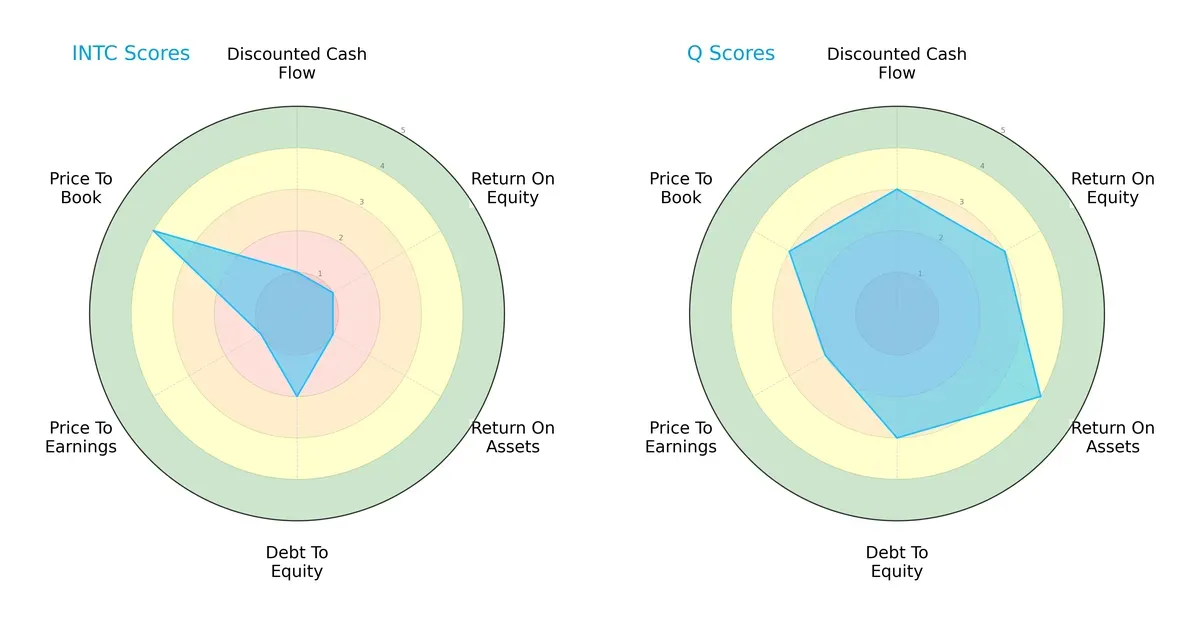
Intel shows pronounced weaknesses in DCF, ROE, and ROA scores, signaling operational and valuation challenges. Qnity balances moderate strengths across cash flow, profitability, and leverage metrics, offering a more harmonious financial profile. Intel relies heavily on a favorable price-to-book ratio, while Qnity maintains steadier fundamentals without a singular edge. Overall, Qnity presents a more balanced and resilient investment case in this sector.
Bankruptcy Risk: Solvency Showdown
Intel’s Altman Z-Score of 2.49 places it in the grey zone, implying moderate bankruptcy risk amid current market pressures:

Financial Health: Quality of Operations
Intel’s Piotroski F-Score of 4 indicates average financial health, revealing some internal operational weaknesses compared to stronger peers:

How are the two companies positioned?
This section dissects Intel and Qnity’s operational DNA by comparing their revenue distribution and internal strengths and weaknesses. The goal is to confront their economic moats and identify which business model offers the most resilient, sustainable advantage today.
Revenue Segmentation: The Strategic Mix
This visual comparison dissects how Intel Corporation and Qnity Electronics diversify their income streams and where their primary sector bets lie:
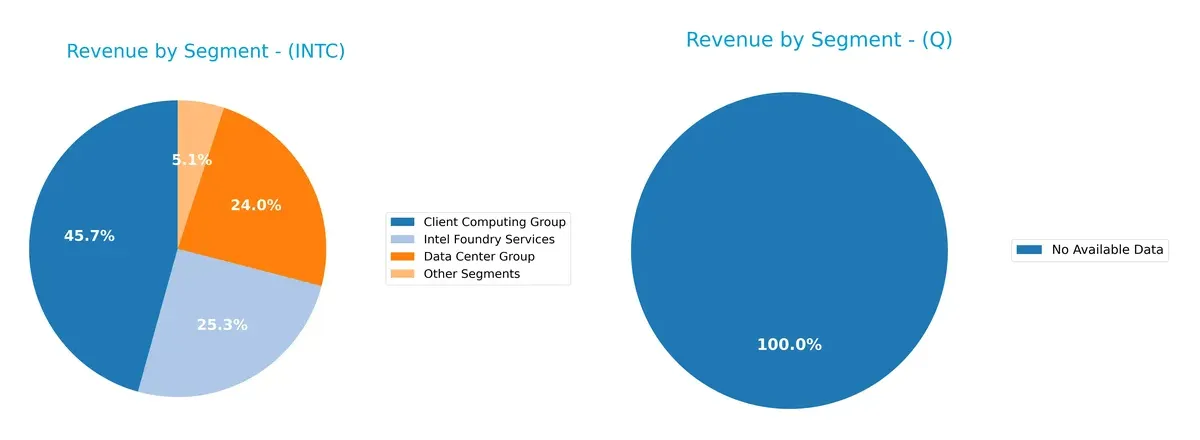
Intel Corporation anchors its revenue with a dominant Client Computing Group at $32.2B in 2025, while Data Center Group and Intel Foundry Services contribute $16.9B and $17.8B respectively. This mix shows strategic bets on infrastructure and foundry services, balancing ecosystem lock-in with emerging opportunities. Qnity Electronics lacks available data, preventing a direct comparison, which itself signals higher uncertainty and risk for diversification assessment.
Strengths and Weaknesses Comparison
This table compares the Strengths and Weaknesses of Intel Corporation and Qnity Electronics, Inc.:
Intel Corporation Strengths
- Diversified revenue streams across computing, data center, foundry, and IoT segments
- Strong global presence with significant sales in US, Singapore, Taiwan, China
- Favorable liquidity ratios: current ratio 2.02, quick ratio 1.65
- Moderate leverage with debt-to-assets 22% and debt/equity 0.41
Qnity Electronics, Inc. Strengths
- Positive net margin at 16% indicating profitability
- Favorable capital cost with WACC at 5.78%
- Strong liquidity with current ratio 1.77 and quick ratio 1.06
- Very low leverage: debt-to-assets 1.56%, debt/equity 0.02
Intel Corporation Weaknesses
- Negative profitability metrics: net margin -0.5%, ROE -0.23%, ROIC -0.02%
- Asset turnover metrics low, indicating inefficient asset use
- No dividend yield, signaling limited income return
- PE ratio negative despite neutral PB ratio
Qnity Electronics, Inc. Weaknesses
- ROE low at 6.5%, below market average
- PE ratio relatively high at 28.8, possibly overvalued
- Asset turnover below 0.4, indicating moderate efficiency
- No dividend yield, limiting income for investors
Intel’s strengths lie in its broad diversification and solid global footprint, but it struggles with profitability and asset efficiency. Qnity shows healthier profit margins and balance sheet conservatism but faces valuation and return on equity challenges. These factors shape their strategic priorities in operational efficiency and capital management.
The Moat Duel: Analyzing Competitive Defensibility
A structural moat is the only barrier protecting long-term profits from relentless competition erosion. Let’s dissect the competitive moats of two semiconductor players:
Intel Corporation: Legacy Scale with Innovation Challenges
Intel’s moat stems from scale and intangible assets like brand and IP. Historically, this supports stable margins but declining ROIC signals weakening capital efficiency. New AI and automotive chips could deepen the moat if executed flawlessly in 2026.
Qnity Electronics, Inc.: Niche Specialization in Materials
Qnity relies on a cost advantage and specialized materials in chip manufacturing. Unlike Intel’s scale, Qnity shows stable ROIC and superior margins. Its focused innovation pipeline offers room for expanding within advanced semiconductor materials markets.
Verdict: Scale and Brand vs. Specialized Cost Leadership
Intel’s wider moat from scale and brand faces shrinking profitability. Qnity’s narrower but stable moat benefits from targeted innovation and higher margins. I see Qnity better positioned to defend its niche against competitive pressures in 2026.
Which stock offers better returns?
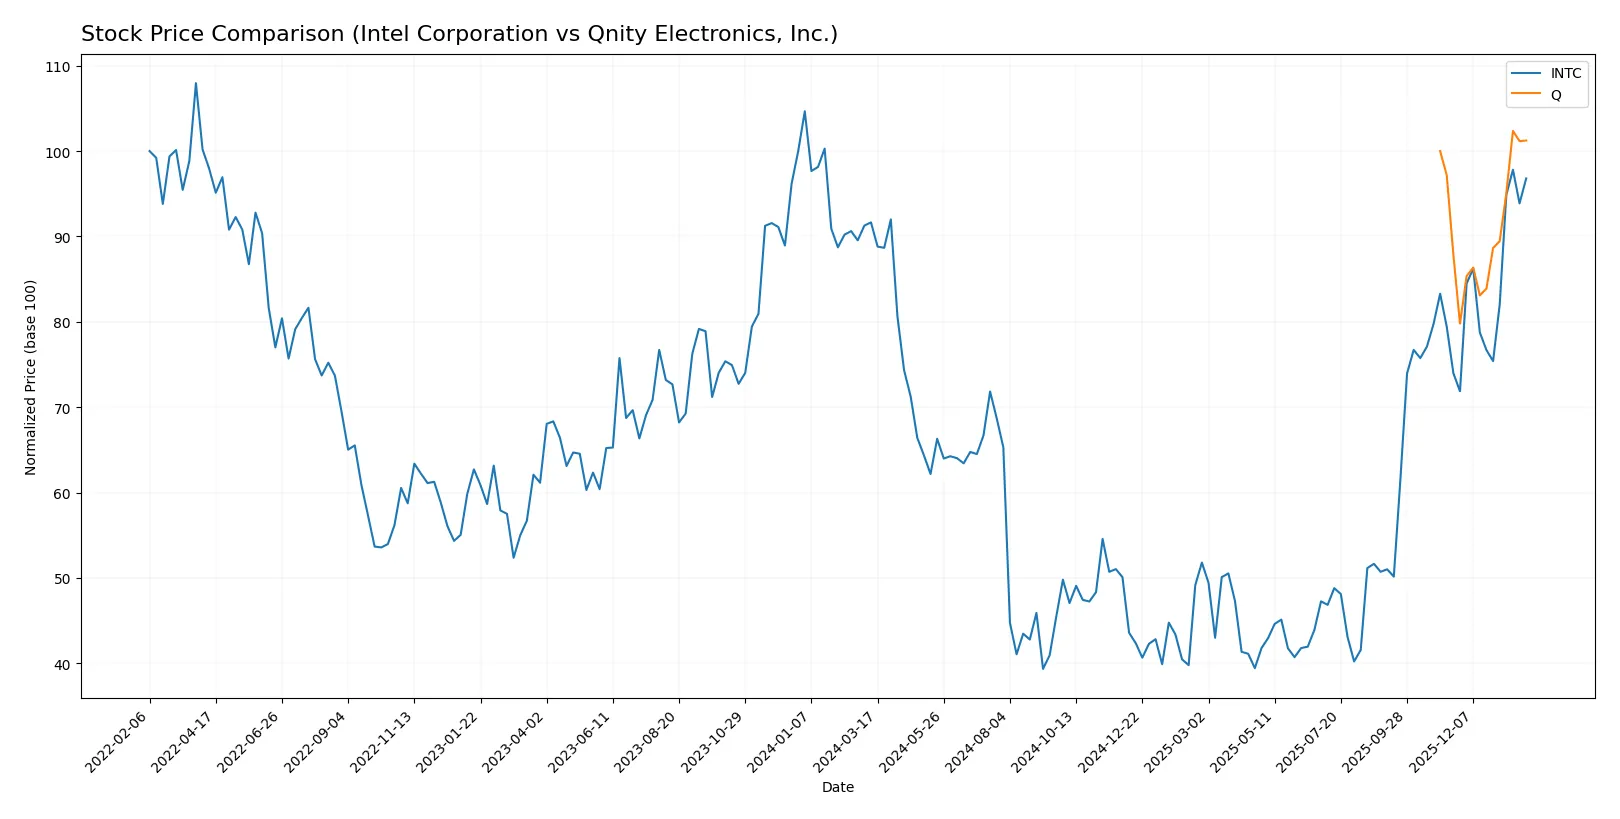
The past year shows Intel’s stock gaining steadily with accelerating momentum, while Qnity Electronics posts a mild overall rise despite recent sharper gains.
Trend Comparison
Intel’s stock price increased 5.61% over the past year, marking a bullish trend with accelerating gains and a high volatility of 8.11%. It reached a peak of 46.96 and a low of 18.89.
Qnity Electronics showed a 1.24% price increase, technically bullish but close to neutral. The trend accelerates recently, with moderate volatility of 7.09% and a range between 75.8 and 97.25.
Intel outperformed Qnity Electronics with a stronger overall return and notable acceleration, delivering the highest market performance in the analyzed period.
Target Prices
Analysts present a clear target consensus for both Intel Corporation and Qnity Electronics.
| Company | Target Low | Target High | Consensus |
|---|---|---|---|
| Intel Corporation | 20 | 66 | 46.95 |
| Qnity Electronics, Inc. | 92 | 118 | 106.78 |
Intel’s target consensus aligns closely with its current price of $46.47, suggesting limited upside. Qnity Electronics shows a strong bullish consensus, with targets roughly 11% above today’s $96.18 price.

Don’t Let Luck Decide Your Entry Point
Optimize your entry points with our advanced ProRealTime indicators. You’ll get efficient buy signals with precise price targets for maximum performance. Start outperforming now!
How do institutions grade them?
Intel Corporation Grades
The following table summarizes Intel’s recent institutional grades and recommendations:
| Grading Company | Action | New Grade | Date |
|---|---|---|---|
| RBC Capital | Maintain | Sector Perform | 2026-01-23 |
| Keybanc | Maintain | Overweight | 2026-01-23 |
| Evercore ISI Group | Maintain | In Line | 2026-01-23 |
| Needham | Maintain | Hold | 2026-01-23 |
| Benchmark | Maintain | Buy | 2026-01-23 |
| Rosenblatt | Maintain | Sell | 2026-01-23 |
| UBS | Maintain | Neutral | 2026-01-23 |
| Citigroup | Maintain | Neutral | 2026-01-23 |
| Stifel | Maintain | Hold | 2026-01-23 |
| Wedbush | Maintain | Neutral | 2026-01-23 |
Qnity Electronics, Inc. Grades
Below are the latest institutional grades issued for Qnity Electronics:
| Grading Company | Action | New Grade | Date |
|---|---|---|---|
| RBC Capital | Maintain | Outperform | 2025-11-25 |
| Mizuho | Maintain | Outperform | 2025-11-20 |
Which company has the best grades?
Qnity Electronics holds consistently stronger grades with two Outperform ratings. Intel’s grades are more mixed, spanning Buy to Sell. Investors may interpret Qnity’s higher consensus as greater institutional confidence.
Risks specific to each company
The following categories identify critical pressure points and systemic threats Intel Corporation and Qnity Electronics face in the 2026 market environment:
1. Market & Competition
Intel Corporation
- Faces intense competition from established semiconductor giants; market share pressure persists amid innovation demands.
Qnity Electronics, Inc.
- New player with emerging market presence; must rapidly scale to compete with incumbents and secure partnerships.
2. Capital Structure & Debt
Intel Corporation
- Maintains moderate leverage with a debt-to-equity ratio of 0.41, reflecting balanced financial risk management.
Qnity Electronics, Inc.
- Extremely low leverage at 0.02 debt-to-equity, indicating strong balance sheet and minimal financial risk.
3. Stock Volatility
Intel Corporation
- Beta of 1.354 signals above-market volatility, increasing exposure to market swings.
Qnity Electronics, Inc.
- Beta reported as 0, likely reflecting limited historical data, but suggests low volatility or data insufficiency.
4. Regulatory & Legal
Intel Corporation
- Highly regulated industry with ongoing scrutiny over antitrust and export controls; potential for costly compliance.
Qnity Electronics, Inc.
- As a newer entity, regulatory risks remain uncertain but include compliance with semiconductor material standards.
5. Supply Chain & Operations
Intel Corporation
- Complex global supply chain vulnerable to geopolitical disruptions and component shortages; operational efficiency is challenged.
Qnity Electronics, Inc.
- Supply chain still developing; risks stem from scaling operations and securing reliable material sources.
6. ESG & Climate Transition
Intel Corporation
- Faces pressure to reduce carbon footprint and improve sustainability amid investor and regulatory focus.
Qnity Electronics, Inc.
- ESG policies in early stages; must build credible climate transition strategy to meet market expectations.
7. Geopolitical Exposure
Intel Corporation
- Significant exposure to US-China tensions impacting manufacturing and sales in Asia-Pacific markets.
Qnity Electronics, Inc.
- Limited international footprint currently, reducing geopolitical risks but limiting growth opportunities abroad.
Which company shows a better risk-adjusted profile?
Intel’s greatest risk lies in market competition and operational complexities, compounded by stock volatility. Qnity’s primary concern is its nascent market position and scalability risks. Despite Intel’s size and established presence, Qnity’s low leverage and relatively stable financial ratios suggest a better risk-adjusted profile. Notably, Intel’s negative net margin and operational inefficiencies heighten caution, underscoring Qnity’s more favorable financial footing despite its youth.
Final Verdict: Which stock to choose?
Intel Corporation’s superpower lies in its scale and entrenched industry presence, offering a strong foundation for operational turnaround. However, its deteriorating profitability and value destruction signal a point of vigilance. It fits best in portfolios targeting deep value recovery plays with patience for a strategic reset.
Qnity Electronics, Inc. boasts a strategic moat through its stable profitability and efficient capital use, underpinned by a solid balance sheet and recurring cash flow. It presents a safer profile relative to Intel, appealing to investors favoring steady growth with moderate risk exposure.
If you prioritize turnaround potential and are willing to weather near-term uncertainty, Intel’s scale and ongoing improvements might outshine. However, if you seek better stability and a cleaner financial profile, Qnity offers a more attractive scenario with controlled risk and consistent profitability. Both present distinct analytical cases depending on your risk tolerance and investment horizon.
Disclaimer: Investment carries a risk of loss of initial capital. The past performance is not a reliable indicator of future results. Be sure to understand risks before making an investment decision.
Go Further
I encourage you to read the complete analyses of Intel Corporation and Qnity Electronics, Inc. to enhance your investment decisions: