Home > Comparison > Technology > INTC vs ONTO
The strategic rivalry between Intel Corporation and Onto Innovation Inc. shapes the semiconductor industry’s evolution. Intel, a capital-intensive technology giant, focuses on broad computer product platforms. Onto Innovation operates as a specialized process control tools provider, emphasizing precision and efficiency. This analysis pits scale against specialization, seeking to identify which trajectory offers superior risk-adjusted returns in a sector defined by rapid innovation and cyclical volatility.
Table of contents
Companies Overview
Intel Corporation and Onto Innovation Inc. both hold pivotal roles in the semiconductor industry, shaping technology’s backbone.
Intel Corporation: Semiconductor Giant with Broad Platform Reach
Intel commands the semiconductor sector with a diversified product portfolio including CPUs, chipsets, and system-on-chip packages. Its core revenue stems from platform products and high-performance compute solutions aimed at cloud providers, OEMs, and specific verticals such as healthcare. In 2026, Intel focuses strategically on advancing AI integration and autonomous driving technology, leveraging partnerships to enhance innovation.
Onto Innovation Inc.: Precision Metrology and Process Control Specialist
Onto Innovation leads in process control tools and analytical software critical for semiconductor manufacturing and advanced packaging. It generates revenue from defect inspection systems, lithography, and test services used by device manufacturers worldwide. In 2026, Onto prioritizes expanding its process and yield management solutions to support increasingly complex semiconductor fabrication demands.
Strategic Collision: Similarities & Divergences
Intel pursues a broad platform approach with integrated solutions, whereas Onto Innovation operates a focused niche in metrology and process control. They compete indirectly in semiconductor manufacturing’s ecosystem, with Intel dominating chip production and Onto enabling manufacturing precision. Their investment profiles diverge: Intel offers scale and innovation breadth, Onto delivers specialized expertise with higher growth potential in niche markets.
Income Statement Comparison
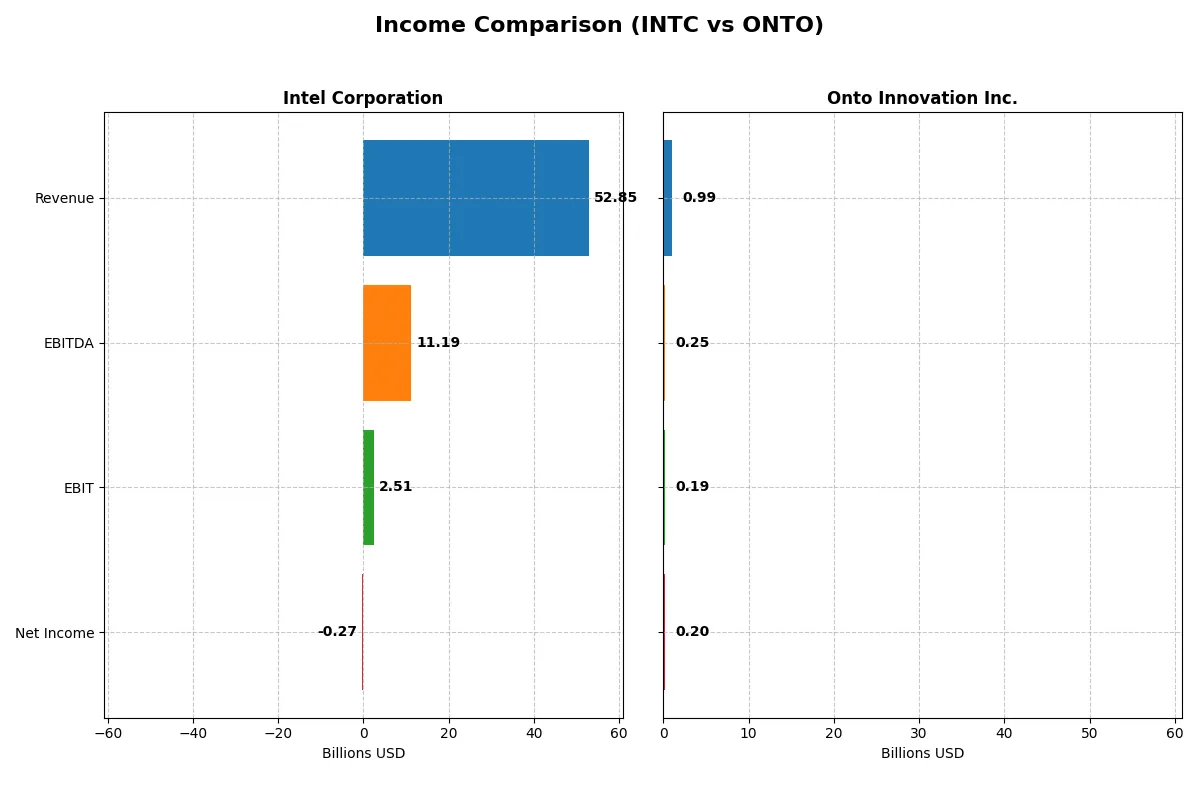
The following data dissects the core profitability and scalability of both corporate engines to reveal who dominates the bottom line:
| Metric | Intel Corporation (INTC) | Onto Innovation Inc. (ONTO) |
|---|---|---|
| Revenue | 52.9B | 987M |
| Cost of Revenue | 34.4B | 472M |
| Operating Expenses | 20.6B | 328M |
| Gross Profit | 18.5B | 515M |
| EBITDA | 11.2B | 249M |
| EBIT | 2.5B | 187M |
| Interest Expense | 953M | 0 |
| Net Income | -267M | 202M |
| EPS | -0.08 | 4.09 |
| Fiscal Year | 2025 | 2024 |
Income Statement Analysis: The Bottom-Line Duel
This income statement comparison reveals the true operational efficiency and profitability trends of two distinct semiconductor sector players.
Intel Corporation Analysis
Intel’s revenue declined from $79B in 2021 to $53B in 2025, reflecting a 33% drop over five years. Gross margins remain resilient around 35%, but net income swung from a $20B profit in 2021 to a $267M loss in 2025. Despite a sharp net margin contraction, the 2025 EBIT margin of 4.75% signals cautious operational recovery.
Onto Innovation Inc. Analysis
Onto Innovation’s revenue climbed steadily from $556M in 2020 to nearly $1B in 2024, a 77% growth. It sustains robust margins with a 52% gross margin and a 20% net margin in 2024. The company’s profitability surged, posting a $202M net income in 2024, reflecting strong momentum and efficient expense control.
Margin Resilience vs. Growth Momentum
Intel struggles with declining top-line and bottom-line performance, showing operational challenges despite solid gross margins. Onto Innovation delivers consistent revenue growth and expanding profitability, with superior margin profiles. For investors, Onto’s high-margin growth story presents a more attractive profile amid sector headwinds.
Financial Ratios Comparison
These vital ratios act as a diagnostic tool to expose the underlying fiscal health, valuation premiums, and capital efficiency of the companies compared below:
| Ratios | Intel Corporation (INTC) | Onto Innovation Inc. (ONTO) |
|---|---|---|
| ROE | -0.23% | 10.47% |
| ROIC | -0.02% | 8.77% |
| P/E | -658.4 | 41.76 |
| P/B | 1.54 | 4.37 |
| Current Ratio | 2.02 | 8.69 |
| Quick Ratio | 1.65 | 7.00 |
| D/E | 0.41 | 0.01 |
| Debt-to-Assets | 22.0% | 0.7% |
| Interest Coverage | -2.23 | 0 |
| Asset Turnover | 0.25 | 0.47 |
| Fixed Asset Turnover | 0.50 | 7.16 |
| Payout Ratio | 0 | 0 |
| Dividend Yield | 0 | 0 |
| Fiscal Year | 2025 | 2024 |
Efficiency & Valuation Duel: The Vital Signs
Financial ratios act as the company’s DNA, revealing hidden risks and operational excellence essential for investment decisions.
Intel Corporation
Intel’s core profitability falters with negative ROE and margins, signaling operational challenges. Its valuation looks inexpensive given a negative P/E, but free cash flow remains deeply negative. Shareholders see no dividends; instead, Intel aggressively reinvests in R&D, aiming to spark future growth despite current inefficiencies.
Onto Innovation Inc.
Onto Innovation posts strong net margins and modest ROE, reflecting operational efficiency. Its valuation appears stretched, with a P/E over 40 and a high price-to-book ratio. The company retains earnings, funneling cash into growth and innovation rather than dividends, supported by a rock-solid balance sheet and positive free cash flow.
Valuation Stretch vs. Profitability Struggles
Intel’s undervalued price contrasts with weak profitability and cash flow, exposing risk despite a reasonable balance sheet. Onto Innovation balances solid returns with a premium valuation, reflecting growth optimism. Intel suits cautious investors prioritizing value; Onto appeals to those targeting growth with tolerance for higher multiples.
Which one offers the Superior Shareholder Reward?
Intel Corporation (INTC) currently pays no dividends and generates negative free cash flow (-1B in 2025), limiting its distribution capacity. Its buyback activity is muted amid uneven profitability and leverage risks. Onto Innovation Inc. (ONTO) pays no dividend but boasts robust free cash flow (4.3B in 2024) and minimal debt, fueling a strong buyback potential. Onto’s capital efficiency and sustainable cash generation support shareholder rewards better than Intel’s strained payout stance. I conclude Onto offers a more attractive total return profile for 2026 investors.
Comparative Score Analysis: The Strategic Profile
The radar chart reveals the fundamental DNA and trade-offs of Intel Corporation and Onto Innovation Inc., highlighting their financial strengths and vulnerabilities:
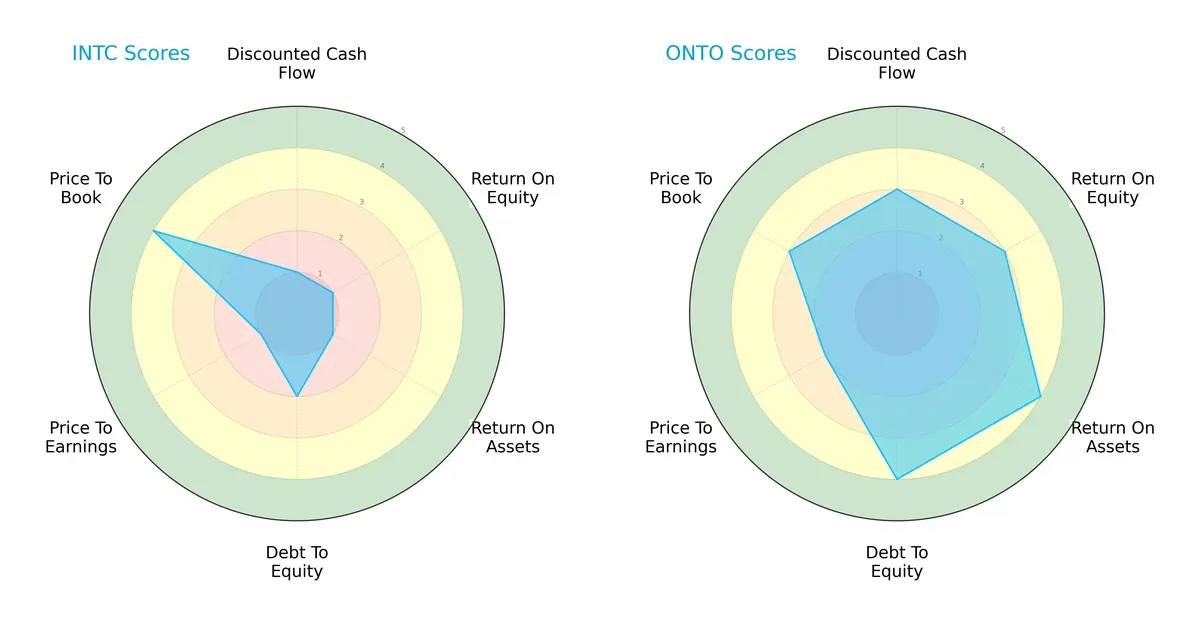
Intel shows a heavily skewed profile with very low scores in DCF, ROE, ROA, and P/E, but a favorable P/B ratio. Onto Innovation delivers a more balanced and healthier scorecard, excelling in ROA, Debt/Equity, and DCF metrics. Onto relies on broad operational efficiency, while Intel depends on asset valuation strength.
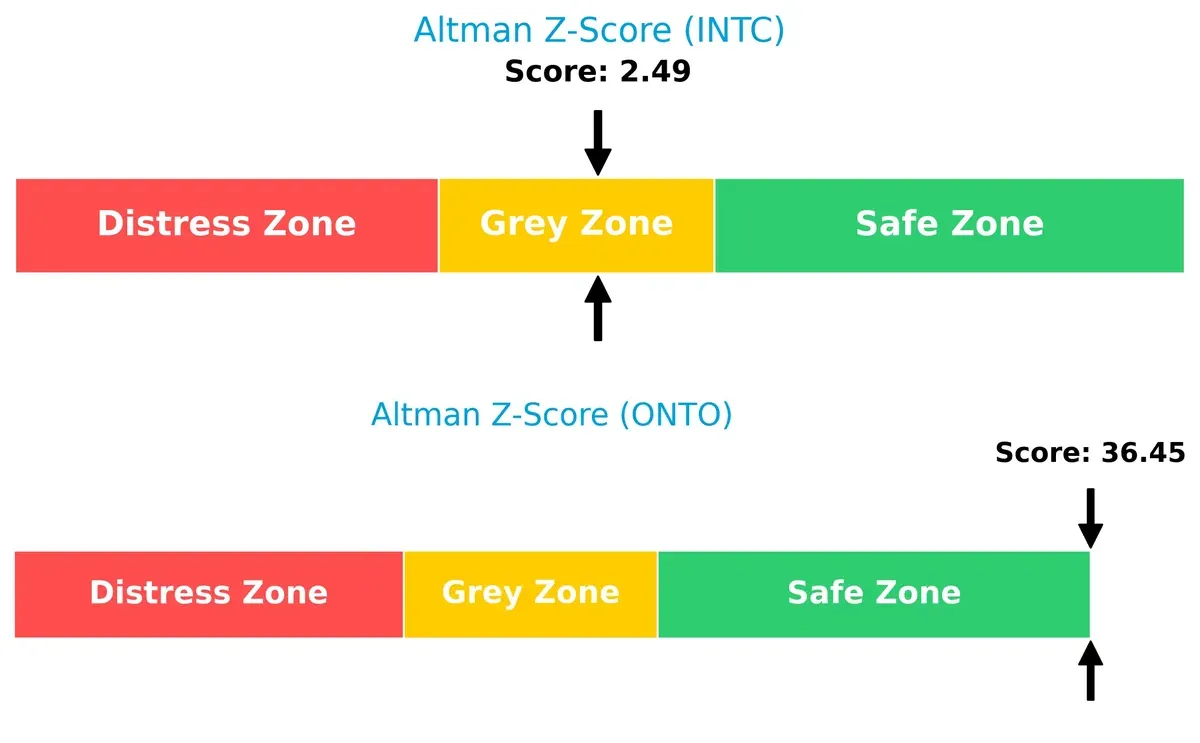
Bankruptcy Risk: Solvency Showdown
The Altman Z-Score delta signals a stark contrast: Onto Innovation’s high score places it firmly in the safe zone, suggesting robust financial stability. Intel lingers in the grey zone, indicating moderate bankruptcy risk in this cycle:
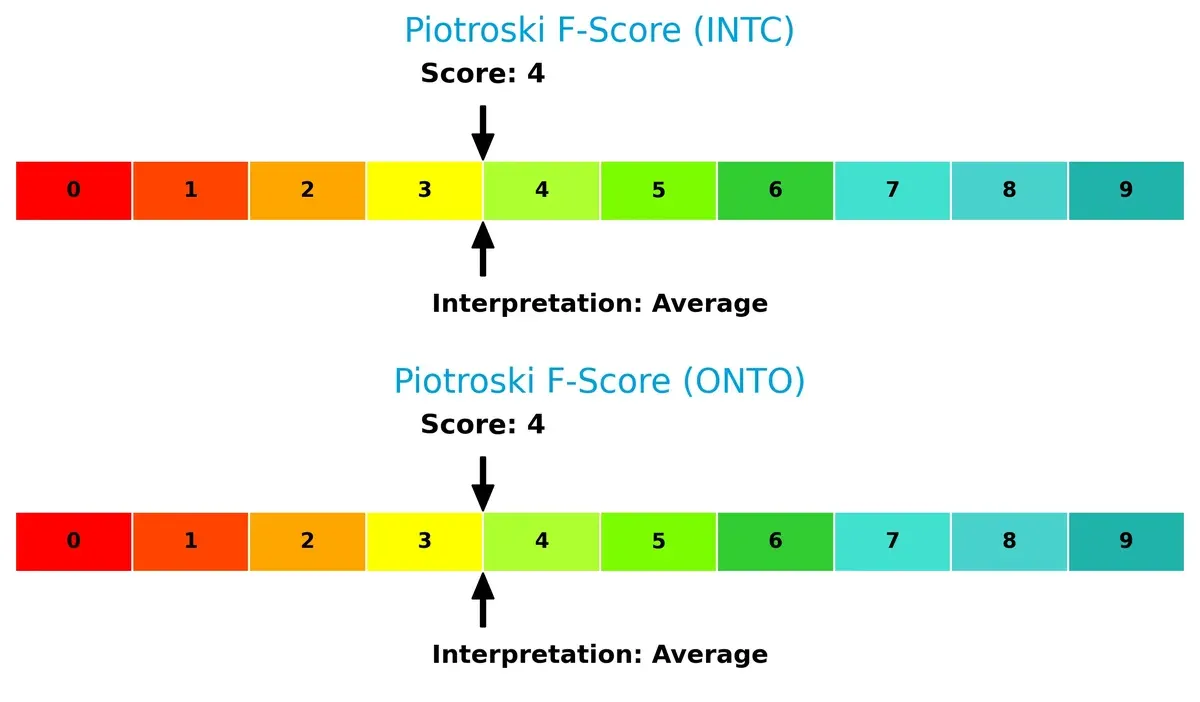
Financial Health: Quality of Operations
Both firms post average Piotroski F-Scores of 4, signaling moderate financial health. Neither company exhibits clear red flags, but this score calls for caution as neither shows peak operational strength:
How are the two companies positioned?
This section dissects Intel and Onto’s operational DNA by comparing their revenue distribution and internal strengths and weaknesses. The goal is to confront their economic moats to reveal which model sustains the strongest competitive advantage today.
Revenue Segmentation: The Strategic Mix
This visual comparison dissects how Intel Corporation and Onto Innovation Inc. diversify their income streams and where their primary sector bets lie:
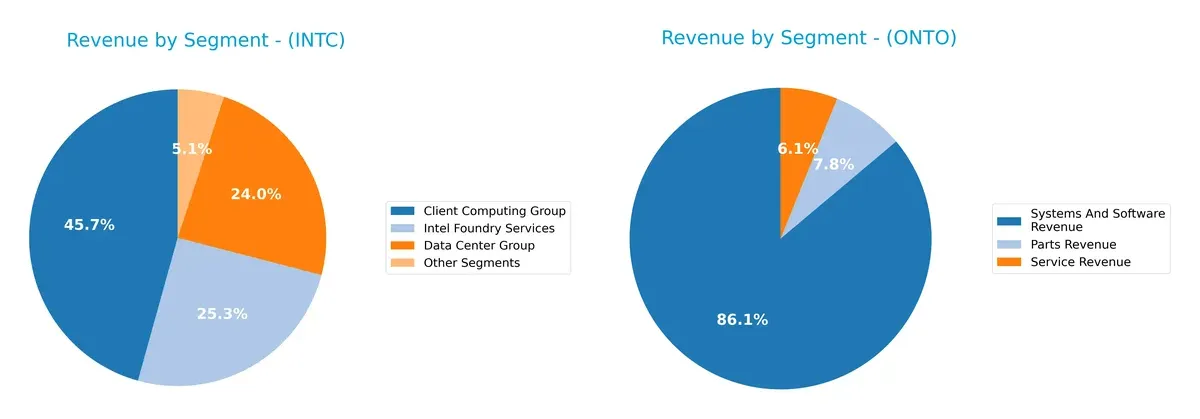
Intel’s revenue pivots across major segments: Client Computing Group leads with $32.2B, closely followed by Intel Foundry Services at $17.8B and Data Center Group at $16.9B. Onto Innovation concentrates heavily on Systems And Software Revenue, which dwarfs Parts and Service Revenues at $850M versus $77M combined. Intel shows a balanced ecosystem lock-in across computing and foundry services, while Onto’s reliance on software underscores concentration risk but signals strong niche dominance.
Strengths and Weaknesses Comparison
This table compares the Strengths and Weaknesses of Intel Corporation and Onto Innovation Inc.:
Intel Corporation Strengths
- Diverse revenue streams across multiple segments
- Strong global presence with significant sales in US, China, Singapore
- Favorable liquidity ratios indicate solid short-term financial health
Onto Innovation Inc. Strengths
- High net margin reflects operational efficiency
- Favorable quick ratio and low debt levels signal financial stability
- Strong fixed asset turnover suggests efficient asset use
Intel Corporation Weaknesses
- Negative profitability ratios indicate losses
- Unfavorable asset turnover ratios show inefficiency
- No dividend yield may deter income-focused investors
Onto Innovation Inc. Weaknesses
- Unfavorable valuation multiples indicate possible overvaluation
- Unfavorable current ratio hints at liquidity concerns
- Higher WACC than ROIC suggests costly capital
Intel’s diversified operations and global footprint provide resilience, but profitability challenges persist. Onto Innovation shows efficient asset use and strong margins but faces liquidity and valuation risks that could impact strategy.
The Moat Duel: Analyzing Competitive Defensibility
A structural moat is the only reliable shield protecting long-term profits from relentless competition erosion. Let’s examine how these two firms fare:
Intel Corporation: Scale and Integration Moat
Intel’s competitive edge lies in its massive scale and integrated manufacturing. Its income shows margin stability despite recent net losses. New AI and automotive chips could deepen its moat in 2026.
Onto Innovation Inc.: Niche Technology Moat
Onto thrives on specialized process control tools, contrasting Intel’s scale. It delivers high margins and growing ROIC, signaling efficient capital use. Expansion in advanced packaging markets could strengthen its position.
Scale Dominance vs. Specialized Innovation
Intel’s vast footprint is offset by declining ROIC and value destruction risks. Onto’s narrower but improving moat shows growing profitability and operational efficiency. Onto is better poised to defend and expand its market share.
Which stock offers better returns?
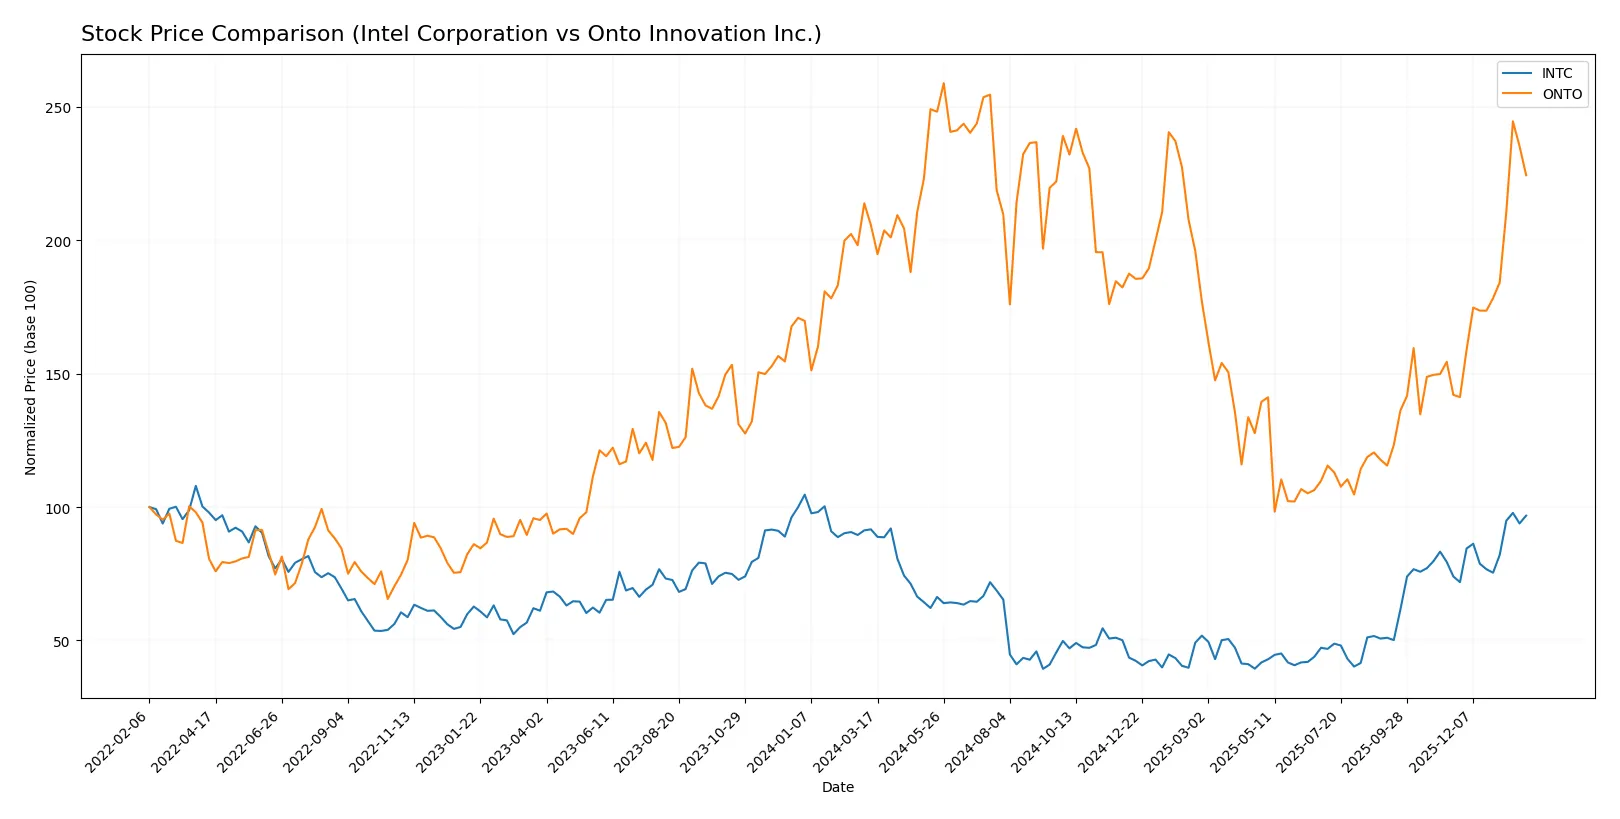
Over the past 12 months, both Intel Corporation and Onto Innovation Inc. demonstrated bullish trends with accelerating price gains, reflecting strong upward momentum in their stock prices.
Trend Comparison
Intel Corporation’s stock rose 5.61% over the past year, showing an accelerating bullish trend with moderate volatility (8.11% std deviation). It hit a high of 46.96 and a low of 18.89.
Onto Innovation Inc. outperformed with a 9.1% price increase over 12 months, also accelerating but with significantly higher volatility at 42.99%. Its price ranged between 88.5 and 233.14.
Comparing both, Onto Innovation delivered the highest market performance, outperforming Intel by nearly 3.5 percentage points despite elevated price volatility.
Target Prices
Analysts present a mixed but generally optimistic target consensus for these semiconductor names.
| Company | Target Low | Target High | Consensus |
|---|---|---|---|
| Intel Corporation | 20 | 66 | 46.95 |
| Onto Innovation Inc. | 160 | 260 | 191.67 |
Intel’s consensus target of $46.95 closely aligns with its current price, signaling modest upside. Onto Innovation’s target consensus implies a 5% potential downside from present levels, reflecting cautious optimism.

Don’t Let Luck Decide Your Entry Point
Optimize your entry points with our advanced ProRealTime indicators. You’ll get efficient buy signals with precise price targets for maximum performance. Start outperforming now!
How do institutions grade them?
Intel Corporation Grades
The table below lists recent grades assigned to Intel Corporation by major grading firms.
| Grading Company | Action | New Grade | Date |
|---|---|---|---|
| RBC Capital | Maintain | Sector Perform | 2026-01-23 |
| Keybanc | Maintain | Overweight | 2026-01-23 |
| Evercore ISI Group | Maintain | In Line | 2026-01-23 |
| Needham | Maintain | Hold | 2026-01-23 |
| Benchmark | Maintain | Buy | 2026-01-23 |
| Rosenblatt | Maintain | Sell | 2026-01-23 |
| UBS | Maintain | Neutral | 2026-01-23 |
| Citigroup | Maintain | Neutral | 2026-01-23 |
| Stifel | Maintain | Hold | 2026-01-23 |
| Wedbush | Maintain | Neutral | 2026-01-23 |
Onto Innovation Inc. Grades
Below are the most recent institutional grades for Onto Innovation Inc. from several analysts.
| Grading Company | Action | New Grade | Date |
|---|---|---|---|
| Needham | Maintain | Buy | 2026-01-20 |
| B. Riley Securities | Maintain | Buy | 2026-01-15 |
| Stifel | Maintain | Hold | 2026-01-14 |
| Needham | Maintain | Buy | 2026-01-06 |
| Jefferies | Maintain | Buy | 2025-12-15 |
| Needham | Maintain | Buy | 2025-11-18 |
| B. Riley Securities | Maintain | Buy | 2025-11-18 |
| Evercore ISI Group | Maintain | Outperform | 2025-11-05 |
| Oppenheimer | Maintain | Outperform | 2025-10-14 |
| Stifel | Maintain | Hold | 2025-10-13 |
Which company has the best grades?
Onto Innovation holds consistently stronger grades, predominantly Buy and Outperform. Intel’s ratings spread from Buy to Sell, reflecting mixed sentiment. Investors may see Onto as having higher institutional confidence.
Risks specific to each company
The following categories identify critical pressure points and systemic threats facing both Intel Corporation and Onto Innovation Inc. in the challenging 2026 market environment:
1. Market & Competition
Intel Corporation
- Faces intense competition from global semiconductor giants, pressuring margins and innovation cycles.
Onto Innovation Inc.
- Operates in a niche segment with specialized process control tools but faces competition from larger equipment makers.
2. Capital Structure & Debt
Intel Corporation
- Maintains moderate leverage (D/E 0.41) with favorable debt metrics but interest coverage is only neutral at 2.63x.
Onto Innovation Inc.
- Exhibits extremely low leverage (D/E 0.01) with excellent interest coverage, reflecting a very strong balance sheet.
3. Stock Volatility
Intel Corporation
- Beta of 1.35 indicates above-market volatility, reflecting sensitivity to tech sector swings.
Onto Innovation Inc.
- Higher beta of 1.46 suggests even greater volatility, likely due to smaller market cap and growth profile.
4. Regulatory & Legal
Intel Corporation
- Subject to scrutiny over antitrust and export controls given its size and geopolitical footprint.
Onto Innovation Inc.
- Faces regulatory risks typical of tech equipment makers but less exposed to large-scale trade restrictions.
5. Supply Chain & Operations
Intel Corporation
- Complex global supply chains vulnerable to geopolitical tensions and component shortages.
Onto Innovation Inc.
- Smaller scale allows more agile supply chain but relies on specialized components with limited suppliers.
6. ESG & Climate Transition
Intel Corporation
- Increasing pressure to reduce carbon footprint and manage ESG risks across extensive manufacturing operations.
Onto Innovation Inc.
- ESG initiatives less mature but benefits from lighter operational footprint and innovation focus.
7. Geopolitical Exposure
Intel Corporation
- Large exposure to US-China tensions impacting production, sales, and technology transfers.
Onto Innovation Inc.
- Limited direct geopolitical exposure but indirect risks through customer base and supply chain.
Which company shows a better risk-adjusted profile?
Intel’s largest risk is geopolitical exposure coupled with operational complexity that threatens margins and supply reliability. Onto Innovation’s main risk lies in elevated stock volatility and valuation multiples that pressure downside risk. Despite Intel’s macro risks, Onto’s smaller scale and higher valuation amplify its volatility. Intel’s moderate leverage and stronger liquidity offer a steadier risk profile. Recent data highlight Intel’s neutral interest coverage and grey zone Altman Z-score, signaling moderate financial stress. Onto’s safe zone Z-score and low debt are positives but offset by higher beta and valuation risks. Overall, Intel presents a more balanced risk-adjusted profile amid 2026 uncertainties.
Final Verdict: Which stock to choose?
Intel Corporation’s superpower lies in its scale and established industry presence, offering resilience amid cyclical pressures. However, its declining profitability and value destruction signal a point of vigilance. Intel fits portfolios seeking potential turnaround plays with exposure to legacy semiconductor strength.
Onto Innovation Inc. boasts a strategic moat with accelerating profitability and efficient capital use. Its growing ROIC trend and robust free cash flow highlight operational strength. Compared to Intel, Onto offers better financial stability but commands a premium. It suits growth-focused portfolios prioritizing innovation leadership.
If you prioritize deep value and scale with potential for cyclical recovery, Intel is the compelling choice despite current headwinds. However, if you seek growth with improving profitability and operational efficiency, Onto outshines by delivering better stability and momentum in a smaller, innovative niche.
Disclaimer: Investment carries a risk of loss of initial capital. The past performance is not a reliable indicator of future results. Be sure to understand risks before making an investment decision.
Go Further
I encourage you to read the complete analyses of Intel Corporation and Onto Innovation Inc. to enhance your investment decisions: