Home > Comparison > Technology > INTC vs NXPI
The strategic rivalry between Intel Corporation and NXP Semiconductors defines the current trajectory of the semiconductor industry. Intel operates as a capital-intensive giant with a broad portfolio spanning CPUs, chipsets, and high-performance computing platforms. In contrast, NXP focuses on specialized microcontrollers and connectivity solutions for automotive and IoT markets. This analysis will reveal which company’s operational model offers a superior risk-adjusted return for a diversified technology portfolio.
Table of contents
Companies Overview
Two semiconductor giants, Intel Corporation and NXP Semiconductors, command significant influence in global chip markets.
Intel Corporation: The Computing Powerhouse
Intel dominates as a leading semiconductor designer and manufacturer. Its core revenue derives from central processing units, chipsets, and system-on-chip products. In 2026, Intel’s strategic focus sharpens on high-performance compute solutions and AI-enhanced autonomous driving platforms, targeting cloud providers and industrial sectors to drive future growth.
NXP Semiconductors N.V.: The Connectivity Specialist
NXP excels as a semiconductor innovator specializing in microcontrollers and wireless connectivity. It generates revenue mainly through automotive and IoT applications by selling processors, sensors, and communication chips. In 2026, NXP prioritizes expanding its portfolio in secure wireless solutions and automotive technologies, emphasizing safety and connectivity.
Strategic Collision: Similarities & Divergences
Intel and NXP pursue distinct philosophies; Intel focuses on broad compute infrastructure, while NXP specializes in niche connectivity and sensor markets. They primarily compete in automotive and industrial IoT segments. Their investment profiles differ sharply: Intel offers scale and diversification, whereas NXP provides targeted innovation in wireless and embedded systems.
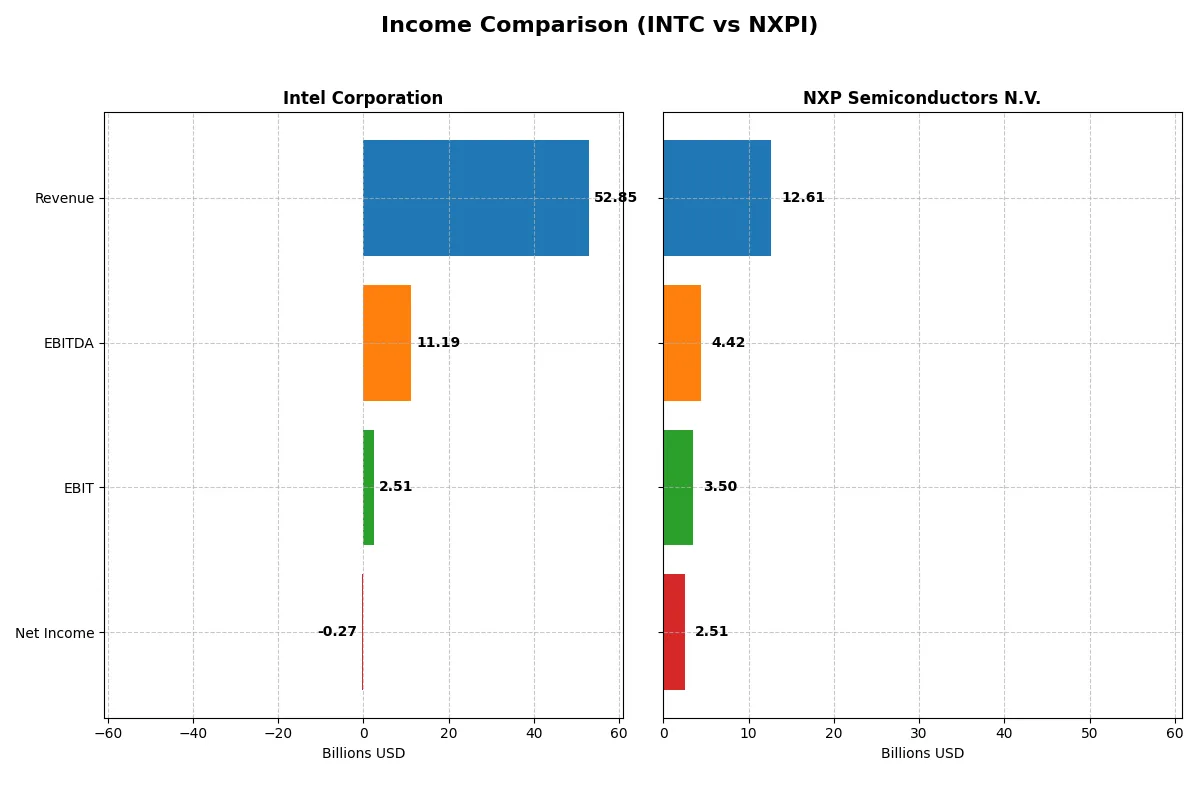
Income Statement Comparison
The following data dissects the core profitability and scalability of both corporate engines to reveal who dominates the bottom line:
| Metric | Intel Corporation (INTC) | NXP Semiconductors N.V. (NXPI) |
|---|---|---|
| Revenue | 52.9B | 12.6B |
| Cost of Revenue | 34.4B | 5.5B |
| Operating Expenses | 20.6B | 3.7B |
| Gross Profit | 18.5B | 7.1B |
| EBITDA | 11.2B | 4.4B |
| EBIT | 2.5B | 3.5B |
| Interest Expense | 953M | 398M |
| Net Income | -267M | 2.5B |
| EPS | -0.08 | 9.84 |
| Fiscal Year | 2025 | 2024 |
Income Statement Analysis: The Bottom-Line Duel
This income statement comparison reveals which company converts revenue into profit more efficiently and sustainably over recent years.
Intel Corporation Analysis
Intel’s revenue slid from 79B in 2021 to 53B in 2025, reflecting a 33% decline overall. Net income turned sharply negative in 2024 (-18.8B) and slightly improved to a small loss (-267M) in 2025. Gross margin remains solid near 35%, but the net margin fell below zero, signaling struggles in controlling costs and profitability despite a recent EBIT rebound.
NXP Semiconductors N.V. Analysis
NXP grew revenue steadily from 8.6B in 2020 to 13B in 2023 before a slight dip to 12.6B in 2024. Net income soared from 52M in 2020 to 2.8B in 2023, then eased to 2.5B in 2024. Margins remain robust with a gross margin above 56% and net margin near 20%, demonstrating consistent operational efficiency and strong profit conversion despite a mild recent slowdown.
Margin Strength vs. Revenue Resilience
NXP clearly outperforms Intel in profitability and margin sustainability. Intel’s steep revenue and net income declines underscore operational challenges, despite marginal improvements in EBIT. NXP’s higher and more stable margins make it a fundamentally stronger profit generator. Investors prioritizing earnings quality will find NXP’s profile more attractive.
Financial Ratios Comparison
These vital ratios act as a diagnostic tool to expose the underlying fiscal health, valuation premiums, and capital efficiency of these semiconductor companies:
| Ratios | Intel Corporation (INTC) | NXP Semiconductors N.V. (NXPI) |
|---|---|---|
| ROE | -0.23% | 27.33% |
| ROIC | -0.02% | 12.91% |
| P/E | -658.38 | 21.13 |
| P/B | 1.54 | 5.78 |
| Current Ratio | 2.02 | 2.36 |
| Quick Ratio | 1.65 | 1.60 |
| D/E | 0.41 | 1.18 |
| Debt-to-Assets | 22.03% | 44.51% |
| Interest Coverage | -2.23 | 8.59 |
| Asset Turnover | 0.25 | 0.52 |
| Fixed Asset Turnover | 0.50 | 3.86 |
| Payout Ratio | 0 | 41.35% |
| Dividend Yield | 0% | 1.96% |
| Fiscal Year | 2025 | 2024 |
Efficiency & Valuation Duel: The Vital Signs
Financial ratios act as the company’s DNA, uncovering hidden risks and operational strengths that drive long-term value creation.
Intel Corporation
Intel shows weak profitability with negative ROE and margins, signaling operational challenges. Its P/E ratio is unusually negative, indicating earnings instability, while a P/S ratio near 4 suggests a stretched valuation. Intel currently pays no dividends, instead prioritizing heavy R&D reinvestment, reflecting a growth-focused but risk-laden capital allocation approach.
NXP Semiconductors N.V.
NXP boasts strong profitability with ROE above 27% and a favorable 20% net margin, highlighting efficient operations. Its P/E of 21 is reasonable but paired with a high P/B near 5.8, indicating premium valuation. NXP distributes modest dividends and maintains solid cash flow, blending shareholder returns with sustained R&D investment for growth.
Premium Valuation vs. Operational Safety
NXP combines robust profitability with balanced valuation, offering a better risk-reward balance compared to Intel’s operational struggles and stretched multiples. Investors seeking stable returns and efficient capital use may find NXP’s profile more suitable, while Intel’s turnaround remains uncertain amid its reinvestment-heavy strategy.
Which one offers the Superior Shareholder Reward?
I observe that NXP Semiconductors (NXPI) delivers a more attractive shareholder reward than Intel (INTC) in 2026. NXPI pays a consistent dividend yield near 1.95% with a sustainable payout ratio around 41%, well-covered by strong free cash flow (8B FCF vs. 3B capex). Intel, by contrast, suspended dividends in 2025 with a negative free cash flow of -1B, signaling payout risk. NXPI also executes robust buybacks fueled by steady operating cash flow (11B), while Intel’s buyback intensity has diminished amid shrinking profits. Historically, NXPI’s balanced distribution—moderate dividends plus share repurchases—aligns with sustainable capital allocation and long-term value creation. I conclude NXPI offers superior total return potential, combining reliable income and growth-friendly buybacks, unlike Intel’s current cash flow strain and dividend hiatus.
Comparative Score Analysis: The Strategic Profile
The radar chart reveals the fundamental DNA and trade-offs of Intel Corporation and NXP Semiconductors N.V., highlighting their core financial strengths and weaknesses:
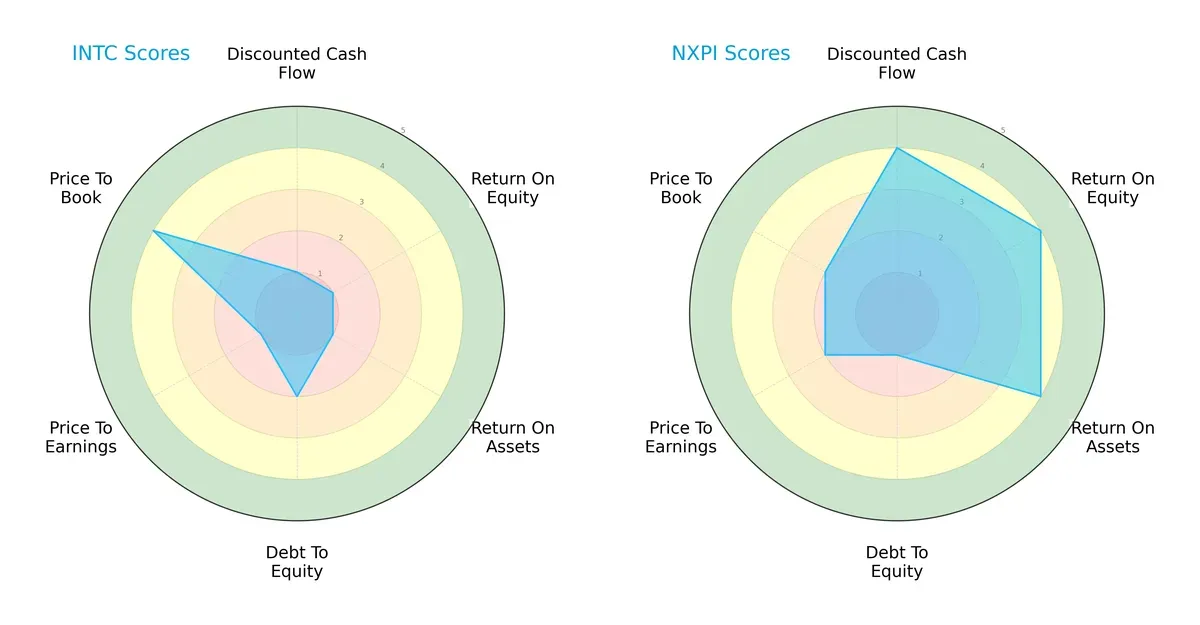
Intel shows a heavily unbalanced profile, excelling only in price-to-book valuation (score 4) but lagging badly in DCF, ROE, ROA, and P/E metrics (scores all 1). NXP boasts a more balanced setup with solid DCF, ROE, and ROA scores (all 4), though it carries a higher debt burden (score 1). NXP’s diversified strengths suggest better operational efficiency, while Intel relies on valuation appeal amid fundamental weaknesses.
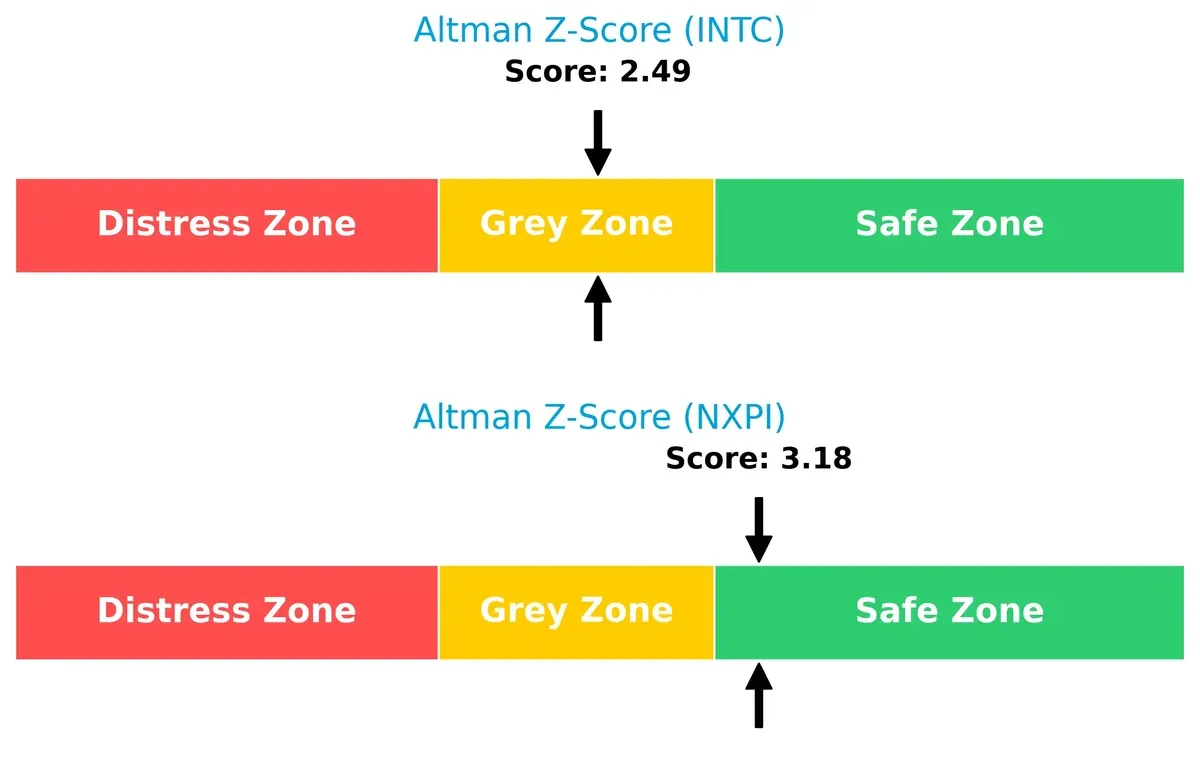
Bankruptcy Risk: Solvency Showdown
NXP’s Altman Z-Score of 3.18 places it safely above Intel’s 2.49 in the grey zone, signaling stronger long-term survival odds in this volatile cycle:
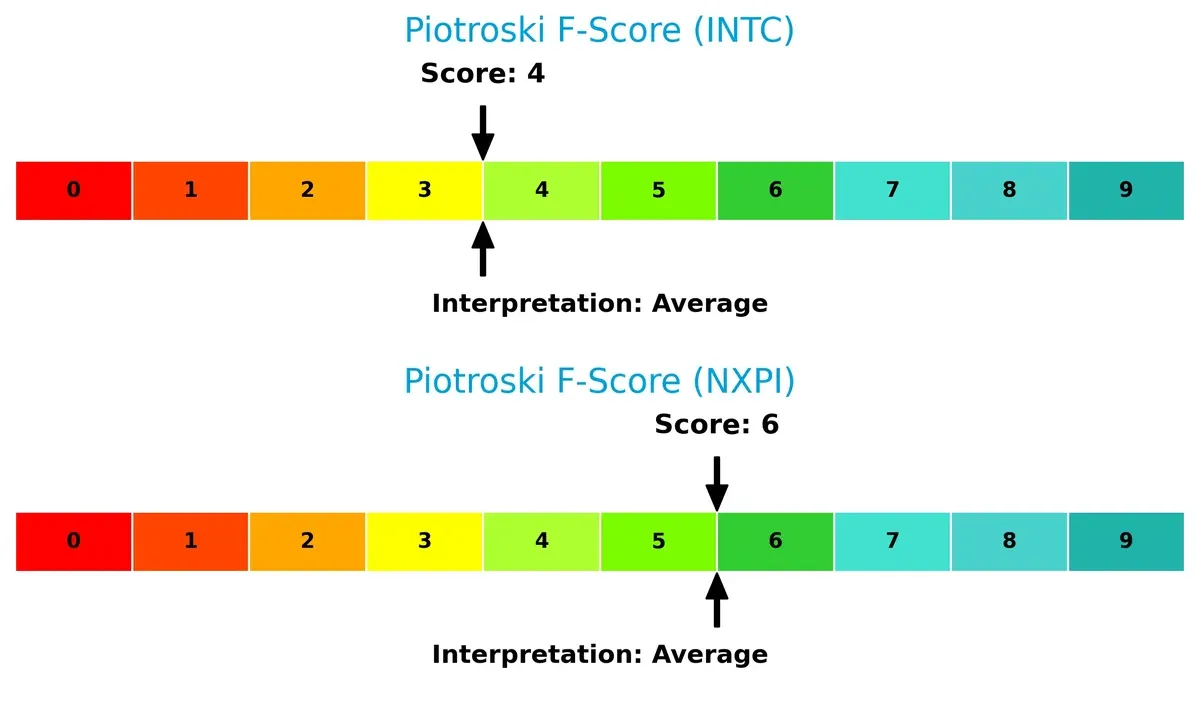
Financial Health: Quality of Operations
NXP leads with a Piotroski F-Score of 6 versus Intel’s 4, indicating healthier internal fundamentals and fewer red flags in profitability and liquidity metrics:
How are the two companies positioned?
This section dissects Intel and NXP’s operational DNA by comparing their revenue distribution and internal strengths and weaknesses. The goal is to confront their economic moats to identify which model offers a more resilient, sustainable advantage today.
Revenue Segmentation: The Strategic Mix
This comparison dissects how Intel Corporation and NXP Semiconductors diversify their income streams and where their primary sector bets lie:
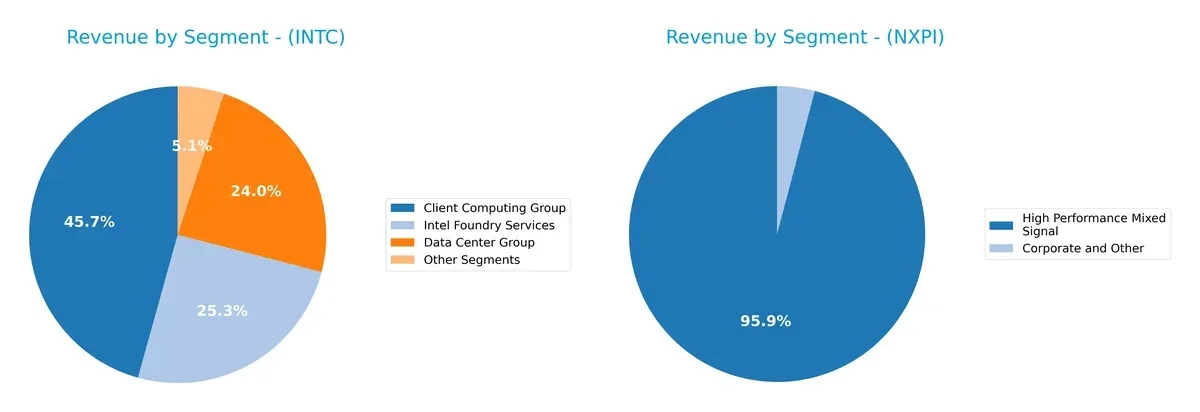
Intel’s 2025 revenue centers on three main segments: Client Computing Group at $32.2B, Intel Foundry Services at $17.8B, and Data Center Group at $16.9B. This mix shows moderate diversification but leans on Client Computing as the anchor. NXP, in 2018, relies heavily on High Performance Mixed Signal at $9B, with minimal contribution from Corporate and Other at $385M, signaling concentration risk. Intel’s broader portfolio offers more ecosystem lock-in and infrastructure dominance compared to NXP’s focused approach.
Strengths and Weaknesses Comparison
This table compares the strengths and weaknesses of Intel Corporation and NXP Semiconductors N.V.:
Intel Corporation Strengths
- Diverse revenue from Client Computing, Data Center, Foundry, IoT segments
- Strong global sales including US, Singapore, Taiwan
- Favorable liquidity ratios indicate solid short-term financial health
NXP Semiconductors N.V. Strengths
- High profitability with strong net margin, ROE, and ROIC
- Efficient asset and fixed asset turnover ratios
- Favorable interest coverage supports debt servicing capacity
Intel Corporation Weaknesses
- Negative profitability metrics including net margin, ROE, and ROIC
- Low asset turnover suggests inefficiency
- No dividend yield limits income appeal
- Moderate leverage with neutral interest coverage
NXP Semiconductors N.V. Weaknesses
- High debt-to-equity ratio signals high leverage risk
- Unfavorable price-to-book ratio implies potential overvaluation
- Moderate current ratio and quick ratio compared to INTC
Intel shows strength in diversified product segments and geographic reach but suffers from weak profitability and operational efficiency. NXP excels in profitability and asset use but carries higher financial risk due to leverage and valuation concerns. Both companies’ strengths and weaknesses guide their strategic focus areas in 2026.
The Moat Duel: Analyzing Competitive Defensibility
A structural moat is the only barrier protecting long-term profits from relentless competitive erosion. Let’s dissect the moats of two semiconductor giants:
Intel Corporation: Legacy Scale and Platform Integration
Intel’s moat stems from deep-scale manufacturing and platform integration. Despite recent margin pressures, its wide moat historically drives stable gross margins around 35%. However, declining ROIC signals looming risks to its competitive edge in 2026.
NXP Semiconductors N.V.: Niche Specialization and Innovation
NXP’s moat relies on specialized analog and connectivity chips, delivering superior ROIC above WACC and robust 56% gross margins. Its focused innovation fuels expanding profitability and a rising moat in a fragmented market.
Scale Dominance vs. Specialized Innovation
NXP commands the deeper moat with expanding returns and sustainable value creation. Intel’s fading ROIC and shrinking margins expose vulnerability. NXP stands better poised to defend and grow its market share through innovation-led specialization.
Which stock offers better returns?
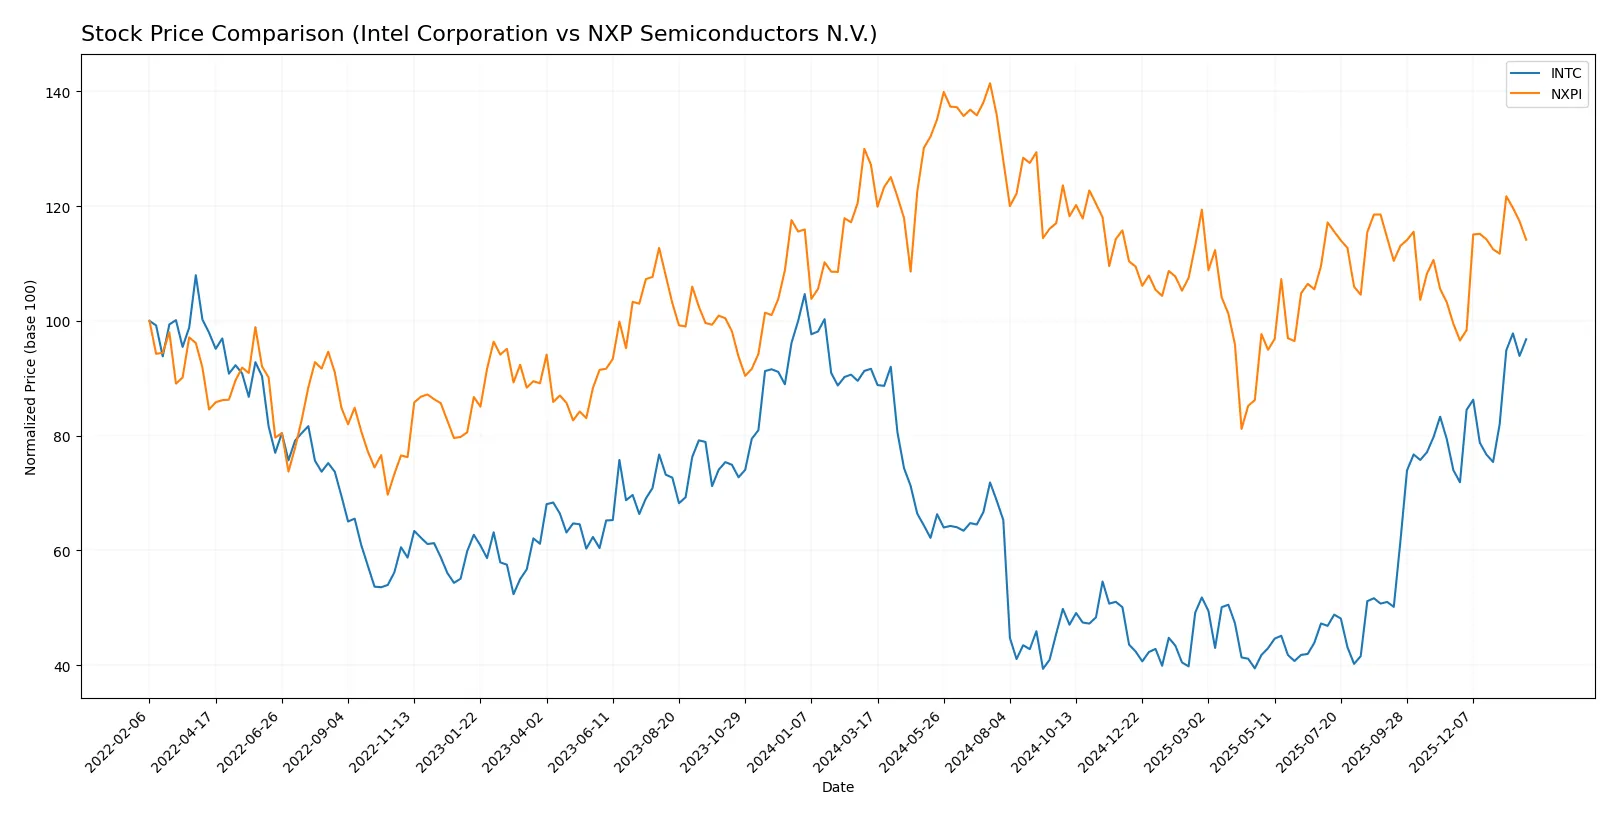
Over the past year, Intel Corporation’s stock price rose steadily with accelerating gains, while NXP Semiconductors N.V. experienced a notable decline despite recent recovery efforts.
Trend Comparison
Intel’s stock shows a bullish trend with a 5.61% gain over 12 months, accelerating recently by 30.83%. Volatility is moderate with an 8.11% standard deviation.
NXP’s stock exhibits a bearish trend, down 10.27% over the year despite a recent 14.73% rebound. It shows higher volatility at 24.23% standard deviation and accelerating recovery.
Intel outperforms NXP with sustained positive returns and lower volatility, delivering the strongest market performance over the analyzed period.
Target Prices
Analysts present a measured consensus on target prices for Intel Corporation and NXP Semiconductors N.V.
| Company | Target Low | Target High | Consensus |
|---|---|---|---|
| Intel Corporation | 20 | 66 | 46.95 |
| NXP Semiconductors N.V. | 215 | 280 | 242.5 |
Intel’s consensus target of $46.95 closely aligns with its current price of $46.47, suggesting limited upside. NXP’s target consensus of $242.5 significantly exceeds the current $226.14 price, indicating potential growth.

Don’t Let Luck Decide Your Entry Point
Optimize your entry points with our advanced ProRealTime indicators. You’ll get efficient buy signals with precise price targets for maximum performance. Start outperforming now!
How do institutions grade them?
Intel Corporation Grades
Here are the recent grades assigned by major financial institutions to Intel Corporation:
| Grading Company | Action | New Grade | Date |
|---|---|---|---|
| RBC Capital | Maintain | Sector Perform | 2026-01-23 |
| Keybanc | Maintain | Overweight | 2026-01-23 |
| Evercore ISI Group | Maintain | In Line | 2026-01-23 |
| Needham | Maintain | Hold | 2026-01-23 |
| Benchmark | Maintain | Buy | 2026-01-23 |
| Rosenblatt | Maintain | Sell | 2026-01-23 |
| UBS | Maintain | Neutral | 2026-01-23 |
| Citigroup | Maintain | Neutral | 2026-01-23 |
| Stifel | Maintain | Hold | 2026-01-23 |
| Wedbush | Maintain | Neutral | 2026-01-23 |
NXP Semiconductors N.V. Grades
Below are the recent grades given by recognized institutions to NXP Semiconductors N.V.:
| Grading Company | Action | New Grade | Date |
|---|---|---|---|
| Wells Fargo | Maintain | Overweight | 2026-01-15 |
| Citigroup | Maintain | Buy | 2026-01-15 |
| Truist Securities | Maintain | Buy | 2025-12-19 |
| JP Morgan | Maintain | Neutral | 2025-10-29 |
| Truist Securities | Maintain | Buy | 2025-10-29 |
| Wells Fargo | Maintain | Overweight | 2025-07-23 |
| Truist Securities | Maintain | Buy | 2025-07-23 |
| JP Morgan | Maintain | Neutral | 2025-07-23 |
| Susquehanna | Maintain | Neutral | 2025-07-23 |
| Barclays | Maintain | Overweight | 2025-07-22 |
Which company has the best grades?
NXP Semiconductors holds a stronger consensus with multiple Buy and Overweight ratings. Intel shows a wider spread from Buy to Sell. Investors may perceive NXP as having more consistent institutional support, affecting confidence and potential demand.
Risks specific to each company
The following categories identify critical pressure points and systemic threats facing Intel Corporation and NXP Semiconductors N.V. in the 2026 market environment:
1. Market & Competition
Intel Corporation
- Faces intense competition in CPUs and adjacent products; losing net margin and ROIC signals strategic challenges.
NXP Semiconductors N.V.
- Strong profitability and ROIC reflect effective market positioning, but high P/B ratio suggests valuation risk.
2. Capital Structure & Debt
Intel Corporation
- Maintains moderate debt-to-equity (0.41), manageable interest coverage, signaling stable capital structure.
NXP Semiconductors N.V.
- Leverages more debt (D/E 1.18) with strong interest coverage, raising financial risk despite operational strength.
3. Stock Volatility
Intel Corporation
- Beta at 1.35 indicates moderately higher volatility than market average.
NXP Semiconductors N.V.
- Beta at 1.46 shows slightly more volatility, exposing investors to elevated market swings.
4. Regulatory & Legal
Intel Corporation
- US-based with exposure to evolving technology regulations and antitrust scrutiny.
NXP Semiconductors N.V.
- Operates globally with EU and Asian regulatory challenges, heightening compliance complexity.
5. Supply Chain & Operations
Intel Corporation
- Large-scale manufacturing exposes Intel to supply chain disruptions and capital intensity risks.
NXP Semiconductors N.V.
- More diversified operations and smaller scale reduce vulnerability but still dependent on global suppliers.
6. ESG & Climate Transition
Intel Corporation
- Faces pressure to meet aggressive US ESG standards; high energy use in fabrication is a concern.
NXP Semiconductors N.V.
- Must navigate EU ESG mandates and global climate policies, with ongoing investments in sustainability.
7. Geopolitical Exposure
Intel Corporation
- US-China tensions impact supply chains and export controls, increasing operational risk.
NXP Semiconductors N.V.
- Broad international footprint subjects NXP to multiple geopolitical risks, including trade wars and regional instability.
Which company shows a better risk-adjusted profile?
NXP’s most significant risk is its high leverage, which could strain financial flexibility despite operational strength. Intel’s critical risk lies in deteriorating profitability and ROIC, signaling deep strategic and execution challenges. NXP’s safer Altman Z-Score and favorable profitability offer a better risk-adjusted profile. However, Intel’s stable capital structure and lower debt reduce bankruptcy risk. The contrasting debt levels and profitability trends justify heightened caution on NXP’s balance sheet and Intel’s earnings quality.
Final Verdict: Which stock to choose?
Intel Corporation’s superpower lies in its deep manufacturing scale and historical industry presence, offering potential turnaround value. However, its persistent value destruction and declining ROIC remain points of vigilance. It suits aggressive investors willing to bet on a structural recovery amid a challenging semiconductor cycle.
NXP Semiconductors commands a durable moat through efficient capital use and strong profitability, reflecting in its growing ROIC above WACC. It offers a safer profile than Intel, backed by consistent value creation and robust cash flow generation. This aligns with Growth at a Reasonable Price (GARP) investors seeking stable earnings growth.
If you prioritize deep turnaround potential and are comfortable with higher risk, Intel might be the compelling choice due to its scale and ongoing efforts to regain profitability. However, if you seek sustained value creation with better stability, NXP clearly outshines Intel thanks to its strong moat and capital efficiency, despite commanding a premium.
Disclaimer: Investment carries a risk of loss of initial capital. The past performance is not a reliable indicator of future results. Be sure to understand risks before making an investment decision.
Go Further
I encourage you to read the complete analyses of Intel Corporation and NXP Semiconductors N.V. to enhance your investment decisions: