Home > Comparison > Technology > INTC vs NVEC
The strategic rivalry between Intel Corporation and NVE Corporation shapes the semiconductor industry’s evolution. Intel operates as a capital-intensive giant focused on diverse computing platforms, while NVE specializes in niche spintronic sensor technologies with a lean operational model. This head-to-head pits broad market scale against innovative specialization. This analysis aims to identify which corporate trajectory offers a superior risk-adjusted return for a diversified portfolio navigating the complex technology landscape.
Table of contents
Companies Overview
Intel Corporation and NVE Corporation play pivotal roles in the semiconductor industry with contrasting scales and specialties.
Intel Corporation: Semiconductor Giant and Innovator
Intel Corporation dominates as a leading semiconductor manufacturer with a $232B market cap. It generates revenue from a diverse portfolio including CPUs, chipsets, accelerators, and high-performance computing platforms. In 2026, Intel sharpens its strategic focus on AI-driven solutions, autonomous driving, and cloud service providers, leveraging partnerships to enhance its competitive edge.
NVE Corporation: Spintronics Specialist
NVE Corporation operates as a niche spintronic device developer with a market cap of $326M. It earns from manufacturing magnetic sensors and couplers for factory automation and medical applications. Its 2026 strategy centers on expanding spintronic technology applications in industrial IoT and licensing advanced memory technologies, emphasizing innovation in a highly specialized segment.
Strategic Collision: Similarities & Divergences
Intel and NVE diverge sharply in scale and business philosophy: Intel pursues a broad, integrated platform approach, while NVE focuses on specialized spintronics. Their primary battleground lies in semiconductor innovation but targets distinct markets—mass computing versus niche sensor applications. Investors face contrasting profiles: Intel offers scale and diversification, NVE targets specialized growth with higher volatility.
Income Statement Comparison
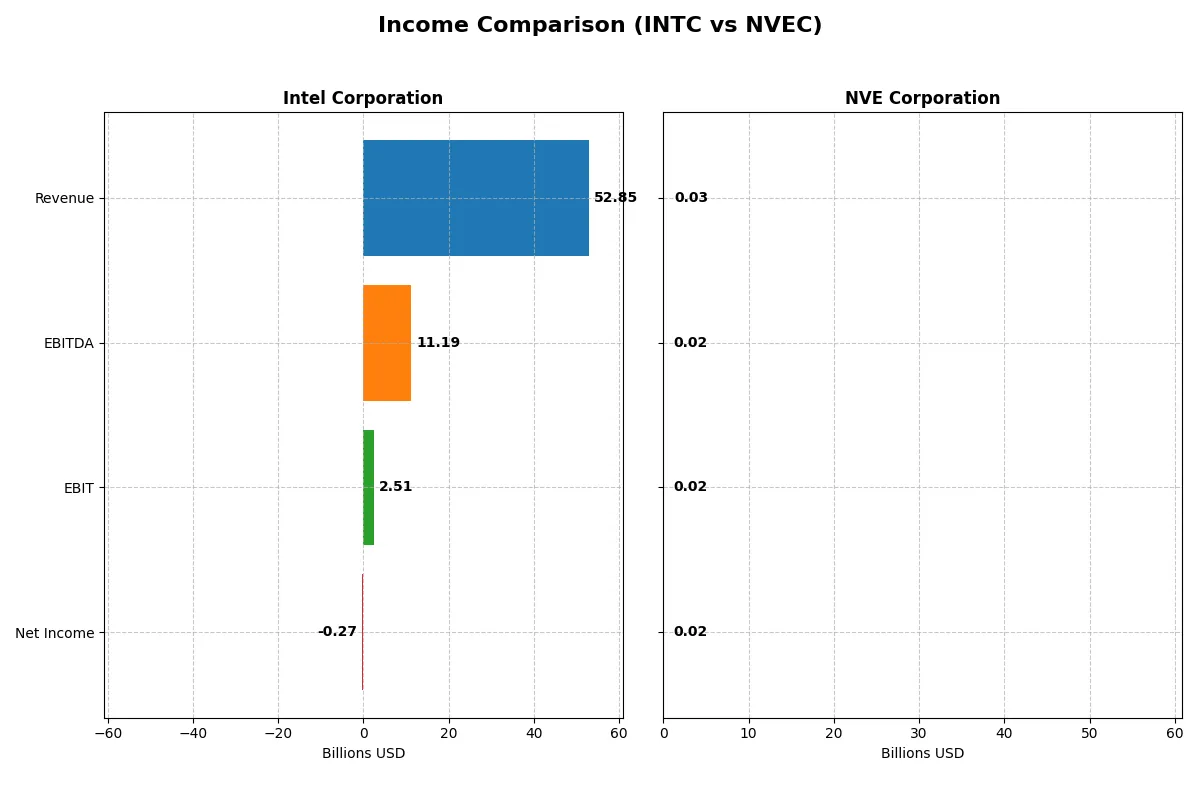
The following data dissects the core profitability and scalability of both corporate engines to reveal who dominates the bottom line:
| Metric | Intel Corporation (INTC) | NVE Corporation (NVEC) |
|---|---|---|
| Revenue | 52.9B | 25.9M |
| Cost of Revenue | 34.4B | 4.2M |
| Operating Expenses | 20.6B | 5.6M |
| Gross Profit | 18.5B | 21.6M |
| EBITDA | 11.2B | 16.3M |
| EBIT | 2.5B | 16.0M |
| Interest Expense | 953M | 0 |
| Net Income | -267M | 15.1M |
| EPS | -0.08 | 3.12 |
| Fiscal Year | 2025 | 2025 |
Income Statement Analysis: The Bottom-Line Duel
The following income statement comparison reveals how efficiently each company converts sales into profits and manages expenses amid changing market conditions.
Intel Corporation Analysis
Intel’s revenue declined from 79B in 2021 to 53B in 2025, reflecting a 33% drop over five years. Net income swung dramatically, with a peak of 20B in 2021 but turning negative to -267M in 2025. Gross margins remain relatively stable around 35%, but net margins have deteriorated to -0.5%, signaling profitability challenges despite a recent rebound in operating income.
NVE Corporation Analysis
NVE’s revenue grew steadily from 21M in 2021 to 26M in 2025, marking 21% growth over the period. Net income increased from 12M to 15M, maintaining a strong net margin above 58%. Despite a mild revenue dip last year, the company sustains excellent gross margins above 83% and consistently high EBIT margins near 62%, underscoring operational efficiency and solid profitability.
Margin Power vs. Revenue Scale
Intel’s scale dwarfs NVE’s but its profitability has waned, with negative net income in 2025 after years of decline. NVE, though smaller, delivers robust margins and steady profit growth. For investors prioritizing profitability and margin stability, NVE’s efficient model appears more attractive than Intel’s challenged turnaround at scale.
Financial Ratios Comparison
These vital ratios act as a diagnostic tool to expose the underlying fiscal health, valuation premiums, and capital efficiency of the companies compared below:
| Ratios | Intel Corporation (INTC) | NVE Corporation (NVEC) |
|---|---|---|
| ROE | -0.23% | 24.19% |
| ROIC | -0.02% | 21.14% |
| P/E | -658.38 | 20.46 |
| P/B | 1.54 | 4.95 |
| Current Ratio | 2.02 | 28.40 |
| Quick Ratio | 1.65 | 22.03 |
| D/E | 0.41 | 0.01 |
| Debt-to-Assets | 22.03% | 1.43% |
| Interest Coverage | -2.23 | 0 |
| Asset Turnover | 0.25 | 0.40 |
| Fixed Asset Turnover | 0.50 | 8.91 |
| Payout ratio | 0 | 128.38% |
| Dividend yield | 0% | 6.28% |
| Fiscal Year | 2025 | 2025 |
Efficiency & Valuation Duel: The Vital Signs
Financial ratios act as a company’s DNA, exposing hidden risks and operational strengths crucial for investment insights.
Intel Corporation
Intel shows negative profitability with ROE at -0.23% and net margin at -0.51%, signaling operational struggles. Its P/E ratio is negative, implying valuation challenges or losses, yet the P/B of 1.54 remains moderate. Intel maintains a solid current ratio of 2.02, reflecting liquidity strength, but it offers no dividends, likely reinvesting heavily in R&D at 26% of revenue.
NVE Corporation
NVE stands out with a robust ROE of 24.19% and net margin at 58.22%, demonstrating strong profitability and operational efficiency. The P/E of 20.46 suggests fair valuation, though a high P/B of 4.95 flags potential overvaluation. It boasts an exceptional current ratio of 28.4, indicating ample liquidity, and provides a 6.28% dividend yield, rewarding shareholders alongside steady growth investments.
Premium Valuation vs. Operational Safety
NVE delivers superior profitability and shareholder returns with a favorable ratio profile, despite a stretched P/B and liquidity. Intel shows liquidity resilience but faces profitability headwinds and lacks direct shareholder payouts. Investors seeking growth and income may prefer NVE, while those prioritizing balance sheet safety might consider Intel’s profile.
Which one offers the Superior Shareholder Reward?
I compare Intel Corporation (INTC) and NVE Corporation (NVEC) by their dividend yields, payout ratios, and share buybacks. Intel yields 0% in 2025 with no dividend payout, struggling with negative free cash flow (-1.02/share) and net losses. Its buyback program is dormant, weakening total return. Conversely, NVEC pays a robust 6.3% dividend yield, backed by strong free cash flow (2.7/share) and consistent buybacks, sustaining a payout ratio above 100%, supported by exceptional operating cash flow coverage (15.5x). NVEC’s high margins and capital discipline indicate a sustainable, shareholder-friendly model. I see NVEC offering superior total return potential in 2026.
Comparative Score Analysis: The Strategic Profile
The radar chart reveals the fundamental DNA and strategic trade-offs of Intel Corporation and NVE Corporation across key financial metrics:
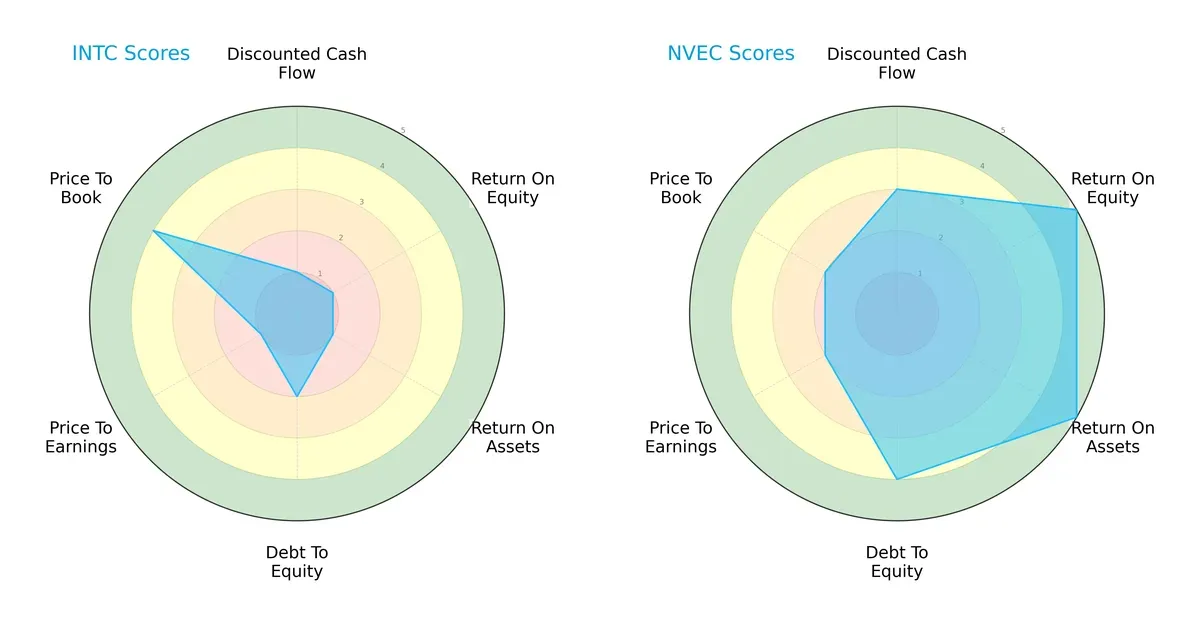
NVE Corporation outperforms Intel with a more balanced and robust profile, scoring high in ROE (5) and ROA (5), indicating superior asset efficiency and profitability. Intel lags with consistently low scores in DCF (1), ROE (1), and ROA (1), relying mainly on a favorable price-to-book ratio (4) as a valuation edge. NVE’s moderate debt-to-equity (4) and price-to-earnings (2) scores suggest prudent capital structure and fair valuation, contrasting Intel’s moderate debt risk (2) but poor valuation metrics (PE score 1). Overall, NVE demonstrates stronger operational performance and financial stability.
Bankruptcy Risk: Solvency Showdown
The Altman Z-Score gap signals a stark contrast in long-term survival prospects:
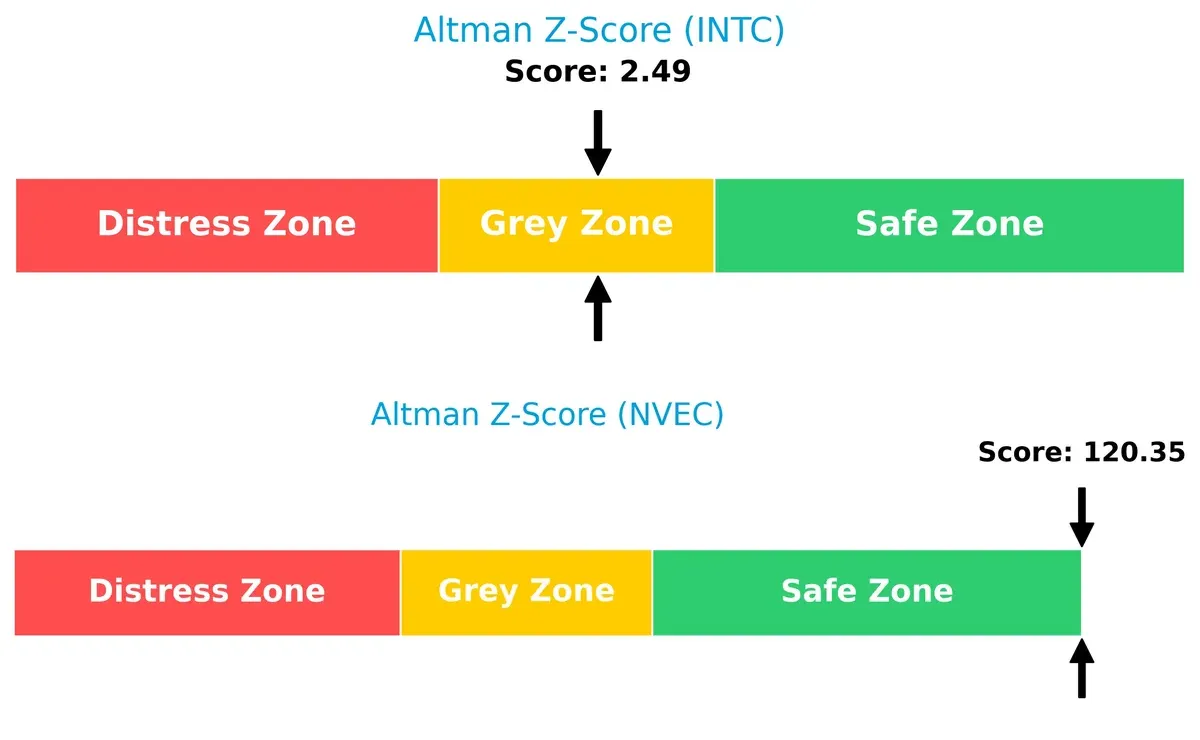
NVE Corporation’s Z-Score of 120.4 places it securely in the safe zone, showing negligible bankruptcy risk. Intel’s score of 2.49 situates it in the grey zone, indicating moderate financial distress and vulnerability in this economic cycle.
Financial Health: Quality of Operations
Piotroski F-Score comparison highlights operational quality differences:
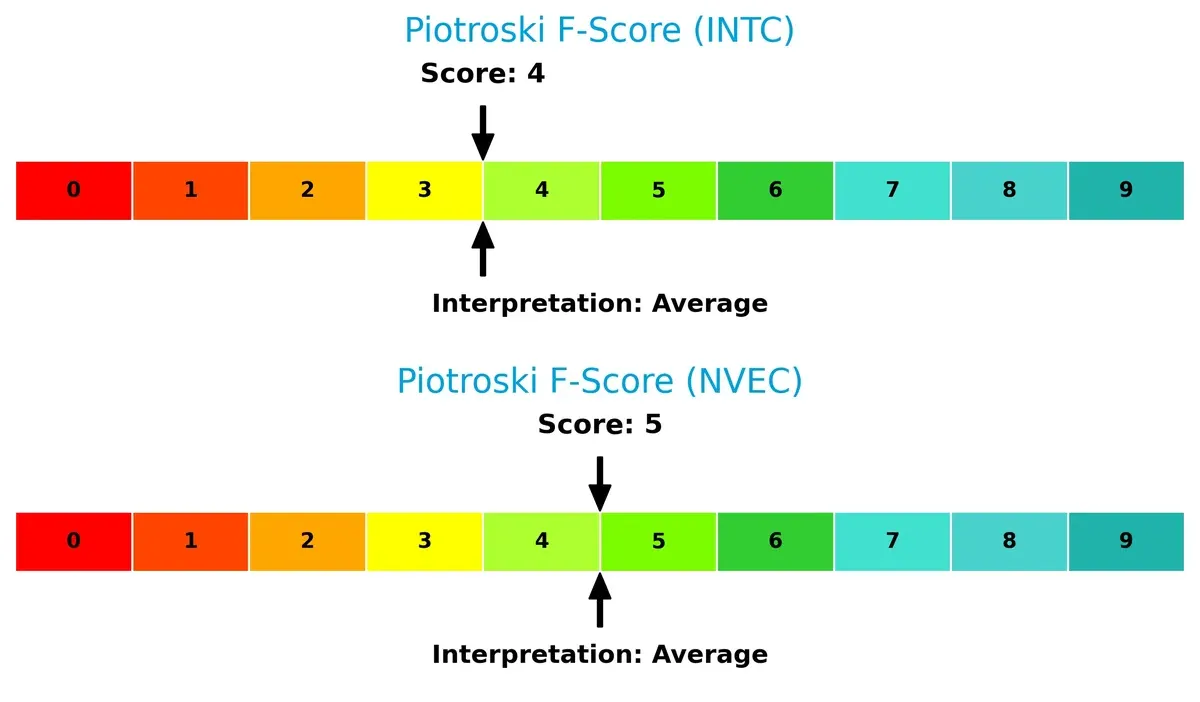
Both firms show average financial health, with NVE scoring 5 and Intel 4 on a 9-point scale. Neither indicates peak financial strength, but Intel’s lower score flags potential internal weakness relative to NVE’s more stable operational metrics. Investors should monitor Intel’s internal fundamentals closely.
How are the two companies positioned?
This section dissects the operational DNA of Intel and NVE by comparing their revenue distribution and internal dynamics, including strengths and weaknesses. The goal is to confront their economic moats and identify which offers the most resilient competitive advantage today.
Revenue Segmentation: The Strategic Mix
This visual comparison dissects how Intel Corporation and NVE Corporation diversify their income streams and where their primary sector bets lie:
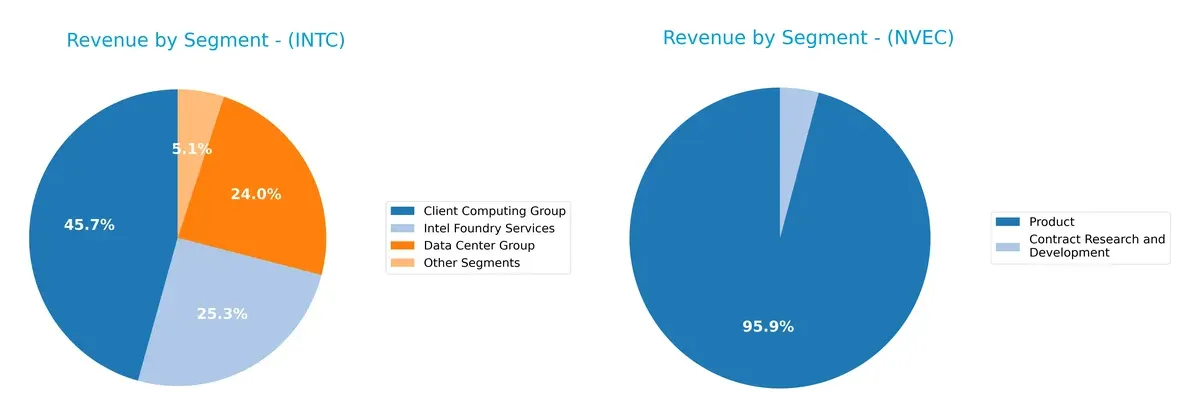
Intel’s revenue spreads across multiple segments, with Client Computing Group at $32.2B anchoring its portfolio, followed by Intel Foundry Services at $17.8B and Data Center Group at $16.9B. This diversification contrasts sharply with NVE’s heavy reliance on Product sales at $26M, dwarfing its Contract Research and Development at $1.1M. Intel’s broad segment mix reduces concentration risk and supports ecosystem lock-in. NVE’s focus on a single dominant segment signals higher exposure to market shifts but may allow nimble specialization.
Strengths and Weaknesses Comparison
This table compares the Strengths and Weaknesses of Intel Corporation and NVE Corporation:
Intel Corporation Strengths
- Diversified product segments including computing, data centers, and foundry services
- Strong global revenue presence in U.S., Singapore, Taiwan, and China
- Favorable liquidity ratios with current ratio of 2.02 and quick ratio of 1.65
NVE Corporation Strengths
- High profitability with net margin of 58.22% and ROIC of 21.14%
- Low debt levels with debt-to-assets at 1.43% and strong interest coverage
- Efficient fixed asset turnover at 8.91 and favorable quick ratio of 22.03
Intel Corporation Weaknesses
- Negative profitability metrics including net margin of -0.51% and ROE of -0.23%
- Unfavorable asset turnover ratios showing operational inefficiency
- Lack of dividend yield and slightly unfavorable overall financial ratios
NVE Corporation Weaknesses
- Very high current ratio of 28.4 indicating potential asset inefficiency
- Elevated price-to-book ratio of 4.95 may imply overvaluation risks
- Some unfavorable asset turnover ratio at 0.4 despite strong fixed asset use
Intel shows strength in global diversification and liquidity but struggles with profitability and asset efficiency. NVE excels in profitability and low leverage yet faces asset utilization and valuation concerns. Both companies’ strategies must address these imbalances to enhance long-term sustainability.
The Moat Duel: Analyzing Competitive Defensibility
A structural moat protects long-term profits from relentless competition erosion. Understanding each company’s moat reveals their true market resilience:
Intel Corporation: Scale and Intangible Assets Moat
Intel’s moat stems from massive scale and proprietary chip design. Despite margin challenges, it maintains platform dominance. The 2026 pivot to AI and cloud chips could deepen this advantage, yet margin pressure remains a threat.
NVE Corporation: Specialized Technology Moat
NVE’s moat lies in its unique spintronics technology, unlike Intel’s broad semiconductor base. It commands superior margins and ROIC, reflecting strong value creation. Expansion in medical and industrial IoT sensors offers promising growth avenues.
Scale Dominance vs. Technological Specialization
NVE’s clearly deeper moat outperforms Intel’s eroding advantage, supported by rising ROIC and margin strength. Intel faces a tough uphill battle defending market share against nimble, high-margin innovators like NVE.
Which stock offers better returns?
Over the past 12 months, Intel Corporation’s stock rose steadily with accelerating momentum, while NVE Corporation’s shares declined overall despite recent gains.
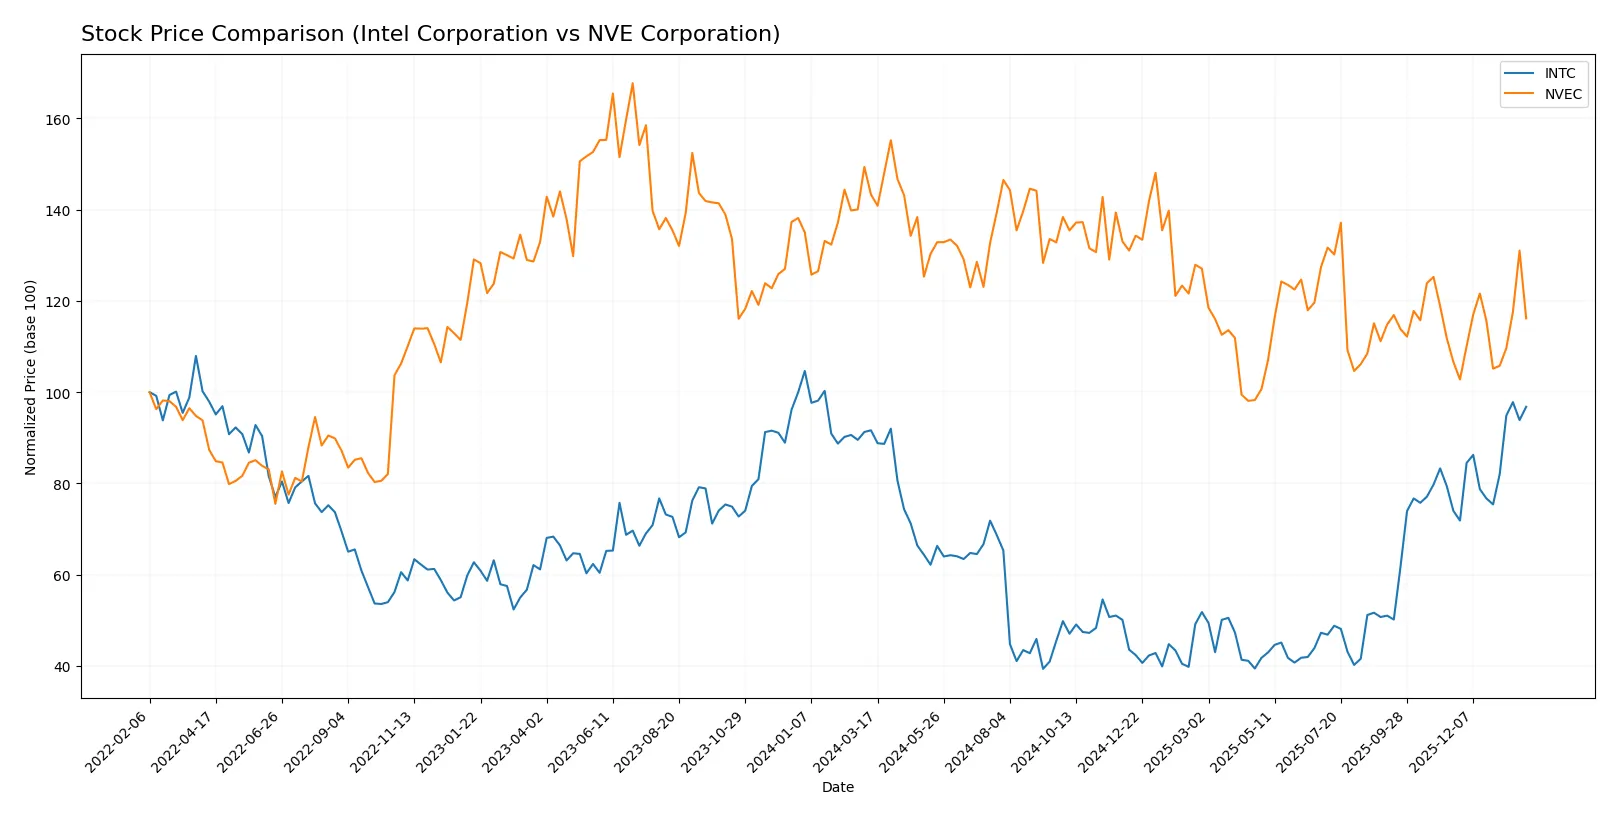
Trend Comparison
Intel’s stock gained 5.61% over the past year, showing a bullish trend with acceleration and a high price of 46.96. Volatility measured by standard deviation stands at 8.11.
NVE’s stock fell 18.93%, reflecting a bearish trend with accelerating decline. Its highest price reached 90.18, with volatility at 7.6, indicating notable price swings.
Intel outperformed NVE by delivering positive returns amid NVE’s overall decline, marking Intel as the stronger market performer in this period.
Target Prices
Intel Corporation shows a broad analyst target consensus, reflecting mixed market views.
| Company | Target Low | Target High | Consensus |
|---|---|---|---|
| Intel Corporation | 20 | 66 | 46.95 |
The consensus target price of $46.95 is nearly flat versus the current $46.47 stock price, indicating limited upside or downside expected by analysts. No verified target price data is available for NVE Corporation.

Don’t Let Luck Decide Your Entry Point
Optimize your entry points with our advanced ProRealTime indicators. You’ll get efficient buy signals with precise price targets for maximum performance. Start outperforming now!
How do institutions grade them?
The following presents the latest institutional grades for Intel Corporation and NVE Corporation:
Intel Corporation Grades
Below is a summary of recent analyst grades for Intel Corporation from established firms.
| Grading Company | Action | New Grade | Date |
|---|---|---|---|
| RBC Capital | Maintain | Sector Perform | 2026-01-23 |
| Keybanc | Maintain | Overweight | 2026-01-23 |
| Evercore ISI Group | Maintain | In Line | 2026-01-23 |
| Needham | Maintain | Hold | 2026-01-23 |
| Benchmark | Maintain | Buy | 2026-01-23 |
| Rosenblatt | Maintain | Sell | 2026-01-23 |
| UBS | Maintain | Neutral | 2026-01-23 |
| Citigroup | Maintain | Neutral | 2026-01-23 |
| Stifel | Maintain | Hold | 2026-01-23 |
| Wedbush | Maintain | Neutral | 2026-01-23 |
Which company has the best grades?
Intel Corporation has multiple reliable analyst grades, ranging from Sell to Buy, with a cluster around Neutral to Hold. NVE Corporation lacks institutional grades. Intel’s variety of opinions reflects mixed market sentiment, which investors should weigh carefully.
Risks specific to each company
The following categories highlight the critical pressure points and systemic threats facing Intel Corporation and NVE Corporation in the 2026 market environment:
1. Market & Competition
Intel Corporation
- Faces intense pressure from larger semiconductor rivals and evolving tech demands.
NVE Corporation
- Operates in niche spintronics but risks market size limitations and emerging competitors.
2. Capital Structure & Debt
Intel Corporation
- Maintains moderate debt with a debt-to-equity ratio of 0.41, indicating balanced leverage.
NVE Corporation
- Nearly debt-free with a 0.01 debt-to-equity ratio, showcasing conservative financial management.
3. Stock Volatility
Intel Corporation
- Beta at 1.354 signals higher volatility than the market average (S&P 500 ~1.0).
NVE Corporation
- Beta at 1.196 suggests volatility slightly above market norms but more stable than Intel.
4. Regulatory & Legal
Intel Corporation
- Large global footprint exposes Intel to complex regulatory scrutiny and antitrust risks.
NVE Corporation
- Smaller scale reduces regulatory exposure but dependency on niche tech invites patent litigation risks.
5. Supply Chain & Operations
Intel Corporation
- Complex global supply chain vulnerable to geopolitical disruptions and component shortages.
NVE Corporation
- Lean operations and limited scale reduce supply chain risks but constrain scalability.
6. ESG & Climate Transition
Intel Corporation
- Faces pressure to meet aggressive ESG targets due to size and public scrutiny.
NVE Corporation
- ESG risks are lower but limited resources may slow climate transition initiatives.
7. Geopolitical Exposure
Intel Corporation
- Significant exposure to US-China tensions affecting manufacturing and sales.
NVE Corporation
- Minimal direct geopolitical exposure but reliant on global industrial IoT demand.
Which company shows a better risk-adjusted profile?
Intel’s biggest risk is its heavy market competition and operational complexity, which strain margins and innovation cycles. NVE’s chief risk lies in its niche market size and potential scalability limits. NVE’s stronger profitability ratios and near-zero debt provide a superior risk-adjusted profile. Notably, Intel’s negative net margin contrasts sharply with NVE’s 58% net margin, underscoring operational challenges.
Final Verdict: Which stock to choose?
Intel Corporation’s superpower lies in its established scale and operational resilience within the semiconductor industry. It navigates complex cycles with a broad asset base and a robust balance sheet. However, its declining profitability and value destruction signal a point of vigilance. Intel suits portfolios aiming for turnaround plays with patience for cyclical recovery.
NVE Corporation boasts a compelling strategic moat through its impressive return on invested capital and consistently growing profitability. Its lean balance sheet and strong cash flow generation offer a safety profile superior to Intel’s. NVE fits well within portfolios targeting quality growth with a preference for durable competitive advantages.
If you prioritize value creation and durable moats, NVE outshines Intel by delivering superior profitability and stable capital efficiency. However, if you seek exposure to a large-cap cyclical with potential for operational rebound, Intel offers an intriguing, albeit riskier, scenario. Both present distinct investment archetypes demanding disciplined risk management.
Disclaimer: Investment carries a risk of loss of initial capital. The past performance is not a reliable indicator of future results. Be sure to understand risks before making an investment decision.
Go Further
I encourage you to read the complete analyses of Intel Corporation and NVE Corporation to enhance your investment decisions: