Home > Comparison > Technology > INTC vs NVMI
The strategic rivalry between Intel Corporation and Nova Ltd. defines the current trajectory of the semiconductor industry. Intel operates as a capital-intensive technology giant with broad product lines, while Nova Ltd. focuses on high-precision process control systems for chip manufacturing. This head-to-head pits scale and diversification against specialized innovation. This analysis aims to determine which company offers a superior risk-adjusted return for diversified investors in the evolving semiconductor landscape.
Table of contents
Companies Overview
Intel Corporation and Nova Ltd. hold pivotal roles in the semiconductor industry’s complex value chain.
Intel Corporation: Semiconductor Giant Driving Compute Innovation
Intel dominates the global semiconductor market with its core business in designing and manufacturing CPUs, chipsets, and system-on-chip packages. Its revenue engine spans multiple segments, including high-performance compute solutions and embedded applications for diverse verticals. In 2026, Intel focuses strategically on AI-enhanced drug research partnerships and expanding workload-optimized platforms for cloud and enterprise clients.
Nova Ltd.: Precision Metrology for Chip Manufacturing
Nova Ltd. specializes in process control systems critical to semiconductor fabrication. It generates revenue by selling advanced metrology platforms for dimensional and chemical measurements throughout chip production steps. In 2026, Nova intensifies its R&D in metrology technologies to support logic, foundry, and memory manufacturers globally, emphasizing precision in lithography and advanced packaging processes.
Strategic Collision: Similarities & Divergences
Intel and Nova both serve the semiconductor sector but differ fundamentally in scope. Intel pursues a broad platform strategy across chips and compute solutions, while Nova operates a niche in metrology for process control. Their battleground centers on enabling semiconductor manufacturing efficiency and innovation. Intel offers integrated platforms; Nova provides specialized measurement tools, creating distinct investment profiles rooted in scale versus specialization.
Income Statement Comparison
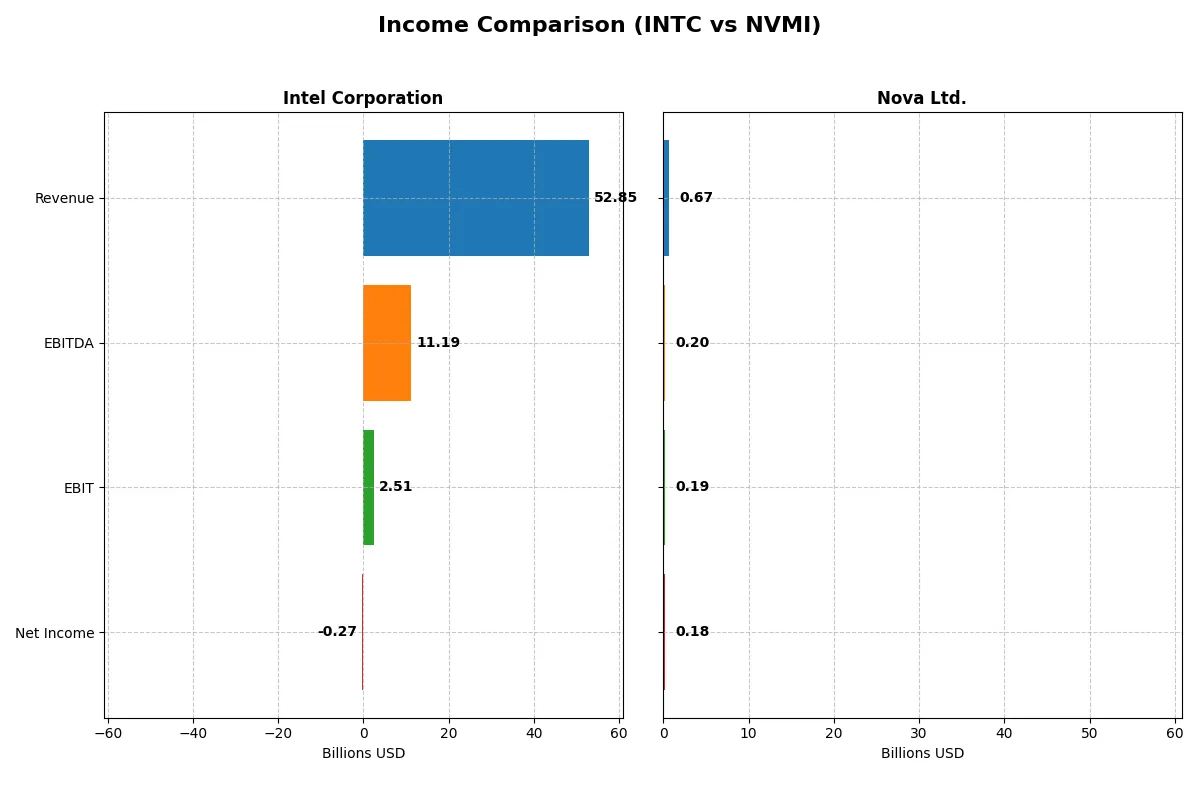
This data dissects the core profitability and scalability of both corporate engines to reveal who dominates the bottom line:
| Metric | Intel Corporation (INTC) | Nova Ltd. (NVMI) |
|---|---|---|
| Revenue | 52.9B | 672M |
| Cost of Revenue | 34.4B | 285M |
| Operating Expenses | 20.6B | 200M |
| Gross Profit | 18.5B | 387M |
| EBITDA | 11.2B | 205M |
| EBIT | 2.5B | 188M |
| Interest Expense | 953M | 1.6M |
| Net Income | -267M | 184.9M |
| EPS | -0.08 | 6.31 |
| Fiscal Year | 2025 | 2024 |
Income Statement Analysis: The Bottom-Line Duel
The upcoming income statement comparison reveals which company operates with greater efficiency and profitability in their core business engines.
Intel Corporation Analysis
Intel’s revenue declined modestly by 0.5% in 2025 to $52.9B, while net income remained negative at -$267M, improving sharply from prior losses. Gross margin holds steady at a favorable 35%, reflecting decent cost control, but the net margin is negative, signaling ongoing profitability challenges. Operating efficiency is recovering, marked by a 125% EBIT growth year-over-year.
Nova Ltd. Analysis
Nova Ltd. posts strong growth, with 2024 revenue up 30% to $672M and net income rising to $184.9M. Its gross margin at 58% and net margin at 27% demonstrate robust profitability and operational leverage. The company sustains positive momentum, with consistent double-digit growth across revenue, EBIT, and EPS, highlighting effective capital allocation and margin expansion.
Margin Strength vs. Growth Trajectory
Nova Ltd. clearly outperforms with superior margin profiles and rapid growth, while Intel struggles to return to profitability despite scale. Nova’s high margins and expanding earnings offer a compelling growth story. Intel’s profile suits investors focused on scale and potential turnaround, but risks linger given its negative net margin and revenue decline.
Financial Ratios Comparison
These vital ratios act as a diagnostic tool to expose the underlying fiscal health, valuation premiums, and capital efficiency of the companies compared below:
| Ratios | Intel Corporation (INTC) | Nova Ltd. (NVMI) |
|---|---|---|
| ROE | -0.23% (2025) | 19.81% (2024) |
| ROIC | -0.02% (2025) | 13.39% (2024) |
| P/E | -658.4 (2025) | 31.20 (2024) |
| P/B | 1.54 (2025) | 6.18 (2024) |
| Current Ratio | 2.02 (2025) | 2.32 (2024) |
| Quick Ratio | 1.65 (2025) | 1.92 (2024) |
| D/E | 0.41 (2025) | 0.25 (2024) |
| Debt-to-Assets | 22.0% (2025) | 17.0% (2024) |
| Interest Coverage | -2.23 (2025) | 116.20 (2024) |
| Asset Turnover | 0.25 (2025) | 0.48 (2024) |
| Fixed Asset Turnover | 0.50 (2025) | 5.06 (2024) |
| Payout Ratio | 0% (2025) | 0% (2024) |
| Dividend Yield | 0% (2025) | 0% (2024) |
| Fiscal Year | 2025 | 2024 |
Efficiency & Valuation Duel: The Vital Signs
Financial ratios act as the company’s DNA, exposing hidden risks and revealing operational excellence beneath surface numbers.
Intel Corporation
Intel’s profitability metrics show weakness, with a negative ROE of -0.23% and net margin at -0.51%, signaling operational struggles. Its valuation appears stretched, reflected by a negative P/E, yet the price-to-book remains neutral at 1.54. Intel offers no dividend, focusing on R&D with a significant 26% revenue reinvestment, aiming for future growth despite current inefficiencies.
Nova Ltd.
Nova posts robust profitability with a 19.81% ROE and a strong 27.33% net margin, indicating operational efficiency. Valuation seems expensive, with a P/E of 31.2 and a high price-to-book of 6.18, reflecting market optimism. The company pays no dividend but balances this with disciplined capital allocation, maintaining low debt and investing modestly in R&D at 16% of revenue.
Balanced Profitability vs. Valuation Premium
Nova Ltd. offers superior profitability and operational strength but trades at a premium valuation, increasing risk. Intel’s valuation is more attractive, yet profitability remains a red flag. Investors seeking growth and operational excellence may prefer Nova’s profile, while those prioritizing valuation might watch Intel cautiously.
Which one offers the Superior Shareholder Reward?
I see Intel Corporation (INTC) pays a modest dividend yield near 1.8% in 2024 but shows negative free cash flow (-3B per share), signaling dividend sustainability risks. Intel has no recent buybacks, weakening total returns. Nova Ltd. (NVMI) pays no dividend but reinvests heavily, generating robust free cash flow (~7.5B per share) and maintaining low debt (debt/equity ~0.25). NVMI’s capital-light model funds growth and modest buybacks, supporting durable shareholder value. Historically in tech sectors, a strong free cash flow with disciplined buybacks trumps risky dividends. I conclude NVMI offers the more attractive total return profile in 2026.
Comparative Score Analysis: The Strategic Profile
The radar chart reveals the fundamental DNA and trade-offs of Intel Corporation and Nova Ltd., highlighting their contrasting financial strengths and valuation profiles:
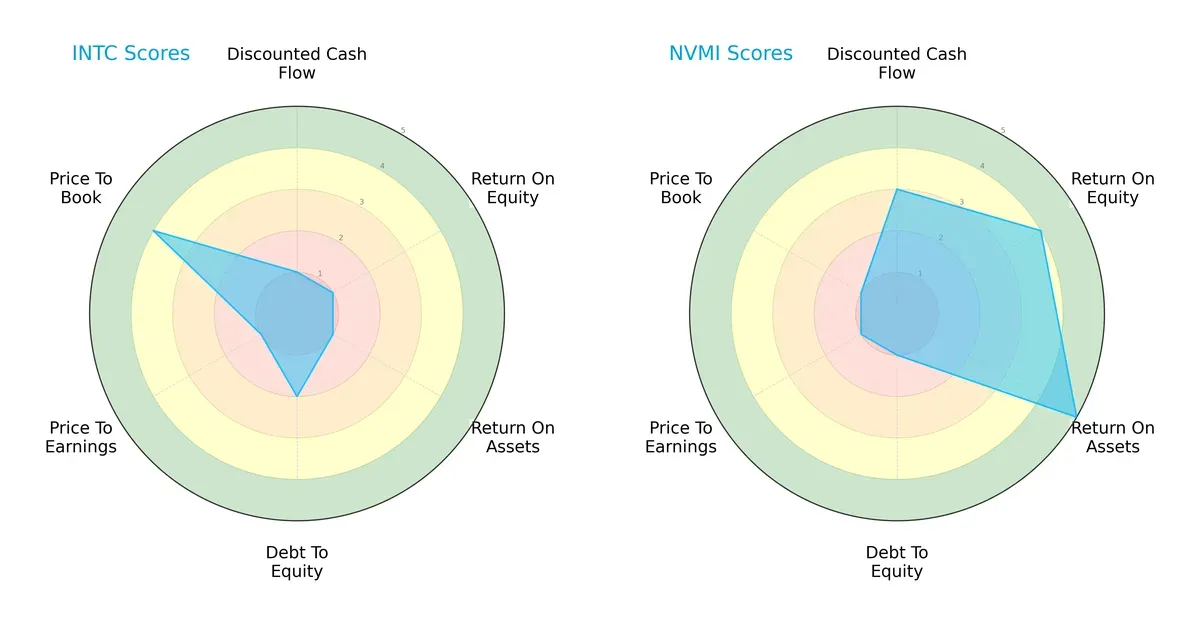
Intel shows a defensive profile with a strong price-to-book score (4) but struggles in cash flow (1), ROE (1), and ROA (1), indicating operational inefficiencies. Nova Ltd. excels in operational metrics—ROE (4) and ROA (5)—but carries higher financial risk with a weak debt-to-equity score (1) and poor valuation scores (P/E and P/B of 1). Nova’s edge is growth and profitability, while Intel presents a more balanced valuation approach.
Bankruptcy Risk: Solvency Showdown
The Altman Z-Score gap highlights a stark difference in financial stability:
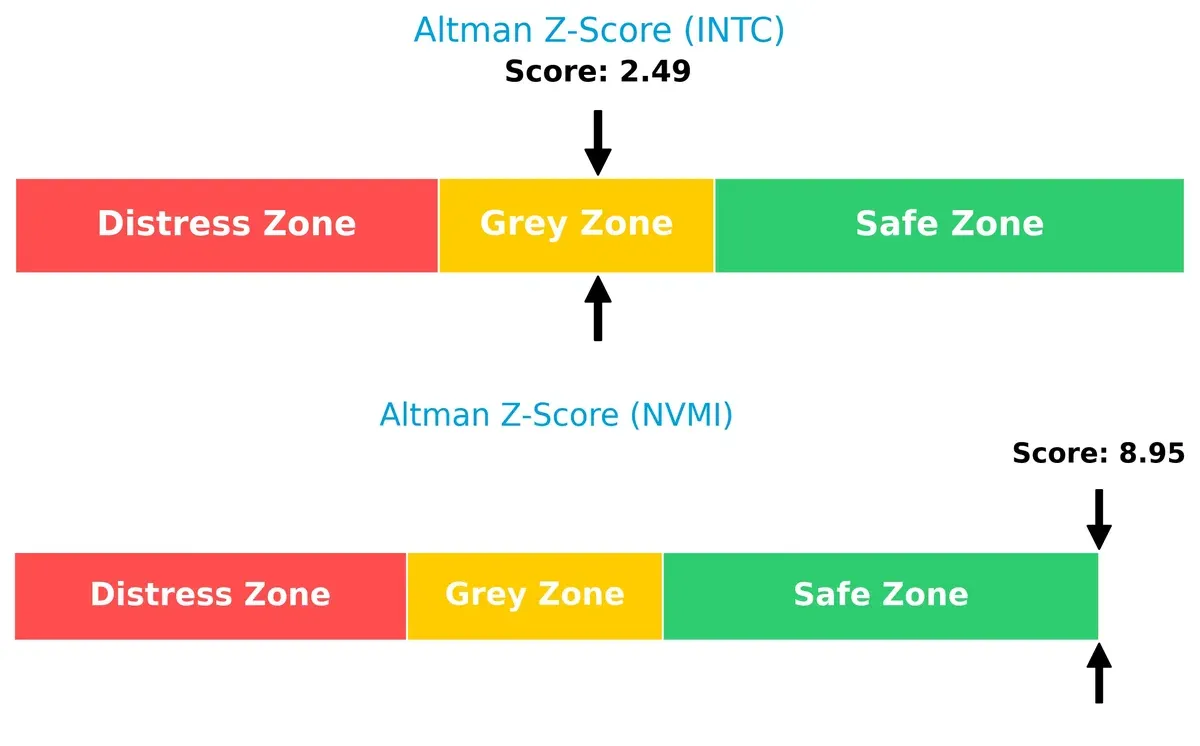
Intel’s score of 2.49 places it in the grey zone, signaling moderate bankruptcy risk under current market cycles. Nova’s robust score of 8.95 firmly situates it in the safe zone, indicating strong solvency and long-term survival potential.
Financial Health: Quality of Operations
Piotroski F-Scores reflect internal financial strength and operational quality:
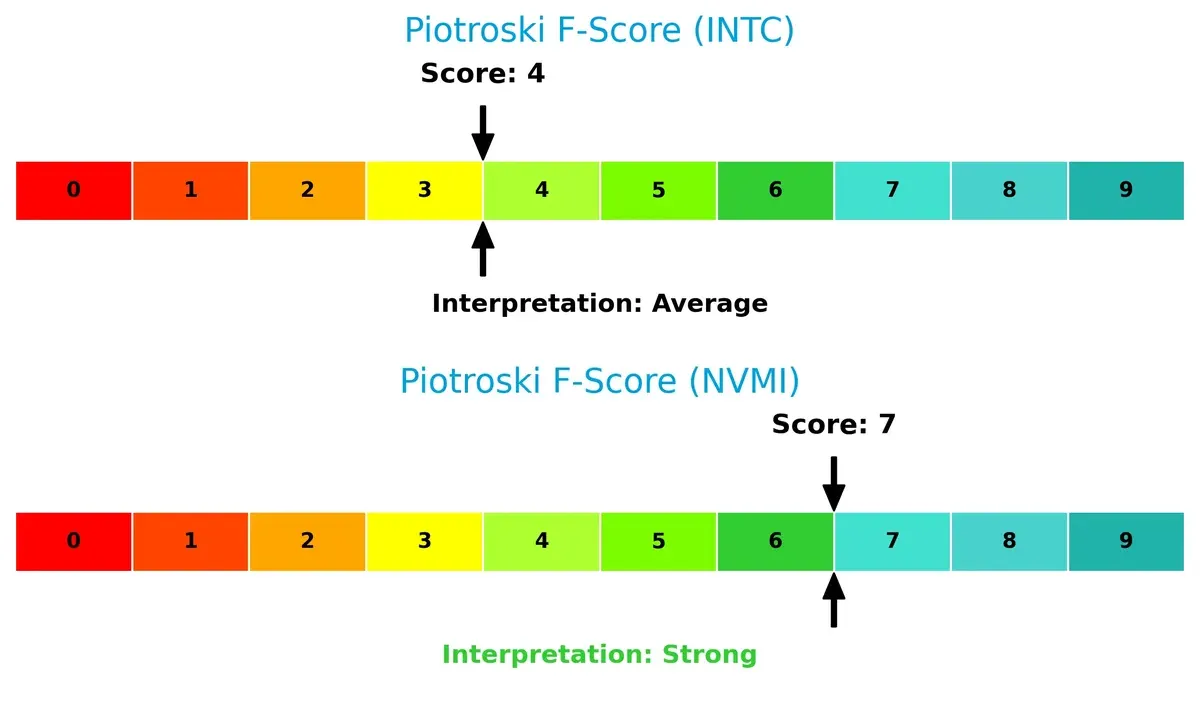
Nova’s score of 7 denotes strong financial health, with solid profitability and efficiency metrics. Intel’s average score of 4 raises red flags, suggesting weaker fundamentals and potential internal challenges relative to Nova’s more resilient profile.
How are the two companies positioned?
This section dissects the operational DNA of Intel and Nova by comparing their revenue distribution by segment alongside internal strengths and weaknesses. The goal is to confront their economic moats and identify which business model offers the most resilient, sustainable competitive advantage in today’s semiconductor market.
Revenue Segmentation: The Strategic Mix
This visual comparison dissects how Intel Corporation and Nova Ltd. diversify their income streams and where their primary sector bets lie:
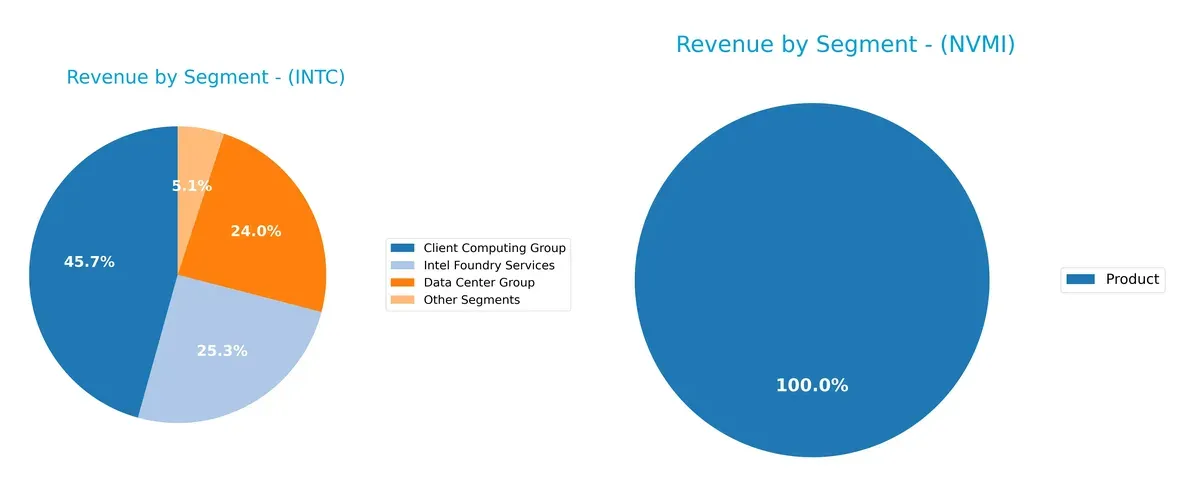
Intel dominates with a multi-segment approach, anchored by Client Computing Group at $32.2B and strong Data Center Group and Foundry Services contributions. Nova Ltd. relies almost exclusively on a single Product segment, generating $538M. Intel’s diversification supports ecosystem lock-in and infrastructure dominance, reducing concentration risk. Nova’s singular focus amplifies vulnerability but may enable nimble specialization. The contrast highlights Intel’s scale and scope advantage versus Nova’s narrow revenue base.
Strengths and Weaknesses Comparison
This table compares the Strengths and Weaknesses of Intel Corporation and Nova Ltd.:
Intel Corporation Strengths
- Diverse revenue streams from multiple segments including Client Computing and Data Center
- Strong global presence with significant sales in US, China, and Asia-Pacific
- Favorable liquidity ratios indicating solid short-term financial health
Nova Ltd. Strengths
- High profitability with strong net margin and ROE
- Efficient capital use reflected in high ROIC
- Favorable leverage and excellent interest coverage ratio
- High fixed asset turnover demonstrating operational efficiency
Intel Corporation Weaknesses
- Negative profitability metrics including net margin and ROIC
- Low asset turnover ratios indicating inefficiency
- Lack of dividend yield
- PE ratio negative but marked favorable, possibly signaling market skepticism
Nova Ltd. Weaknesses
- High WACC suggesting expensive capital
- Unfavorable PE and PB ratios indicating valuation concerns
- Low asset turnover despite high fixed asset turnover
- No dividend yield
Intel leverages its broad diversification and global footprint but struggles with profitability and asset efficiency. Nova shows strong profitability and financial stability but faces valuation and cost of capital challenges. These factors shape each company’s strategic focus on operational improvements or financial management.
The Moat Duel: Analyzing Competitive Defensibility
A structural moat is the only thing protecting long-term profits from relentless competition erosion. Let’s dissect the competitive defenses of Intel and Nova Ltd.:
Intel Corporation: Scale and Platform Moat
Intel’s moat stems from its massive scale and platform integration in semiconductors. This manifests in stable gross margins (~35%) but declining ROIC signals weakening value creation. Emerging AI and automotive chips could either deepen the moat or intensify competition in 2026.
Nova Ltd.: Precision Metrology Moat
Nova’s moat lies in specialized metrology technology, critical for semiconductor manufacturing precision. It commands superior margins (EBIT ~28%) and growing ROIC, signaling efficient capital use. Expanding into advanced packaging offers strong growth potential and moat reinforcement.
Verdict: Scale versus Specialized Precision
Intel’s broad platform moat is challenged by declining profitability and eroding ROIC. Nova’s precision metrology moat is narrower but deepening, supported by robust margin expansion and improving capital returns. I see Nova better equipped to defend and grow its niche market share in 2026.
Which stock offers better returns?
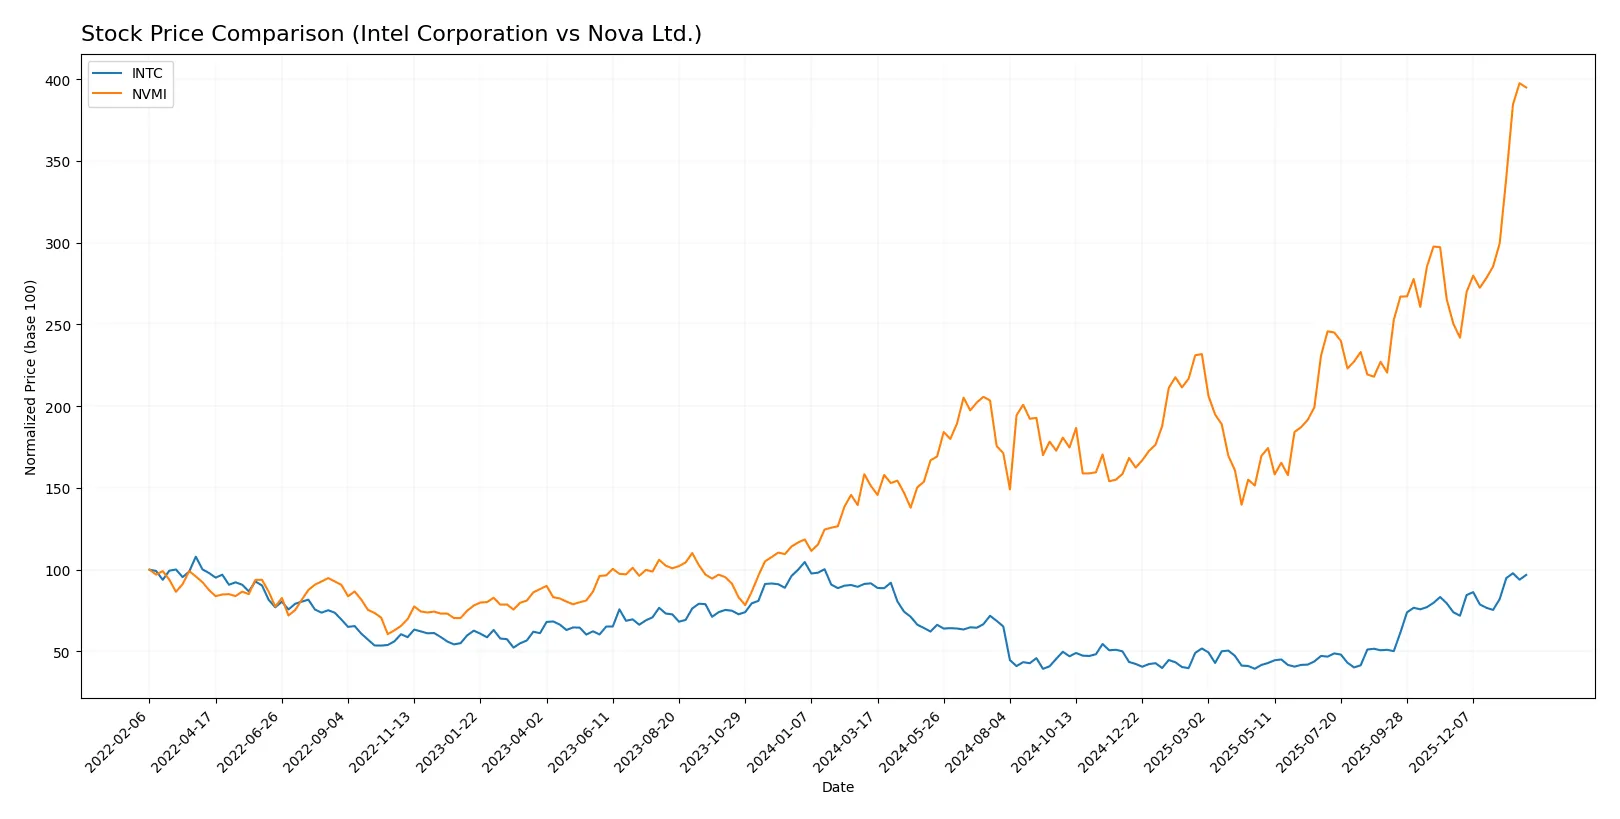
The past year shows distinct price movements for Intel Corporation and Nova Ltd., with both stocks exhibiting bullish trends but differing sharply in magnitude and volatility.
Trend Comparison
Intel’s stock rose 5.61% over the last 12 months, reflecting a bullish trend with accelerating momentum and moderate volatility at 8.11% standard deviation. The price ranged between 18.89 and 46.96.
Nova Ltd.’s stock gained 161.13% in the same period, displaying strong bullish acceleration but with very high volatility at 63.77%. The price fluctuated widely from 159.92 to 460.91.
Comparing both, Nova Ltd. delivered significantly higher returns with greater volatility, outpacing Intel’s more moderate but stable market performance.
Target Prices
Analysts present a broad but optimistic consensus for Intel Corporation and Nova Ltd.
| Company | Target Low | Target High | Consensus |
|---|---|---|---|
| Intel Corporation | 20 | 66 | 46.95 |
| Nova Ltd. | 335 | 500 | 408.33 |
Intel’s consensus target slightly exceeds its current price of 46.47, reflecting cautious optimism amid sector volatility. Nova’s target consensus sits below its current price of 457.84, indicating some expected price normalization.

Don’t Let Luck Decide Your Entry Point
Optimize your entry points with our advanced ProRealTime indicators. You’ll get efficient buy signals with precise price targets for maximum performance. Start outperforming now!
How do institutions grade them?
The following tables summarize recent institutional grades for Intel Corporation and Nova Ltd.:
Intel Corporation Grades
This table shows Intel’s most recent grades from reputable financial institutions.
| Grading Company | Action | New Grade | Date |
|---|---|---|---|
| RBC Capital | Maintain | Sector Perform | 2026-01-23 |
| Keybanc | Maintain | Overweight | 2026-01-23 |
| Evercore ISI Group | Maintain | In Line | 2026-01-23 |
| Needham | Maintain | Hold | 2026-01-23 |
| Benchmark | Maintain | Buy | 2026-01-23 |
| Rosenblatt | Maintain | Sell | 2026-01-23 |
| UBS | Maintain | Neutral | 2026-01-23 |
| Citigroup | Maintain | Neutral | 2026-01-23 |
| Stifel | Maintain | Hold | 2026-01-23 |
| Wedbush | Maintain | Neutral | 2026-01-23 |
Nova Ltd. Grades
This table presents Nova Ltd.’s latest grades from leading rating firms.
| Grading Company | Action | New Grade | Date |
|---|---|---|---|
| Needham | Upgrade | Buy | 2026-01-20 |
| B of A Securities | Maintain | Buy | 2026-01-13 |
| Jefferies | Maintain | Buy | 2025-12-15 |
| Evercore ISI Group | Maintain | Outperform | 2025-11-07 |
| Benchmark | Maintain | Buy | 2025-11-07 |
| Cantor Fitzgerald | Maintain | Overweight | 2025-06-24 |
| B of A Securities | Maintain | Buy | 2025-06-24 |
| Citigroup | Maintain | Buy | 2025-05-09 |
| Benchmark | Maintain | Buy | 2025-05-09 |
| B of A Securities | Maintain | Buy | 2025-04-16 |
Which company has the best grades?
Nova Ltd. consistently receives Buy and Outperform ratings, signaling stronger market confidence. Intel’s grades vary widely, from Sell to Buy, reflecting mixed institutional views. This divergence may affect investor sentiment and portfolio decisions.
Risks specific to each company
In 2026’s complex market, these categories reveal critical pressure points and systemic threats facing Intel Corporation and Nova Ltd.:
1. Market & Competition
Intel Corporation
- Faces intense competition from AMD and TSMC, with market share pressure and innovation demands.
Nova Ltd.
- Operates in niche semiconductor metrology with fewer direct competitors but high technological innovation risk.
2. Capital Structure & Debt
Intel Corporation
- Maintains moderate leverage with debt-to-assets at 22%, interest coverage moderate at 2.63x, signaling manageable but watchful debt risk.
Nova Ltd.
- Low debt burden (17% debt-to-assets) and strong interest coverage (116x) reflect a conservative capital structure.
3. Stock Volatility
Intel Corporation
- Beta of 1.35 indicates higher volatility than the market, with recent price drops signaling investor caution.
Nova Ltd.
- Higher beta at 1.83 shows elevated volatility; recent sharp price declines increase risk perception.
4. Regulatory & Legal
Intel Corporation
- Subject to US tech regulation and export controls affecting global operations and supply chains.
Nova Ltd.
- Faces regulatory scrutiny in Israel and US markets; potential impact from cross-border trade policies.
5. Supply Chain & Operations
Intel Corporation
- Complex global supply chain vulnerable to geopolitical tensions and semiconductor shortages.
Nova Ltd.
- Supply chain concentrated in Asia; sensitive to regional disruptions but benefits from focused specialization.
6. ESG & Climate Transition
Intel Corporation
- Under pressure to reduce carbon footprint and meet aggressive ESG goals amid investor scrutiny.
Nova Ltd.
- Emerging ESG programs but limited scale; climate transition risk lower given smaller footprint.
7. Geopolitical Exposure
Intel Corporation
- Global footprint exposes Intel to US-China tensions and trade restrictions impacting manufacturing and sales.
Nova Ltd.
- Israel-based with significant exposure to Middle East geopolitical risks and US-China trade dynamics.
Which company shows a better risk-adjusted profile?
Intel’s most impactful risk lies in competitive pressures and operational complexity, which have eroded profitability and ROIC. Nova’s key risk is elevated stock volatility and valuation premium, despite solid financial health. Nova’s superior Altman Z-score and profitability metrics demonstrate a stronger risk-adjusted profile, but its higher beta and valuation caution investors. Intel’s broader scale brings systemic risks but also resilience from diversification. Recent market reactions, including Intel’s negative net margin and Nova’s price correction, underscore these concerns. Overall, Nova offers a more favorable risk-return balance, assuming investors tolerate its volatility.
Final Verdict: Which stock to choose?
Intel Corporation’s superpower lies in its solid liquidity and disciplined capital structure. It maintains a favorable current ratio and manageable debt levels, offering a defensive cushion amid tech sector volatility. The main point of vigilance is its declining profitability and value destruction, which could pressure returns. Intel fits portfolios seeking steady exposure with moderate risk tolerance.
Nova Ltd. boasts a strategic moat through its growing profitability and efficient capital use, reflected in its improving ROIC and strong income quality. Its safety profile appears more robust than Intel’s, supported by excellent interest coverage and financial strength scores. Nova suits investors targeting growth with a reasonable buffer against market swings.
If you prioritize capital preservation and liquidity, Intel Corporation is the compelling choice due to its financial stability despite profitability challenges. However, if you seek accelerating growth and improving profitability, Nova Ltd. offers better upside potential with an expanding competitive position. Both present distinct analytical scenarios aligned to different investor profiles and risk appetites.
Disclaimer: Investment carries a risk of loss of initial capital. The past performance is not a reliable indicator of future results. Be sure to understand risks before making an investment decision.
Go Further
I encourage you to read the complete analyses of Intel Corporation and Nova Ltd. to enhance your investment decisions: