Home > Comparison > Technology > INTC vs MPWR
The strategic rivalry between Intel Corporation and Monolithic Power Systems defines the current trajectory of the semiconductor industry. Intel operates as a capital-intensive, diversified semiconductor giant with broad platform products. In contrast, Monolithic Power Systems focuses on high-margin, specialized power electronics solutions. This head-to-head pits scale and integration against innovation and agility. This analysis will determine which corporate strategy offers superior risk-adjusted returns for a diversified technology portfolio.
Table of contents
Companies Overview
Intel Corporation and Monolithic Power Systems, Inc. hold pivotal roles in the global semiconductor industry, shaping technology’s future.
Intel Corporation: Semiconductor Giant with Diverse Platforms
Intel dominates as a leading semiconductor company, generating revenue primarily from central processing units and chipsets. Its strategic focus in 2026 centers on expanding high-performance compute solutions for cloud providers, enterprise, and autonomous driving technologies. Intel leverages a broad product portfolio spanning platforms and adjacent segments to maintain its competitive edge.
Monolithic Power Systems, Inc.: Power Electronics Innovator
Monolithic Power Systems specializes in semiconductor-based power electronics for computing, automotive, and industrial markets. Its revenue engine relies on DC to DC integrated circuits that convert and control voltages across multiple applications. In 2026, the company emphasizes innovation in lighting control ICs and expanding global distribution channels to capture niche power management segments.
Strategic Collision: Similarities & Divergences
Both companies operate in semiconductors but pursue distinct philosophies: Intel offers a broad platform ecosystem, while Monolithic Power targets specialized power solutions. Their primary battleground lies in embedded and industrial applications where power efficiency and integration matter. Intel’s scale contrasts with Monolithic’s focused innovation, creating divergent investment profiles rooted in size and specialization.
Income Statement Comparison
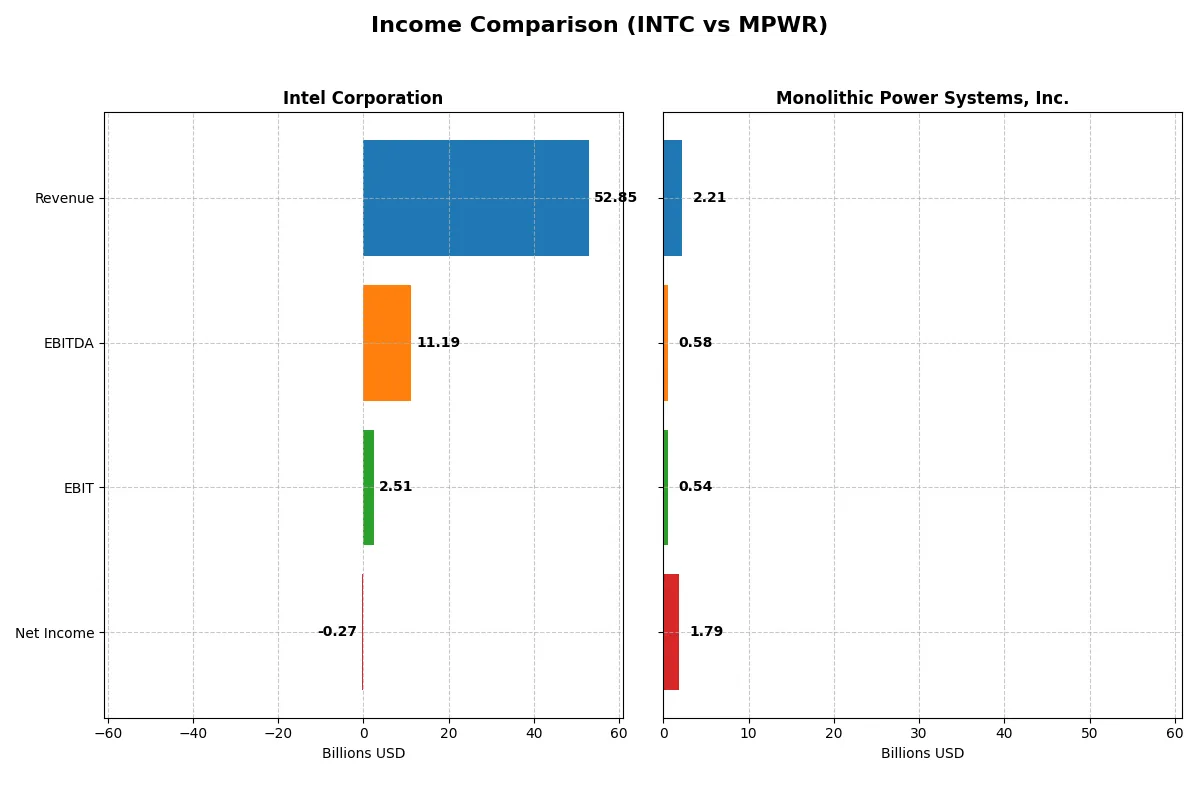
This data dissects the core profitability and scalability of both corporate engines to reveal who dominates the bottom line:
| Metric | Intel Corporation (INTC) | Monolithic Power Systems, Inc. (MPWR) |
|---|---|---|
| Revenue | 52.9B | 2.21B |
| Cost of Revenue | 34.4B | 986M |
| Operating Expenses | 20.6B | 682M |
| Gross Profit | 18.5B | 1.22B |
| EBITDA | 11.2B | 576M |
| EBIT | 2.51B | 539M |
| Interest Expense | 953M | 0 |
| Net Income | -267M | 1.79B |
| EPS | -0.08 | 36.76 |
| Fiscal Year | 2025 | 2024 |
Income Statement Analysis: The Bottom-Line Duel
This income statement comparison reveals which company runs the more efficient and profitable corporate engine through recent financial trends.
Intel Corporation Analysis
Intel’s revenue slipped slightly from $53.1B in 2024 to $52.9B in 2025. However, gross profit improved to $18.5B, boosting gross margins to nearly 35%. Despite this, net income turned negative, down to -$267M in 2025, reflecting margin pressure and operational challenges. The firm’s EBIT margin remains modest at 4.75%, signaling ongoing efficiency struggles.
Monolithic Power Systems, Inc. Analysis
MPWR surged revenue 21% to $2.2B in 2024, while gross profit jumped 20% to $1.22B, driving a robust 55% gross margin. Net income soared to $1.79B, with net margins exceeding 80%, showcasing exceptional profitability and capital allocation. EBIT margin at 24.4% confirms operational strength and sustained momentum in growth and earnings.
Verdict: Margin Power vs. Revenue Scale
MPWR clearly outperforms Intel on profitability and margin expansion, posting superior net and EBIT margins alongside strong revenue growth. Intel’s scale dwarfs MPWR’s but suffers from margin erosion and net losses recently. For investors prioritizing margin quality and earnings momentum, MPWR’s profile offers a more compelling, efficient growth story despite smaller size.
Financial Ratios Comparison
These vital ratios act as a diagnostic tool to expose the underlying fiscal health, valuation premiums, and capital efficiency of the companies compared below:
| Ratios | Intel Corporation (INTC) | Monolithic Power Systems, Inc. (MPWR) |
|---|---|---|
| ROE | -0.23% | 56.80% |
| ROIC | -0.02% | 16.22% |
| P/E | -658.38 | 16.09 |
| P/B | 1.54 | 9.14 |
| Current Ratio | 2.02 | 5.31 |
| Quick Ratio | 1.65 | 3.89 |
| D/E (Debt/Equity) | 0.41 | 0.01 |
| Debt-to-Assets | 22.03% | 0.44% |
| Interest Coverage | -2.23 | 0 |
| Asset Turnover | 0.25 | 0.61 |
| Fixed Asset Turnover | 0.50 | 4.17 |
| Payout ratio | 0 | 13.47% |
| Dividend yield | 0 | 0.84% |
| Fiscal Year | 2025 | 2024 |
Efficiency & Valuation Duel: The Vital Signs
Ratios act as a company’s DNA, exposing hidden risks and revealing operational strengths critical for investment decisions.
Intel Corporation
Intel posts unfavorable profitability metrics with a negative ROE (-0.23%) and net margin (-0.51%), signaling operational challenges. Its P/E ratio is deeply negative, reflecting losses or accounting anomalies, while P/S remains moderate. Intel carries no dividend, instead channeling cash into heavy R&D (26% of revenue), aiming to rebuild competitiveness amid stretched returns.
Monolithic Power Systems, Inc.
Monolithic Power delivers stellar profitability, boasting a 56.8% ROE and 81% net margin, highlighting operational excellence. Its valuation at a P/E of 16.1 appears reasonable given strong cash flows and returns. The company pays a modest dividend (0.84%) while investing significantly in R&D (14.7%), balancing shareholder rewards and growth.
Premium Profitability vs. Turnaround Risk
Monolithic Power’s ratios demonstrate superior efficiency and healthy cash generation, offering a favorable risk-reward profile. Intel’s negative earnings and stretched valuation reflect turnaround risks despite solid liquidity. Investors prioritizing growth and operational safety may lean toward Monolithic, while those favoring potential value recovery might consider Intel’s profile.
Which one offers the Superior Shareholder Reward?
I observe Intel Corporation (INTC) currently pays no dividend, reflecting strained free cash flow with negative FCF per share (-1.02 in 2025). Intel’s buybacks have slowed amid profit margin pressures and a near-zero net margin (-0.5%). Conversely, Monolithic Power Systems (MPWR) yields a modest 0.84% dividend, backed by robust FCF coverage (81%) and a strong buyback history. MPWR’s distribution model balances shareholder returns with sustainable growth, supported by a 24% EBIT margin and a pristine balance sheet. I conclude MPWR offers a superior total shareholder return profile in 2026 due to its disciplined capital allocation and consistent profitability.
Comparative Score Analysis: The Strategic Profile
The radar chart reveals the fundamental DNA and trade-offs of Intel Corporation and Monolithic Power Systems, Inc., highlighting their key financial strengths and weaknesses:
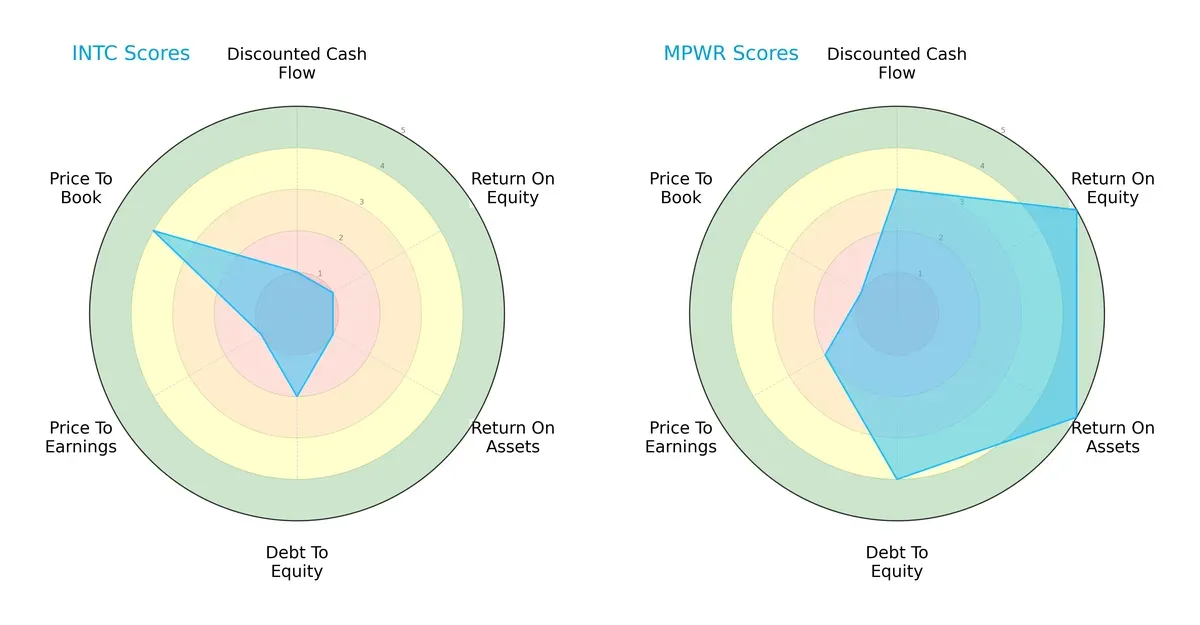
Monolithic Power Systems leads with a well-rounded profile, scoring high in ROE (5) and ROA (5), reflecting superior profitability and asset efficiency. Intel struggles with very unfavorable returns (ROE and ROA at 1) and discounted cash flow (1), but holds a favorable price-to-book score (4). Intel’s moderate debt-to-equity score (2) contrasts with MPWR’s stronger balance sheet (4). MPWR’s profile is more balanced, while Intel relies heavily on valuation metrics rather than operational efficiency.
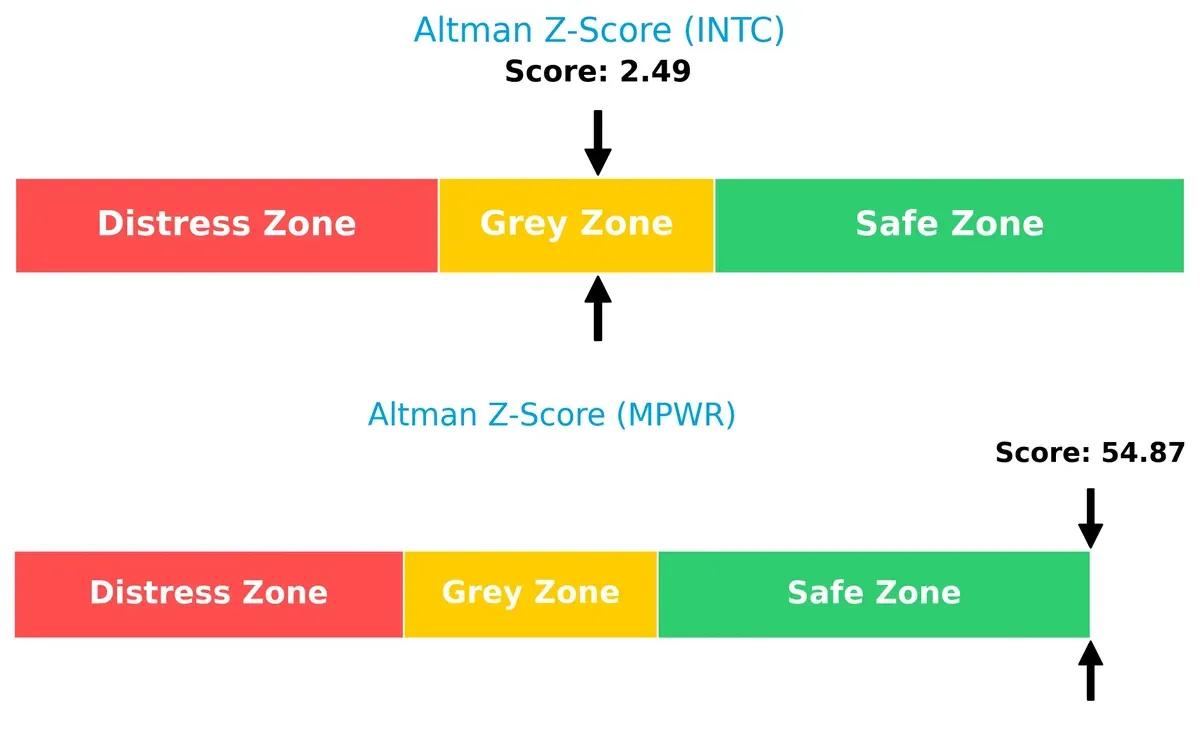
Bankruptcy Risk: Solvency Showdown
The Altman Z-Score gap sharply favors Monolithic Power Systems with a safe zone score of 54.9 versus Intel’s grey zone 2.5, implying MPWR’s robust financial stability and lower bankruptcy risk in this cycle:
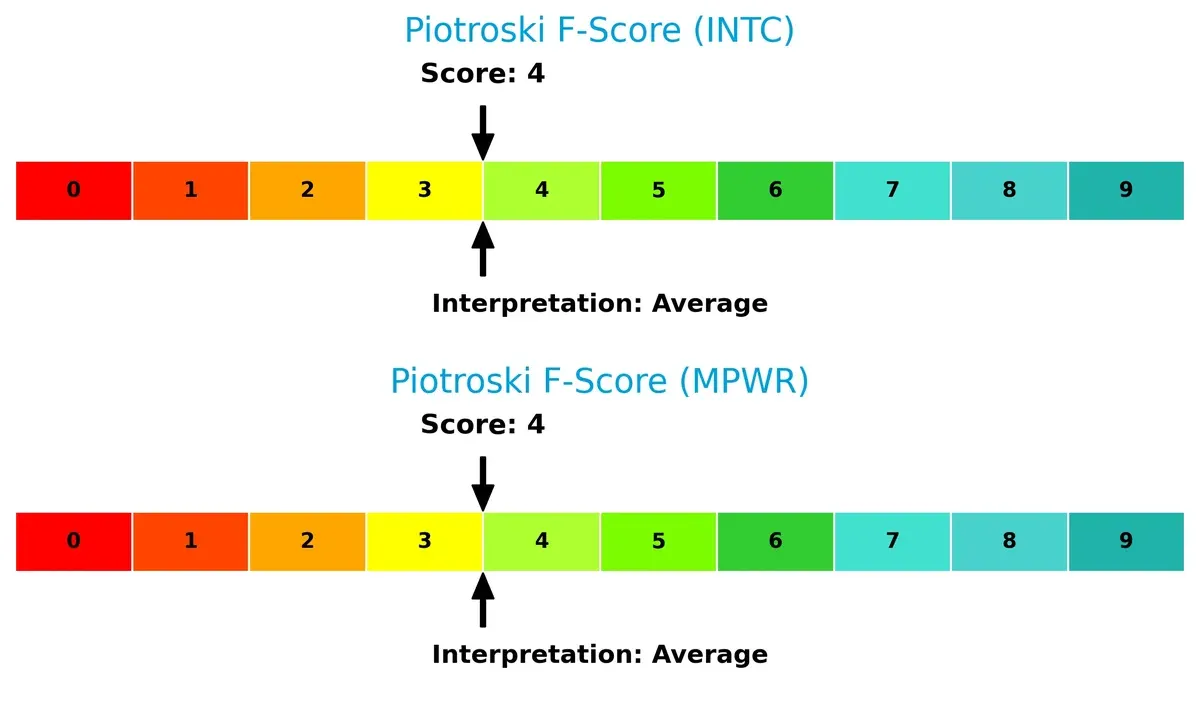
Financial Health: Quality of Operations
Both companies share an average Piotroski F-Score of 4, signaling moderate financial health. Neither exhibits clear red flags, but neither reaches the strong health benchmark above 7:
How are the two companies positioned?
This section dissects the operational DNA of Intel and Monolithic Power by comparing their revenue distribution and internal dynamics. The goal is to confront their economic moats and identify which model offers the most resilient, sustainable competitive advantage today.
Revenue Segmentation: The Strategic Mix
This visual comparison dissects how Intel Corporation and Monolithic Power Systems diversify their income streams and reveals where their primary sector bets lie:
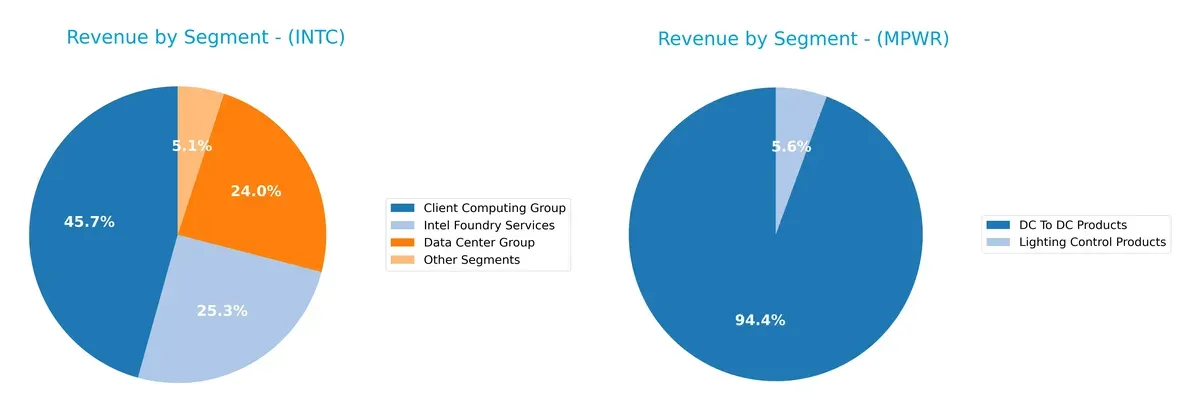
Intel’s revenue pivots across multiple large segments, with Client Computing Group at $32.2B and Intel Foundry Services at $17.8B anchoring its mix. Monolithic Power Systems relies heavily on DC To DC Products, $1.72B, dwarfing its smaller Lighting Control Products segment at $102M. Intel’s diversified portfolio reduces concentration risk, leveraging ecosystem lock-in. MPWR’s narrower focus signals infrastructure dominance but exposes it to sector-specific volatility.
Strengths and Weaknesses Comparison
This table compares the Strengths and Weaknesses of Intel Corporation and Monolithic Power Systems, Inc.:
INTC Strengths
- Diversified revenue streams across computing, data center, and foundry segments
- Favorable liquidity ratios with current ratio 2.02 and quick ratio 1.65
- Moderate leverage with debt-to-assets 22%
- Strong global presence with significant sales in US and Asia-Pacific
MPWR Strengths
- High profitability with net margin 80.95% and ROE 56.8%
- Excellent capital structure with low debt-to-assets 0.44% and infinite interest coverage
- Strong fixed asset turnover at 4.17 indicating efficient asset use
- Growing geographic diversification including China, Taiwan, and US
INTC Weaknesses
- Unfavorable profitability metrics: negative net margin (-0.51%) and ROE (-0.23%)
- Low asset turnover ratios indicate inefficiency
- No dividend yield risks shareholder returns
- Slightly unfavorable overall financial ratios with 43% unfavorable
- Exposure to China market risks with significant revenue
MPWR Weaknesses
- Higher WACC at 10.66%, increasing capital costs
- Unfavorable current ratio 5.31 may indicate liquidity concentration
- High price-to-book ratio 9.14 signals expensive valuation
- Dividend yield low at 0.84%, limiting income potential
Intel’s strengths lie in diversified segments and solid liquidity, but profitability challenges and asset inefficiencies persist. MPWR excels in profitability and capital efficiency but faces higher capital costs and valuation risks. Both companies’ global footprints influence their strategic positioning amid market cycles.
The Moat Duel: Analyzing Competitive Defensibility
A structural moat protects long-term profits from relentless competition and market pressures. Here’s how Intel and Monolithic Power Systems defend their turf:
Intel Corporation: Scale and Intangible Assets Moat
Intel leverages massive scale and decades of R&D to maintain its moat. Despite shrinking ROIC and value destruction through 2025, its broad product portfolio offers some margin stability. Future AI and autonomous driving platforms could deepen this advantage if execution improves.
Monolithic Power Systems, Inc.: Innovation and Operational Efficiency Moat
Monolithic Power’s moat stems from proprietary power IC designs and efficient capital use. Its ROIC outpaces WACC by 5.5%, showing robust value creation and margin expansion. Growing revenues and new market penetration in automotive and industrial sectors suggest a deepening moat in 2026.
Scale and Intangible Assets vs. Innovation and Efficiency
Monolithic Power demonstrates a wider and more durable moat with rising ROIC and consistent value creation. Intel’s legacy scale is under pressure with declining profitability. I see Monolithic Power better positioned to defend and expand market share moving forward.
Which stock offers better returns?
The past year reveals clear bullish momentum for both Intel Corporation and Monolithic Power Systems, with significant price gains and dynamic trading volumes shaping their trajectories.
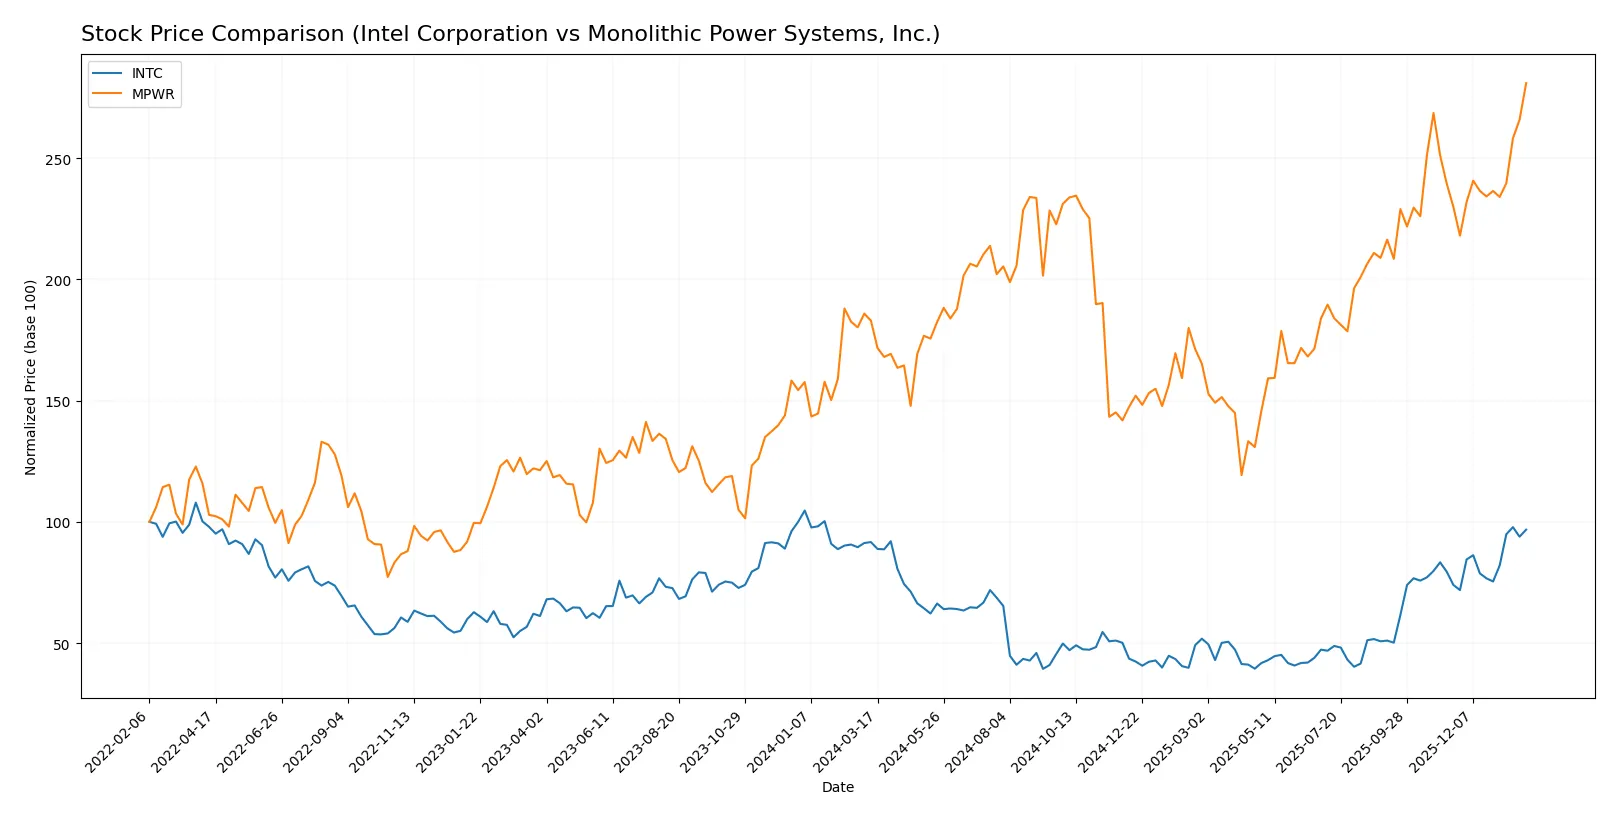
Trend Comparison
Intel Corporation’s stock rose 5.61% over the past 12 months, showing a bullish trend with accelerating momentum and moderate volatility (8.11 std deviation). Its price ranged between 18.89 and 46.96.
Monolithic Power Systems, Inc. gained 53.53% in the same period, displaying a strong bullish trend with accelerating momentum but much higher volatility (143.77 std deviation). Its price fluctuated from 477.39 to 1124.15.
Comparing both, Monolithic Power Systems delivered substantially higher market performance but with greater price volatility than Intel over the past year.
Target Prices
Analysts present a clear consensus on target prices for Intel Corporation and Monolithic Power Systems, Inc.
| Company | Target Low | Target High | Consensus |
|---|---|---|---|
| Intel Corporation | 20 | 66 | 46.95 |
| Monolithic Power Systems, Inc. | 1025 | 1375 | 1214.29 |
Intel’s consensus target of $46.95 closely matches its current price of $46.47, signaling balanced expectations. Monolithic Power’s consensus target at $1214.29 exceeds its current $1124.15 price, indicating upside potential according to analysts.

Don’t Let Luck Decide Your Entry Point
Optimize your entry points with our advanced ProRealTime indicators. You’ll get efficient buy signals with precise price targets for maximum performance. Start outperforming now!
How do institutions grade them?
Intel Corporation Grades
The following table summarizes Intel Corporation’s recent institutional grades:
| Grading Company | Action | New Grade | Date |
|---|---|---|---|
| RBC Capital | Maintain | Sector Perform | 2026-01-23 |
| Keybanc | Maintain | Overweight | 2026-01-23 |
| Evercore ISI Group | Maintain | In Line | 2026-01-23 |
| Needham | Maintain | Hold | 2026-01-23 |
| Benchmark | Maintain | Buy | 2026-01-23 |
| Rosenblatt | Maintain | Sell | 2026-01-23 |
| UBS | Maintain | Neutral | 2026-01-23 |
| Citigroup | Maintain | Neutral | 2026-01-23 |
| Stifel | Maintain | Hold | 2026-01-23 |
| Wedbush | Maintain | Neutral | 2026-01-23 |
Monolithic Power Systems, Inc. Grades
Below is a summary of Monolithic Power Systems, Inc.’s latest institutional grades:
| Grading Company | Action | New Grade | Date |
|---|---|---|---|
| Wells Fargo | Maintain | Overweight | 2026-01-26 |
| Wells Fargo | Upgrade | Overweight | 2026-01-15 |
| Truist Securities | Maintain | Buy | 2025-12-19 |
| Citigroup | Maintain | Buy | 2025-11-03 |
| TD Cowen | Maintain | Buy | 2025-10-31 |
| Keybanc | Maintain | Overweight | 2025-10-31 |
| Rosenblatt | Maintain | Neutral | 2025-10-31 |
| Keybanc | Maintain | Overweight | 2025-10-23 |
| Wells Fargo | Maintain | Equal Weight | 2025-10-20 |
| Stifel | Maintain | Buy | 2025-10-17 |
Which company has the best grades?
Monolithic Power Systems, Inc. displays stronger and more consistent buy and overweight ratings compared to Intel Corporation’s mixed grades. This divergence may influence investor sentiment, favoring Monolithic Power’s growth prospects over Intel’s more cautious outlook.
Risks specific to each company
The following categories identify the critical pressure points and systemic threats facing both firms in the 2026 market environment:
1. Market & Competition
Intel Corporation
- Faces intense rivalry in semiconductors with pressure on margins due to legacy product cycles.
Monolithic Power Systems, Inc.
- Operates in niche power electronics with strong growth but faces risk from emerging competitors.
2. Capital Structure & Debt
Intel Corporation
- Moderate debt levels with debt-to-assets at 22%, manageable but interest coverage is only neutral at 2.63x.
Monolithic Power Systems, Inc.
- Exceptionally low debt with 0.44% debt-to-assets and infinite interest coverage, signaling strong balance sheet.
3. Stock Volatility
Intel Corporation
- Beta at 1.35, reflecting above-average volatility linked to sector cyclicality and business challenges.
Monolithic Power Systems, Inc.
- Higher beta at 1.46, indicating greater sensitivity to market swings despite solid fundamentals.
4. Regulatory & Legal
Intel Corporation
- Subject to global antitrust scrutiny and export controls impacting supply chains and growth.
Monolithic Power Systems, Inc.
- Faces regulatory risks in international markets but less exposed to antitrust issues due to smaller scale.
5. Supply Chain & Operations
Intel Corporation
- Complex manufacturing exposes it to operational disruptions and capital-intensive upgrades.
Monolithic Power Systems, Inc.
- Relies on third-party distributors and OEMs, which can cause supply chain dependency risks.
6. ESG & Climate Transition
Intel Corporation
- Increasing pressure to reduce carbon footprint amid legacy fabs; actively investing in green tech.
Monolithic Power Systems, Inc.
- Smaller footprint with less regulatory pressure but must adapt to evolving industry ESG standards.
7. Geopolitical Exposure
Intel Corporation
- Significant exposure to US-China tensions affecting manufacturing and sales.
Monolithic Power Systems, Inc.
- Diverse international sales, less concentrated risk but still susceptible to trade disruptions.
Which company shows a better risk-adjusted profile?
Intel’s biggest risk is its operational complexity and legacy exposure, impacting profitability and capital intensity. Monolithic Power’s primary risk lies in valuation stretch and dependency on third-party supply channels. I see Monolithic Power as having a better risk-adjusted profile, supported by a strong balance sheet and superior profitability metrics despite higher volatility. Intel’s negative net margin and weak returns in 2025 reinforce my caution.
Final Verdict: Which stock to choose?
Intel’s superpower lies in its scale and entrenched industry presence, offering a foundation to potentially rebound in a cyclical upturn. However, its declining profitability and value destruction signal a point of vigilance for investors. Intel fits portfolios seeking turnaround opportunities with a tolerance for operational risk.
Monolithic Power Systems commands a durable moat with strong returns on invested capital and accelerating profitability. Its lean balance sheet and consistent cash generation provide a safety profile superior to Intel’s. MPWR suits growth-oriented portfolios focused on quality and sustainable competitive advantages.
If you prioritize value creation through proven profitability and operational efficiency, MPWR outshines Intel with its durable moat and financial strength. However, if your strategy favors cyclical recovery and scale, Intel offers a compelling scenario despite its current challenges. Both require careful risk assessment aligned to investor profiles.
Disclaimer: Investment carries a risk of loss of initial capital. The past performance is not a reliable indicator of future results. Be sure to understand risks before making an investment decision.
Go Further
I encourage you to read the complete analyses of Intel Corporation and Monolithic Power Systems, Inc. to enhance your investment decisions: