Home > Comparison > Technology > INTC vs MU
The strategic rivalry between Intel Corporation and Micron Technology defines the current trajectory of the semiconductor industry. Intel operates as a diversified technology giant with a broad product portfolio spanning CPUs, platforms, and AI solutions. In contrast, Micron focuses on high-margin memory and storage products, specializing in DRAM and NAND technologies. This analysis will assess which company offers the superior risk-adjusted return, guiding investors seeking durable leadership in semiconductors.
Table of contents
Companies Overview
Intel Corporation and Micron Technology, Inc. remain pivotal players shaping the semiconductor industry’s future.
Intel Corporation: Semiconductor Platform Innovator
Intel dominates as a leading semiconductor designer and manufacturer. It generates revenue through central processing units, chipsets, and diverse platform products. In 2026, Intel focuses strategically on high-performance compute solutions and advanced AI partnerships, targeting cloud providers, industrial applications, and autonomous driving technologies.
Micron Technology, Inc.: Memory and Storage Specialist
Micron excels as a top memory and storage products manufacturer. It earns primarily from DRAM, NAND, and NOR memory solutions servicing cloud, mobile, and enterprise markets. In 2026, Micron prioritizes expanding its memory technologies across cloud servers, consumer electronics, and automotive sectors to capture rising demand.
Strategic Collision: Similarities & Divergences
Both companies operate in semiconductors but differ sharply. Intel pursues a diversified platform approach blending processors with AI and embedded solutions, emphasizing vertical integration. Micron concentrates on specialized memory innovation, relying on broad market penetration. Their primary battleground lies in cloud infrastructure components. Intel offers a complex ecosystem; Micron delivers focused memory expertise. Each presents distinct investment profiles rooted in scale and specialization.
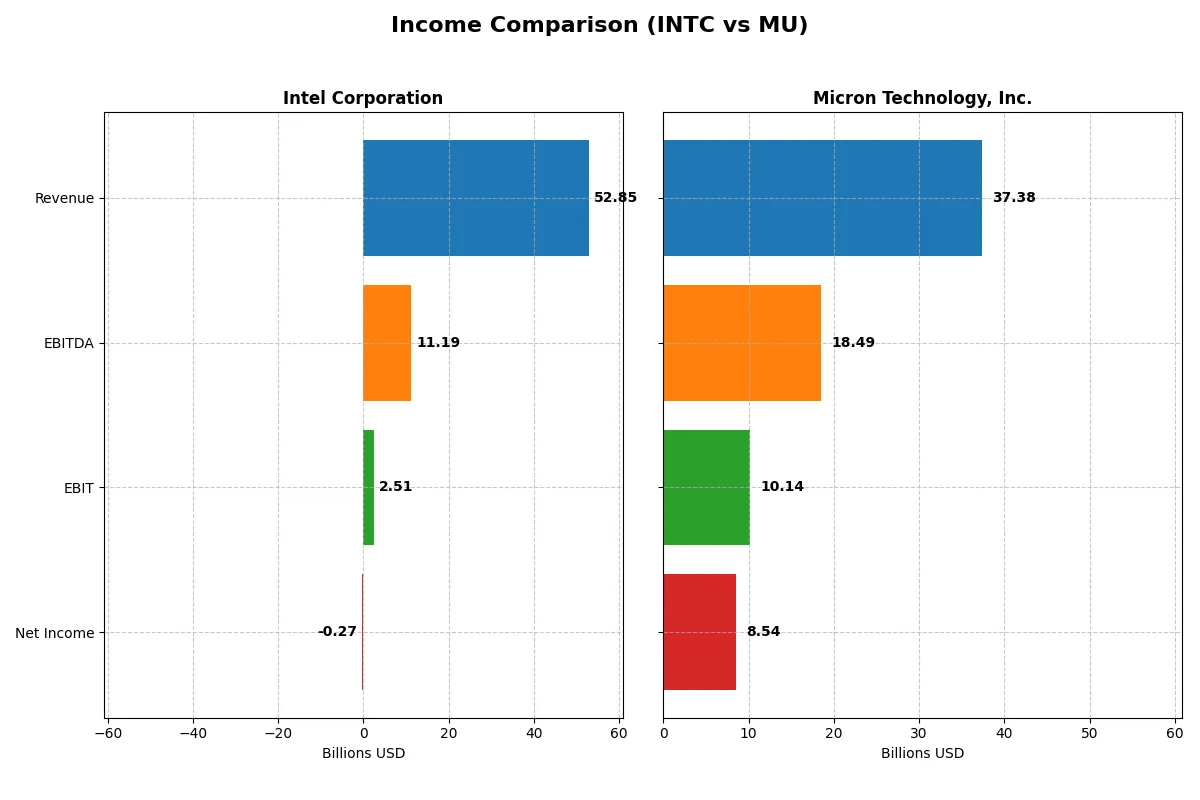
Income Statement Comparison
This data dissects the core profitability and scalability of both corporate engines to reveal who dominates the bottom line:
| Metric | Intel Corporation (INTC) | Micron Technology, Inc. (MU) |
|---|---|---|
| Revenue | 52.9B | 37.4B |
| Cost of Revenue | 34.4B | 22.5B |
| Operating Expenses | 20.6B | 5.0B |
| Gross Profit | 18.5B | 14.9B |
| EBITDA | 11.2B | 18.5B |
| EBIT | 2.5B | 10.1B |
| Interest Expense | 0.95B | 0.48B |
| Net Income | -0.27B | 8.54B |
| EPS | -0.08 | 7.65 |
| Fiscal Year | 2025 | 2025 |
Income Statement Analysis: The Bottom-Line Duel
This income statement comparison exposes each company’s operational efficiency and profitability trends from 2021 to 2025.
Intel Corporation Analysis
Intel’s revenue steadily declined from 79B in 2021 to 53B in 2025, reflecting shrinking top-line scale. Gross margin softened but remained near 35%, showing resilient cost control. Net income swung from a strong 20B profit in 2021 to a 267M loss in 2025, revealing margin pressure and operational challenges despite a recent rebound in EBIT and net margin growth.
Micron Technology, Inc. Analysis
Micron’s revenue surged from 27.7B in 2021 to 37.4B in 2025, signaling strong market expansion. Gross margin expanded to nearly 40%, with EBIT margin impressively climbing to 27% in 2025. The firm delivered consistent net income growth, reaching 8.5B in 2025, supported by robust operational leverage and margin improvement across all key metrics.
Margin Resilience vs. Growth Momentum
Micron outperforms Intel in revenue growth, margin expansion, and net income trajectory over five years. Intel struggles with declining sales and profitability despite cost containment, while Micron leverages rising demand and operational efficiency. For investors, Micron’s growth and margin profile offers a more compelling fundamental story than Intel’s recent volatility.
Financial Ratios Comparison
These vital ratios act as a diagnostic tool to expose the underlying fiscal health, valuation premiums, and capital efficiency of the companies compared below:
| Ratios | Intel Corporation (INTC) | Micron Technology, Inc. (MU) |
|---|---|---|
| ROE | -0.23% | 15.76% |
| ROIC | -0.02% | 12.12% |
| P/E | -658.38 | 15.94 |
| P/B | 1.54 | 2.51 |
| Current Ratio | 2.02 | 2.52 |
| Quick Ratio | 1.65 | 1.79 |
| D/E | 0.41 | 0.28 |
| Debt-to-Assets | 22.03% | 18.45% |
| Interest Coverage | -2.23 | 20.69 |
| Asset Turnover | 0.25 | 0.45 |
| Fixed Asset Turnover | 0.50 | 0.79 |
| Payout ratio | 0 | 6.11% |
| Dividend yield | 0 | 0.38% |
| Fiscal Year | 2025 | 2025 |
Efficiency & Valuation Duel: The Vital Signs
Ratios act as the company’s DNA, revealing hidden risks and operational excellence behind headline numbers.
Intel Corporation
Intel displays weak profitability with a negative ROE of -0.23% and a net margin of -0.51%, signaling operational struggles. Its valuation appears attractive with a strongly favorable negative P/E, but asset turnover metrics remain unfavorable. The company currently offers no dividends, focusing capital allocation on R&D at 26% of revenue, aiming for future growth despite current inefficiencies.
Micron Technology, Inc.
Micron exhibits robust profitability, with a favorable ROE of 15.76% and a strong net margin of 22.84%. Its P/E ratio of 15.94 suggests fair valuation relative to profits, though ROIC underperforms WACC, hinting at some capital allocation challenges. Micron maintains shareholder value with modest dividends (0.38%), balancing payout with reinvestment in innovation and operational efficiency.
Premium Valuation vs. Operational Safety
Micron offers a better balance of profitability and manageable valuation risks than Intel, whose negative returns signal caution. Investors seeking operational strength and steady returns may prefer Micron’s profile, while Intel’s value appeal carries higher risk amid persistent losses.
Which one offers the Superior Shareholder Reward?
Intel Corporation (INTC) pays no dividend in 2025, reflecting strained free cash flow (-1B) and a suspension of payouts. Its buyback program is also minimal given negative net margins. Micron Technology, Inc. (MU) yields a modest 0.38% dividend with a low 6% payout ratio, supported by solid free cash flow (1.5B). MU’s aggressive buybacks and stable margins underpin sustainable shareholder returns. I conclude MU offers a superior total return profile in 2026 due to its balanced distribution and cash flow health, while INTC’s zero dividend and negative free cash flow signal riskier reward prospects.
Comparative Score Analysis: The Strategic Profile
The radar chart reveals the fundamental DNA and trade-offs of Intel Corporation and Micron Technology, Inc., highlighting their core financial strengths and vulnerabilities:
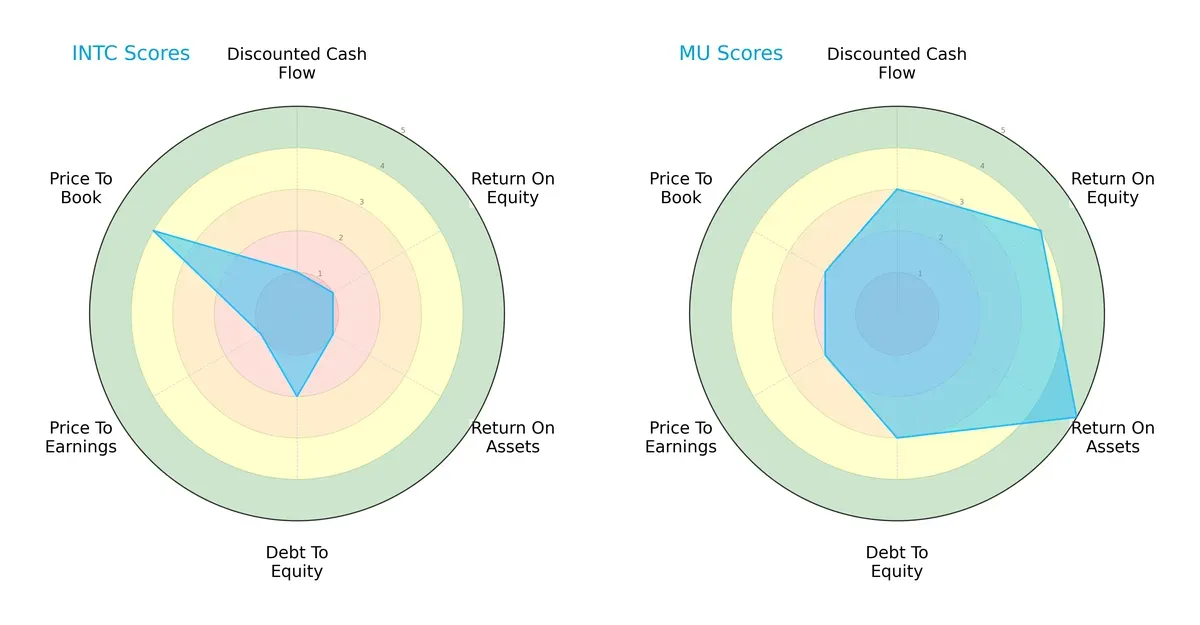
Micron outperforms Intel with higher scores in discounted cash flow (3 vs. 1), return on equity (4 vs. 1), and return on assets (5 vs. 1), indicating superior profitability and asset utilization. Intel’s strength lies in its price-to-book score (4 vs. 2), suggesting better market valuation relative to book value. Intel’s moderate debt-to-equity score (2) reflects a stronger balance sheet than Micron’s (3), but overall, Micron presents a more balanced and robust financial profile while Intel relies on valuation appeal.
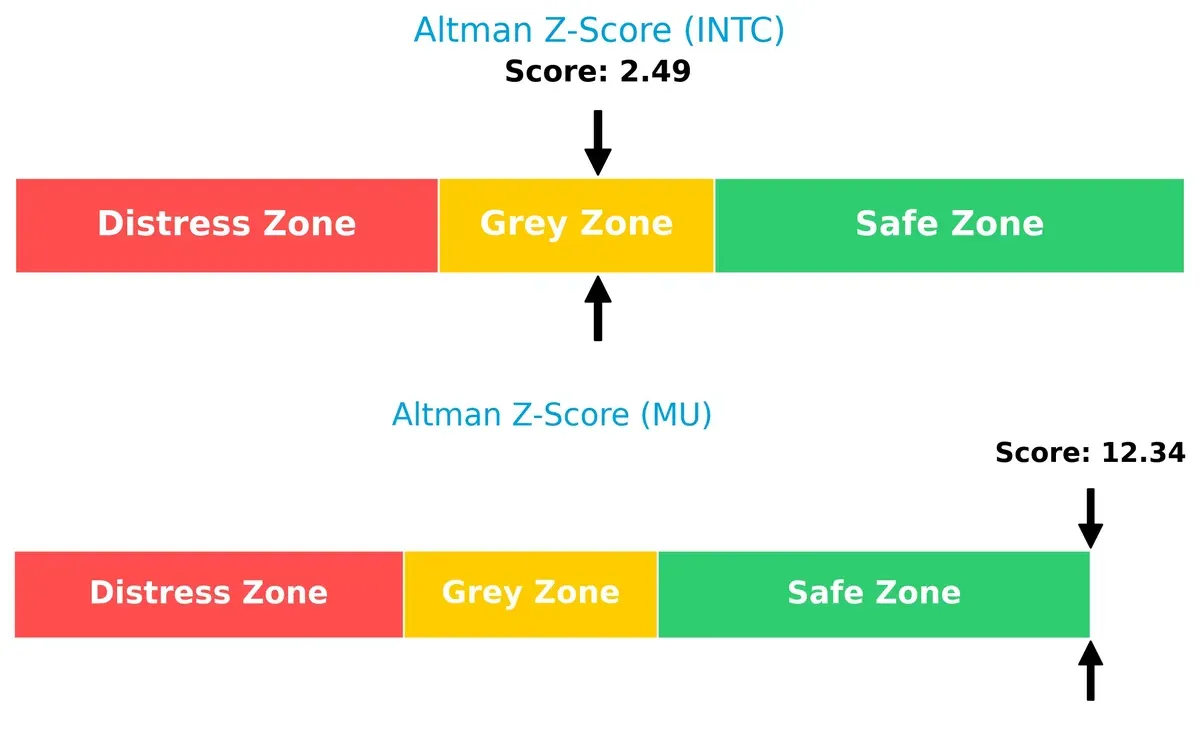
Bankruptcy Risk: Solvency Showdown
Micron’s Altman Z-Score (12.3) far exceeds Intel’s (2.5), placing Micron firmly in the safe zone and Intel in the grey zone. This gap signals Micron’s superior solvency and lower bankruptcy risk in the current economic cycle:
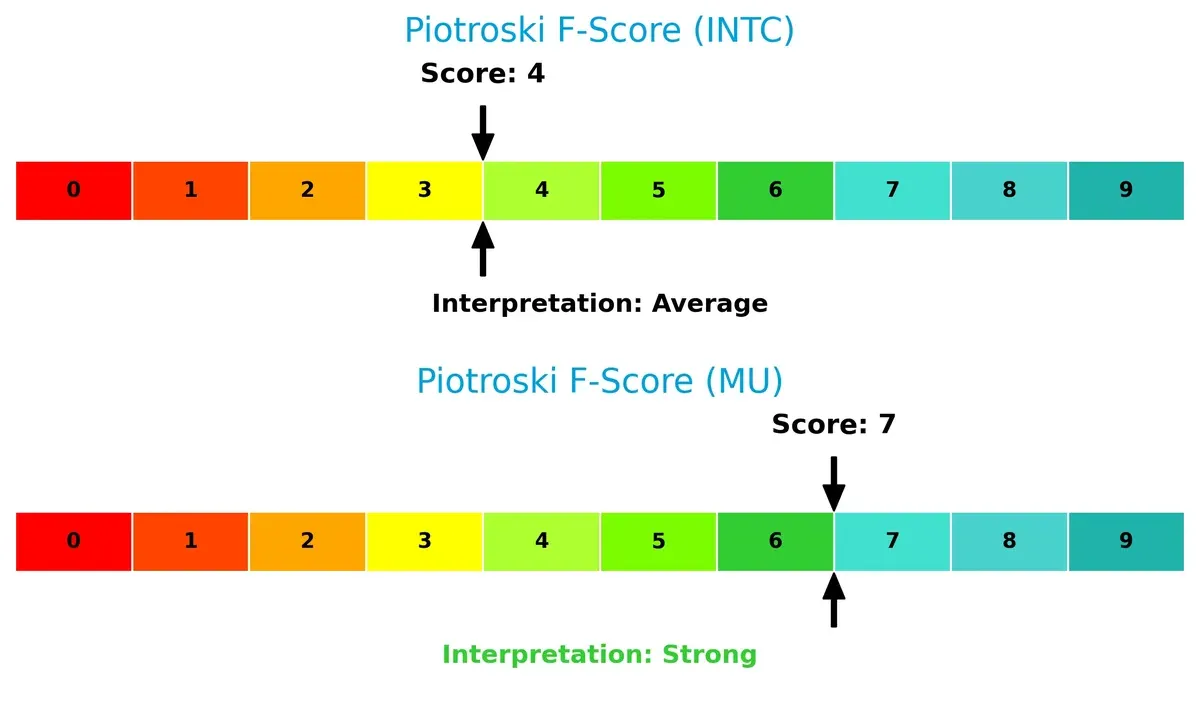
Financial Health: Quality of Operations
Micron’s Piotroski F-Score of 7 reflects strong financial health, while Intel’s score of 4 suggests average operational quality with potential red flags. Micron shows better internal metrics and operational efficiency compared to Intel’s tepid performance:
How are the two companies positioned?
This section dissects the operational DNA of Intel and Micron by comparing revenue distribution and internal dynamics. The goal is to confront their economic moats, revealing which model offers the most resilient competitive edge today.
Revenue Segmentation: The Strategic Mix
This visual comparison dissects how Intel Corporation and Micron Technology diversify their income streams and where their primary sector bets lie:
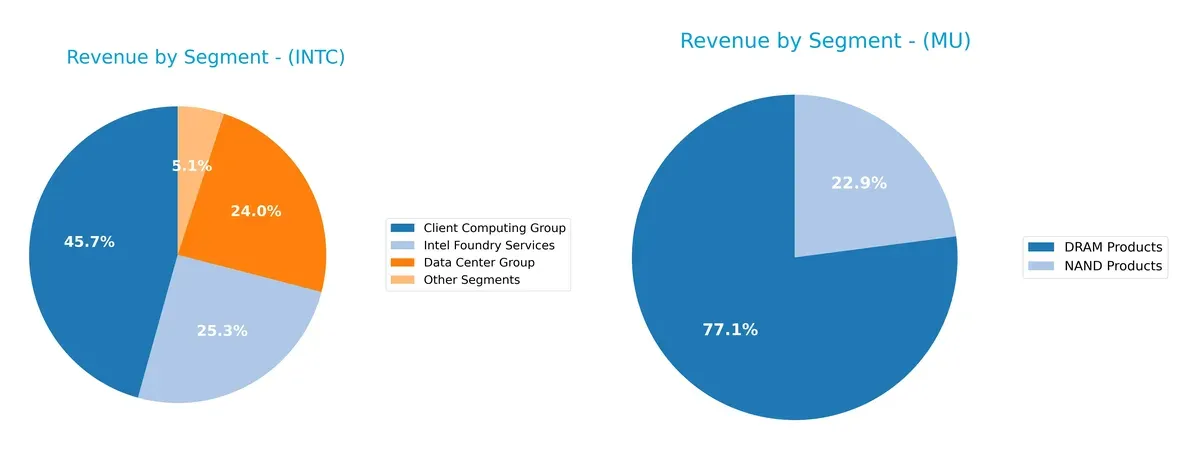
Intel’s 2025 revenue splits across Client Computing Group ($32.2B), Intel Foundry Services ($17.8B), and Data Center Group ($16.9B), showing moderate diversification. Micron, however, anchors its 2025 revenue heavily in DRAM Products ($28.6B), dwarfing NAND Products ($8.5B). Intel’s broad mix reduces concentration risk and leverages ecosystem lock-in, while Micron’s focus on memory products exposes it to cyclical demand swings but reinforces infrastructure dominance in memory markets.
Strengths and Weaknesses Comparison
This table compares the strengths and weaknesses of Intel Corporation and Micron Technology, Inc.:
Intel Corporation Strengths
- Diverse revenue streams across computing, data center, and foundry segments
- Solid current and quick ratios indicating strong liquidity
- Moderate debt levels with favorable debt-to-assets ratio
- Global presence with significant sales in US, China, and Asia
Micron Technology Strengths
- High net margin and ROE reflecting strong profitability
- Favorable liquidity ratios and low debt levels
- Robust interest coverage showing strong earnings to cover debt
- Concentrated but significant US market presence with growing Asia sales
Intel Corporation Weaknesses
- Negative profitability ratios including net margin, ROE, and ROIC
- Low asset turnover indicating inefficient asset use
- Zero dividend yield limits income appeal
- Slightly unfavorable overall ratios reflecting operational challenges
Micron Technology Weaknesses
- High WACC suggests expensive capital relative to returns
- Unfavorable ROIC and asset turnover ratios signal efficiency issues
- Low dividend yield may deter income-focused investors
Intel shows broad diversification but faces profitability and efficiency challenges. Micron excels in profitability and capital structure but faces cost of capital and efficiency pressures. Both must balance growth investments with operational improvements.
The Moat Duel: Analyzing Competitive Defensibility
A structural moat is the only reliable shield protecting long-term profits from relentless competitive erosion in the semiconductor industry:
Intel Corporation: Legacy Scale and Innovation Moat
Intel’s primary moat lies in its vast manufacturing scale and R&D-driven product pipeline. Despite a very unfavorable ROIC trend, its gross margin resilience and product diversification offer some defense. The 2026 outlook hinges on successful execution in high-performance computing and AI chips to restore profitability.
Micron Technology, Inc.: Focused Memory Market Moat
Micron leverages a cost advantage and specialized memory technology, contrasting Intel’s broader platform approach. Its slightly unfavorable but improving ROIC and stellar margin expansion signal strengthening competitive positioning. Growth in cloud and automotive memory markets could deepen Micron’s moat in 2026.
Manufacturing Scale vs. Specialized Memory: The Moat Battle
Micron holds a deeper and more durable moat with rising profitability and focused market leadership. Intel’s legacy scale is under pressure, making Micron better equipped to defend and expand market share in 2026.
Which stock offers better returns?
Over the past year, Intel and Micron stocks both showed strong gains, with Micron’s price surge far surpassing Intel’s steady acceleration in market value.
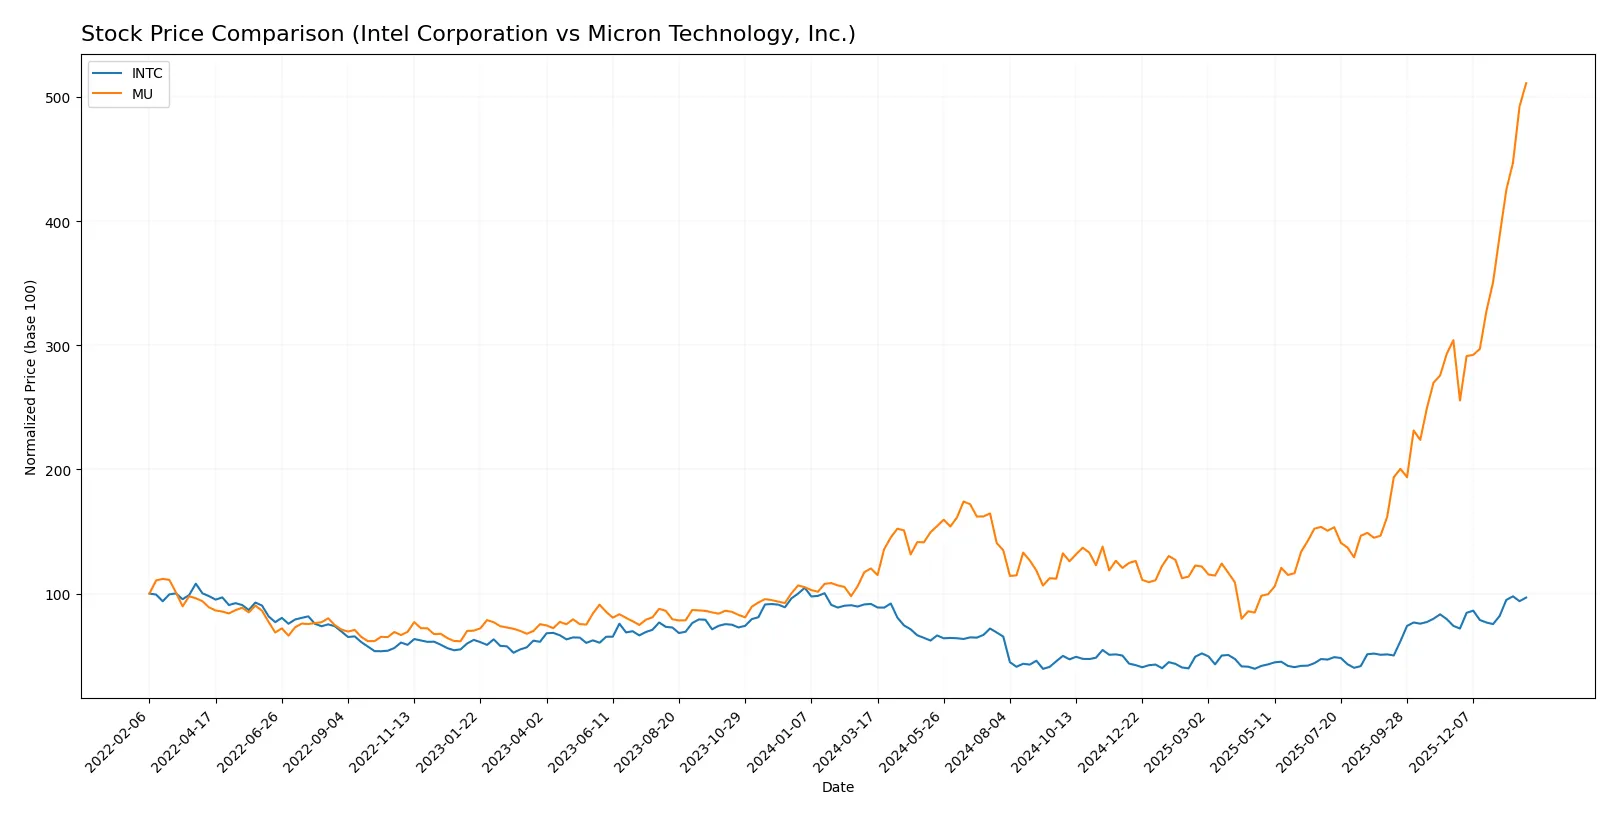
Trend Comparison
Intel’s stock rose 5.61% over 12 months, showing a bullish trend with accelerating momentum and moderate volatility (8.11 std deviation). The price ranged from $18.89 to $46.96.
Micron’s stock soared 324.99% over the same period, displaying a bullish trend with strong acceleration but high volatility (70.04 std deviation). Prices fluctuated between $64.72 and $414.88.
Micron dramatically outperformed Intel, delivering the highest market returns and stronger recent price acceleration.
Target Prices
Analysts present mixed yet optimistic target prices for Intel Corporation and Micron Technology, reflecting sector volatility and growth potential.
| Company | Target Low | Target High | Consensus |
|---|---|---|---|
| Intel Corporation | 20 | 66 | 46.95 |
| Micron Technology, Inc. | 190 | 480 | 345.61 |
Intel’s consensus target of $46.95 closely aligns with its current price of $46.47, indicating moderate upside potential. Micron’s consensus target of $345.61 is significantly below its current price of $414.88, suggesting a cautious analyst stance despite recent strength.

Don’t Let Luck Decide Your Entry Point
Optimize your entry points with our advanced ProRealTime indicators. You’ll get efficient buy signals with precise price targets for maximum performance. Start outperforming now!
How do institutions grade them?
Intel Corporation Grades
Here are the latest grades assigned by reputable institutions for Intel Corporation:
| Grading Company | Action | New Grade | Date |
|---|---|---|---|
| RBC Capital | maintain | Sector Perform | 2026-01-23 |
| Keybanc | maintain | Overweight | 2026-01-23 |
| Evercore ISI Group | maintain | In Line | 2026-01-23 |
| Needham | maintain | Hold | 2026-01-23 |
| Benchmark | maintain | Buy | 2026-01-23 |
| Rosenblatt | maintain | Sell | 2026-01-23 |
| UBS | maintain | Neutral | 2026-01-23 |
| Citigroup | maintain | Neutral | 2026-01-23 |
| Stifel | maintain | Hold | 2026-01-23 |
| Wedbush | maintain | Neutral | 2026-01-23 |
Micron Technology, Inc. Grades
Below are the current grades from established grading companies for Micron Technology, Inc.:
| Grading Company | Action | New Grade | Date |
|---|---|---|---|
| Mizuho | maintain | Outperform | 2026-01-27 |
| TD Cowen | maintain | Buy | 2026-01-20 |
| Stifel | maintain | Buy | 2026-01-20 |
| Rosenblatt | maintain | Buy | 2026-01-20 |
| Wells Fargo | maintain | Overweight | 2026-01-15 |
| Citigroup | maintain | Buy | 2026-01-15 |
| Cantor Fitzgerald | maintain | Overweight | 2026-01-14 |
| B of A Securities | maintain | Buy | 2026-01-13 |
| Keybanc | maintain | Overweight | 2026-01-13 |
| Lynx Global | maintain | Buy | 2026-01-12 |
Which company has the best grades?
Micron Technology, Inc. consistently receives stronger grades, including multiple “Buy” and “Outperform” ratings. Intel’s grades are more mixed, ranging from “Sell” to “Buy.” This divergence may impact investor sentiment and perceived growth prospects.
Risks specific to each company
The following categories identify the critical pressure points and systemic threats facing both firms in the 2026 market environment:
1. Market & Competition
Intel Corporation
- Faces intense competition in CPUs and adjacent tech, with negative profitability metrics signaling operational challenges.
Micron Technology, Inc.
- Strong position in memory markets with solid profitability but exposed to cyclical demand fluctuations in DRAM and NAND segments.
2. Capital Structure & Debt
Intel Corporation
- Moderate debt-to-equity ratio (0.41) with neutral interest coverage (2.63x); manageable but requires vigilance amid profitability weakness.
Micron Technology, Inc.
- Lower leverage (D/E 0.28) and strong interest coverage (21.26x) indicate robust debt management and financial flexibility.
3. Stock Volatility
Intel Corporation
- Beta of 1.35 suggests moderately high volatility relative to the market, raising risk for conservative investors.
Micron Technology, Inc.
- Higher beta of 1.50 signals greater sensitivity to market swings, increasing risk but also potential for higher returns.
4. Regulatory & Legal
Intel Corporation
- Subject to antitrust scrutiny and technology export controls impacting global operations and innovation pace.
Micron Technology, Inc.
- Faces regulatory risks tied to environmental compliance and international trade policies, particularly in semiconductor supply chains.
5. Supply Chain & Operations
Intel Corporation
- Complex manufacturing exposes Intel to supply disruptions and capital expenditure risks amid asset turnover inefficiencies.
Micron Technology, Inc.
- More streamlined operations but reliant on wafer supply and raw materials that are vulnerable to geopolitical tensions.
6. ESG & Climate Transition
Intel Corporation
- Increasing pressure to reduce carbon footprint and improve social governance amid investor demand for sustainability.
Micron Technology, Inc.
- Stronger ESG initiatives but must address energy-intensive production processes to align with climate goals.
7. Geopolitical Exposure
Intel Corporation
- Significant exposure to US-China tensions affecting export controls and market access in key regions.
Micron Technology, Inc.
- Similar geopolitical risks, especially related to memory chip sales in Asia and supply chain dependencies.
Which company shows a better risk-adjusted profile?
Micron’s primary risk lies in cyclicality and geopolitical tensions, but it maintains stronger profitability and financial health. Intel struggles with profitability and operational efficiency, increasing risk despite lower leverage. Recent financial scores confirm Micron’s superior stability and risk management.
Final Verdict: Which stock to choose?
Intel’s superpower lies in its robust liquidity and solid balance sheet, offering resilience amid industry volatility. However, its declining profitability and value destruction remain points of vigilance. Intel suits portfolios seeking steady, defensive exposure within cyclical tech sectors.
Micron’s strategic moat is its strong margin expansion and improving profitability, driven by efficient capital use and operational momentum. It presents a safer financial profile than Intel, underpinned by healthier cash flows. Micron fits portfolios targeting GARP—growth balanced with reasonable valuation.
If you prioritize balance sheet strength and defensive positioning, Intel is the compelling choice due to its liquidity and stability. However, if you seek growth backed by improving profitability and operational efficiency, Micron offers better momentum and financial health. Both carry risks tied to semiconductor cyclicality and capital intensity.
Disclaimer: Investment carries a risk of loss of initial capital. The past performance is not a reliable indicator of future results. Be sure to understand risks before making an investment decision.
Go Further
I encourage you to read the complete analyses of Intel Corporation and Micron Technology, Inc. to enhance your investment decisions: