Home > Comparison > Technology > INTC vs MCHP
The strategic rivalry between Intel Corporation and Microchip Technology Incorporated shapes the semiconductor industry’s evolution. Intel operates as a capital-intensive giant with a broad portfolio spanning CPUs, chipsets, and AI-driven platforms. Microchip, a specialized embedded control solutions provider, focuses on niche microcontrollers and analog products. This analysis contrasts their operational models to identify which trajectory offers superior risk-adjusted returns in a sector defined by rapid innovation and cyclical demand.
Table of contents
Companies Overview
Intel Corporation and Microchip Technology Incorporated both play pivotal roles in the semiconductor industry, shaping global technology landscapes.
Intel Corporation: Global Semiconductor Powerhouse
Intel dominates as a leading semiconductor manufacturer specializing in CPUs, chipsets, and system-on-chip packages. Its core revenue stems from platform products serving cloud providers, enterprises, and embedded markets. In 2026, Intel strategically advances AI-enhanced compute solutions and autonomous driving technologies to expand its competitive moat.
Microchip Technology Incorporated: Embedded Control Specialist
Microchip excels in embedded control solutions, providing microcontrollers, analog products, and FPGA devices. Its revenue hinges on diversified microcontroller sales across automotive and industrial sectors. The company’s 2026 focus targets secure, smart connectivity and licensing of embedded flash technologies to deepen its niche market penetration.
Strategic Collision: Similarities & Divergences
Intel and Microchip share a commitment to semiconductor innovation but diverge sharply in scale and scope. Intel pursues a broad, integrated platform approach, while Microchip targets specialized embedded applications. Their primary battleground lies in serving evolving IoT and industrial automation demands. This contrast defines distinct investment profiles: Intel as a diversified tech giant, Microchip as a focused embedded solutions leader.
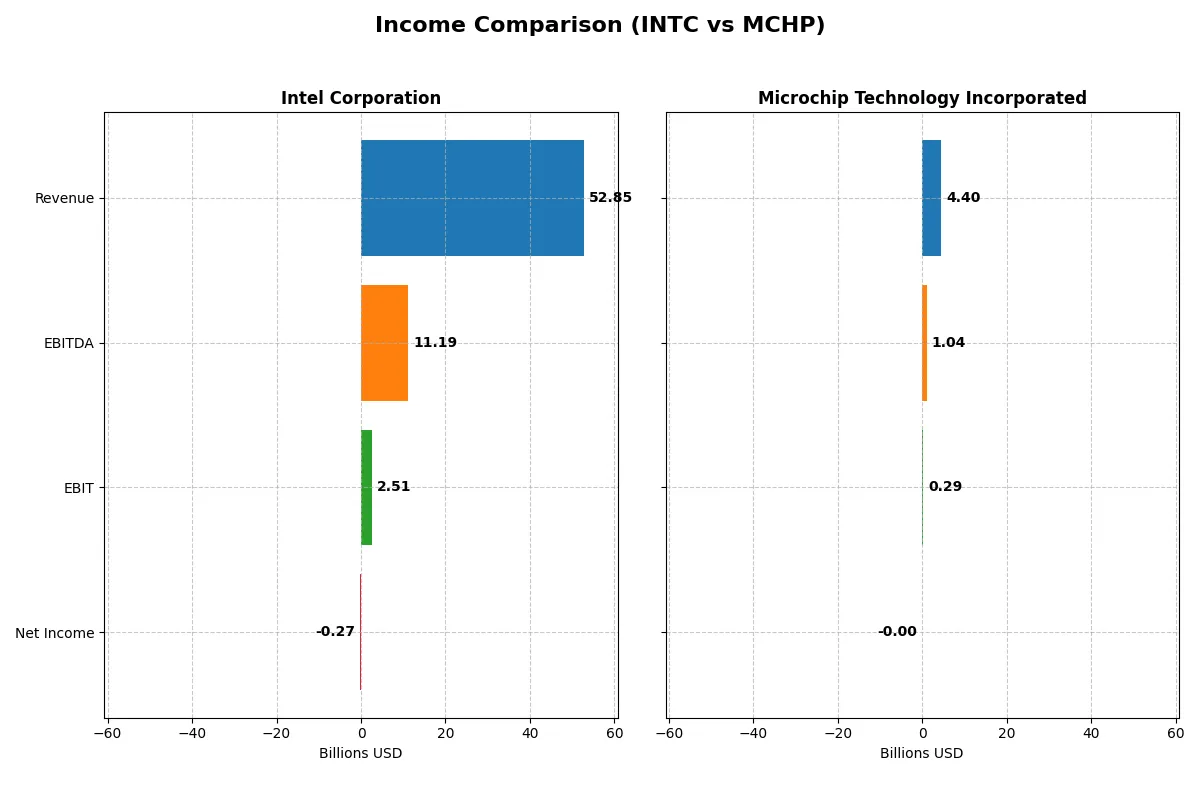
Income Statement Comparison
The following data dissects the core profitability and scalability of both corporate engines to reveal who dominates the bottom line:
| Metric | Intel Corporation (INTC) | Microchip Technology Incorporated (MCHP) |
|---|---|---|
| Revenue | 52.9B | 4.4B |
| Cost of Revenue | 34.4B | 1.9B |
| Operating Expenses | 20.6B | 2.2B |
| Gross Profit | 18.5B | 2.5B |
| EBITDA | 11.2B | 1.0B |
| EBIT | 2.9B | 290M |
| Interest Expense | 953M | 251M |
| Net Income | -267M | -500K |
| EPS | -0.08 | -0.005 |
| Fiscal Year | 2025 | 2025 |
Income Statement Analysis: The Bottom-Line Duel
This income statement comparison exposes which company drives growth and profitability with greater operational efficiency and financial discipline.
Intel Corporation Analysis
Intel’s revenue slipped slightly from 53.1B in 2024 to 52.9B in 2025, while net income rebounded dramatically from a -18.8B loss to a marginal -267M. Its gross margin improved to a healthy 35%, but a negative net margin of -0.5% signals ongoing bottom-line challenges. The company shows signs of recovering operating efficiency despite recent losses.
Microchip Technology Incorporated Analysis
Microchip’s revenue plunged 42% to 4.4B in 2025 from 7.6B the prior year, dragging net income into a slight loss of 500K from 1.9B earnings. Its gross margin remains strong at 56%, yet net margin nearly zero indicates thin profitability. The sharp decline in all growth metrics highlights a company under significant operational and market pressure.
Margin Resilience vs. Revenue Durability
Intel sustains broader revenue scale with improving margins, while Microchip boasts superior gross margin but suffers steep revenue and profit contractions. Intel’s ability to cut losses positions it better fundamentally. Investors seeking stability may favor Intel’s larger, more resilient profile amid sector headwinds.
Financial Ratios Comparison
These vital ratios act as a diagnostic tool to expose the underlying fiscal health, valuation premiums, and capital efficiency of the companies compared below:
| Ratios | Intel Corporation (INTC) | Microchip Technology Incorporated (MCHP) |
|---|---|---|
| ROE | -0.23% | -0.01% |
| ROIC | -0.02% | -0.03% |
| P/E | -658.4 | -52,021 |
| P/B | 1.54 | 3.67 |
| Current Ratio | 2.02 | 2.59 |
| Quick Ratio | 1.65 | 1.47 |
| D/E | 0.41 | 0.80 |
| Debt-to-Assets | 22.0% | 36.9% |
| Interest Coverage | -2.23 | 1.18 |
| Asset Turnover | 0.25 | 0.29 |
| Fixed Asset Turnover | 0.50 | 3.72 |
| Payout ratio | 0.0% | -1951.4% |
| Dividend yield | 0.0% | 3.75% |
| Fiscal Year | 2025 | 2025 |
Efficiency & Valuation Duel: The Vital Signs
Financial ratios serve as a company’s DNA, exposing operational strengths and hidden risks that numbers alone can’t reveal.
Intel Corporation
Intel’s profitability underperforms with negative ROE and net margin, signaling operational challenges. Its P/E ratio is negative but considered favorable due to losses, while P/S remains moderate. Intel maintains a solid current ratio of 2.02, indicating liquidity strength. It pays no dividend, reinvesting heavily in R&D (26% of revenue) to fuel future growth.
Microchip Technology Incorporated
Microchip posts near-zero negative ROE and margin, reflecting weak profitability. Its P/E ratio is extremely negative yet deemed favorable, while P/B is stretched at 3.67. The company boasts a strong current ratio of 2.59 but weaker interest coverage. It offers a 3.75% dividend yield, balancing shareholder returns with steady reinvestment in R&D (22% of revenue).
Liquidity Strength vs. Profitability Struggles
Both companies show slightly unfavorable profitability and valuation metrics, despite strong liquidity. Intel’s deeper reinvestment contrasts with Microchip’s dividend payout. Investors seeking growth via R&D might prefer Intel’s approach; income-focused investors may lean toward Microchip’s yield amid operational risks.
Which one offers the Superior Shareholder Reward?
I compare Intel Corporation (INTC) and Microchip Technology Incorporated (MCHP) on dividends, payout ratios, and buybacks to assess total shareholder returns in 2026. Intel currently pays no dividend, with a 0% yield and a negative free cash flow of -$1.0B, signaling strained capacity for distributions. Buyback activity is minimal, undermining shareholder rewards. Microchip yields 3.75% with a payout ratio near 48%, supported by positive free cash flow of $1.44B, enabling steady dividends and aggressive buybacks. Historically, MCHP’s capital allocation favors sustainable shareholder returns through buybacks and dividends, while INTC’s reinvestment strategy struggles amid negative margins and weak cash flow. I conclude Microchip offers a more attractive, sustainable total return profile for investors in 2026.
Comparative Score Analysis: The Strategic Profile
The radar chart reveals the fundamental DNA and trade-offs of Intel Corporation and Microchip Technology Incorporated, highlighting their distinct financial strengths and risks:
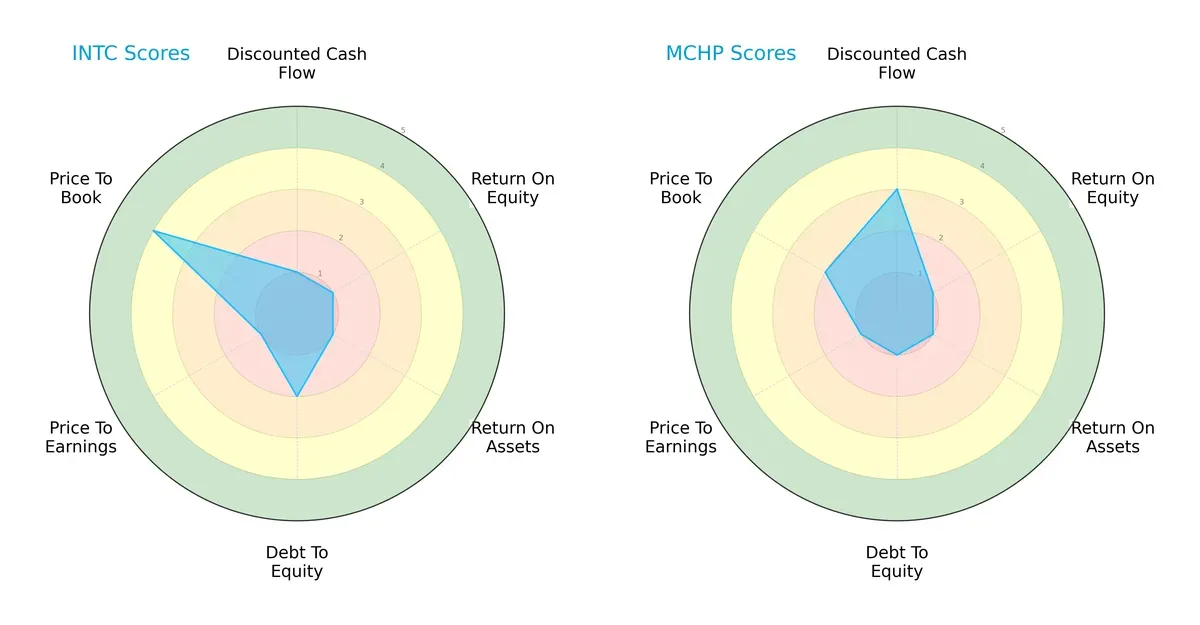
Intel shows a more balanced profile with moderate debt-to-equity and favorable price-to-book scores. Microchip relies heavily on discounted cash flow strength but struggles with leverage and valuation metrics. Intel’s diversified edge contrasts with Microchip’s specific valuation appeal.
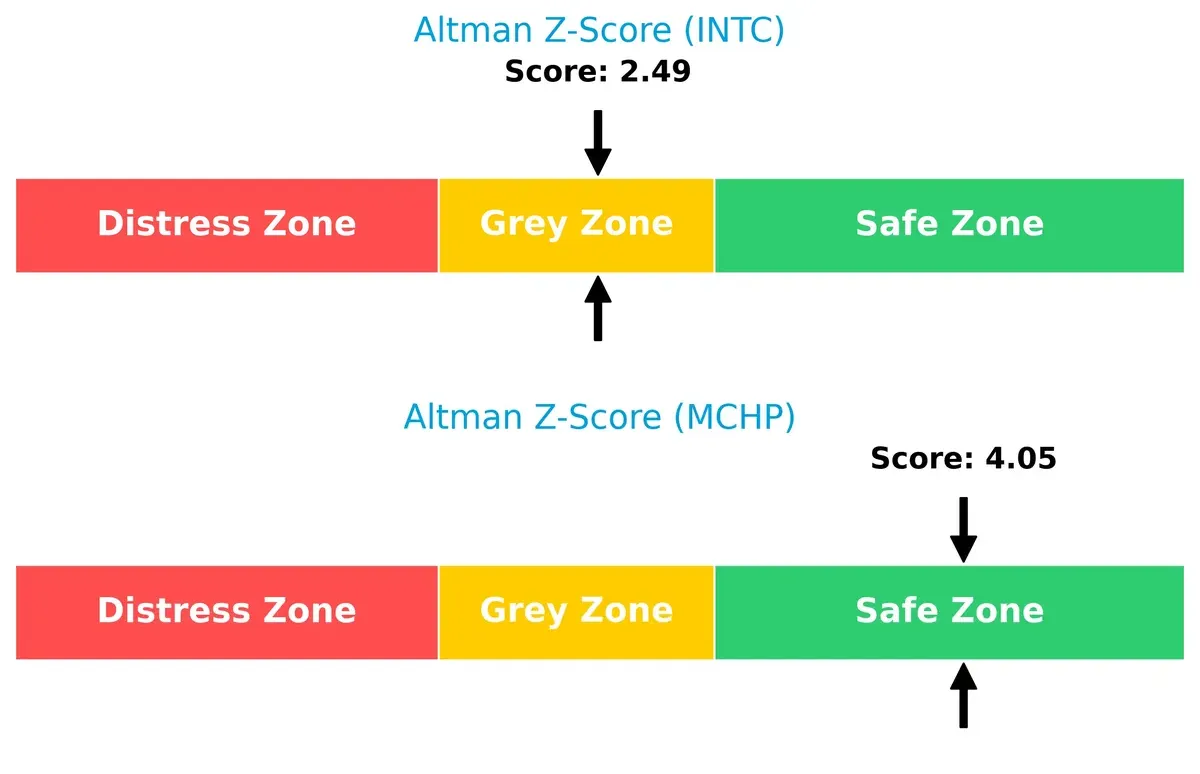
Bankruptcy Risk: Solvency Showdown
Intel’s Altman Z-Score places it in the grey zone, signaling moderate bankruptcy risk, while Microchip’s score in the safe zone implies stronger long-term solvency in the current cycle:
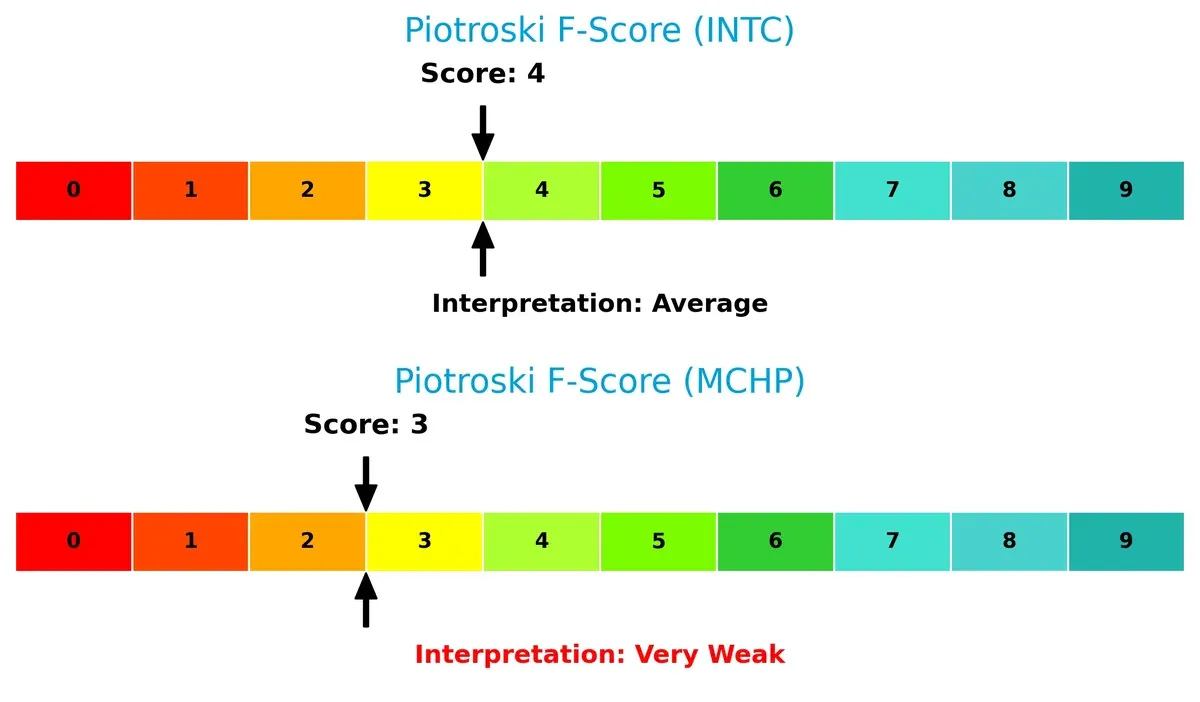
Financial Health: Quality of Operations
Intel’s Piotroski F-Score of 4 indicates average financial health, outperforming Microchip’s weaker score of 3, which raises internal red flags on operational quality:
How are the two companies positioned?
This section dissects the operational DNA of Intel and Microchip by comparing revenue distribution and internal strengths and weaknesses. The goal is to confront their economic moats to reveal which model delivers the most resilient, sustainable competitive advantage today.
Revenue Segmentation: The Strategic Mix
This visual comparison dissects how Intel Corporation and Microchip Technology diversify their income streams and where their primary sector bets lie:
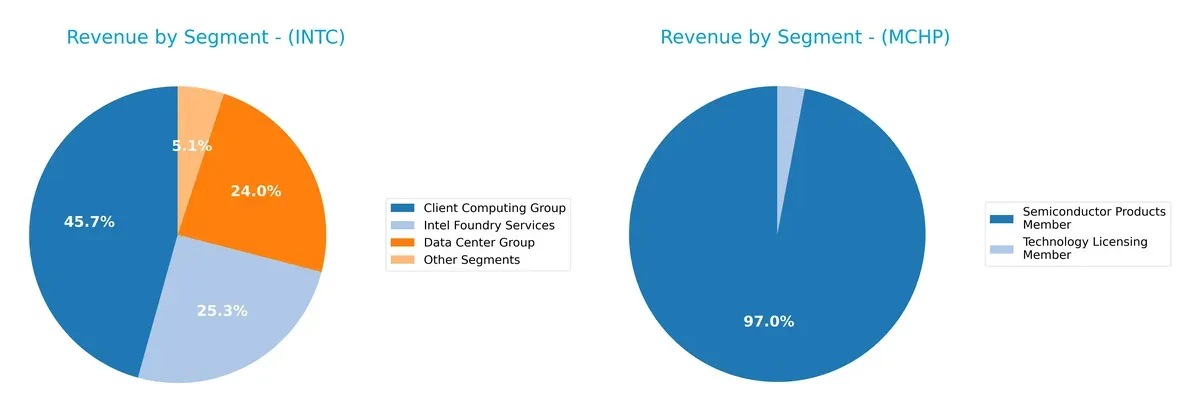
Intel’s 2025 revenue dwarfs Microchip’s, anchored by three major segments: Client Computing Group ($32.2B), Intel Foundry Services ($17.8B), and Data Center Group ($16.9B). This mix shows a strategic pivot towards infrastructure and foundry services, balancing ecosystem lock-in with diversified tech bets. Microchip relies heavily on a single Semiconductor Products segment ($4.27B), exposing it to concentration risk despite steady licensing income. Intel’s broader base signals a stronger moat in 2026.
Strengths and Weaknesses Comparison
This table compares the strengths and weaknesses of Intel Corporation and Microchip Technology Incorporated:
Intel Corporation Strengths
- Diverse revenue streams including Client Computing, Data Center, Foundry, and IoT segments
- Strong global presence with significant sales in the US, Singapore, Taiwan, and China
- Favorable liquidity ratios with current ratio 2.02 and quick ratio 1.65
- Low debt-to-assets ratio at 22.03% indicating conservative leverage
Microchip Technology Strengths
- Favorable fixed asset turnover at 3.72 indicating efficient asset use
- Positive dividend yield of 3.75% enhancing shareholder returns
- Strong current ratio of 2.59 indicates solid short-term financial health
- Favorable PE ratio suggesting market optimism
Intel Corporation Weaknesses
- Negative profitability metrics with net margin -0.51% and ROE -0.23%
- Unfavorable asset turnover ratios reflecting operational inefficiency
- No dividend yield limiting income for investors
- Slightly unfavorable global ratio opinion signaling financial challenges
Microchip Technology Weaknesses
- Negative profitability with net margin -0.01% and ROE -0.01%
- Higher debt-to-assets at 36.85% and weak interest coverage at 1.15
- Unfavorable price-to-book ratio at 3.67 indicating potential overvaluation
- Slightly unfavorable global ratio opinion reflecting financial strain
Intel shows strength in diversification and global reach but faces profitability and efficiency challenges. Microchip leverages asset efficiency and dividends but contends with higher leverage and weak profitability. Both companies exhibit slightly unfavorable financial ratios, suggesting strategic focus on improving returns and operational efficiency.
The Moat Duel: Analyzing Competitive Defensibility
A structural moat is the only reliable shield protecting long-term profits from relentless competitive erosion. Here is the battleground for Intel and Microchip:
Intel Corporation: Scale and Innovation Moat
Intel’s primary advantage lies in its scale and R&D-driven innovation. Historically, this delivers margin stability despite cyclical revenue dips. In 2026, new AI-focused platforms could deepen its moat but execution risks persist.
Microchip Technology Incorporated: Niche Specialization Moat
Microchip’s moat centers on embedded control solutions and specialized microcontrollers. Unlike Intel’s broad approach, Microchip commands higher gross margins but faces pressure from narrower market scope and recent profitability declines. Expansion into automotive and IoT remains a key opportunity.
Scale Dominance vs. Specialized Control: Who Defends Better?
Both firms show declining ROICs below WACC, signaling value destruction and shrinking moats. Intel’s broader innovation pipeline offers a wider moat, while Microchip’s niche focus yields deeper margins but greater vulnerability. Intel is better positioned to defend market share if it stabilizes execution and leverages AI growth.
Which stock offers better returns?
Over the past year, Intel Corporation’s stock rose steadily with accelerating gains, while Microchip Technology Incorporated experienced a prolonged decline before recent strong recovery.
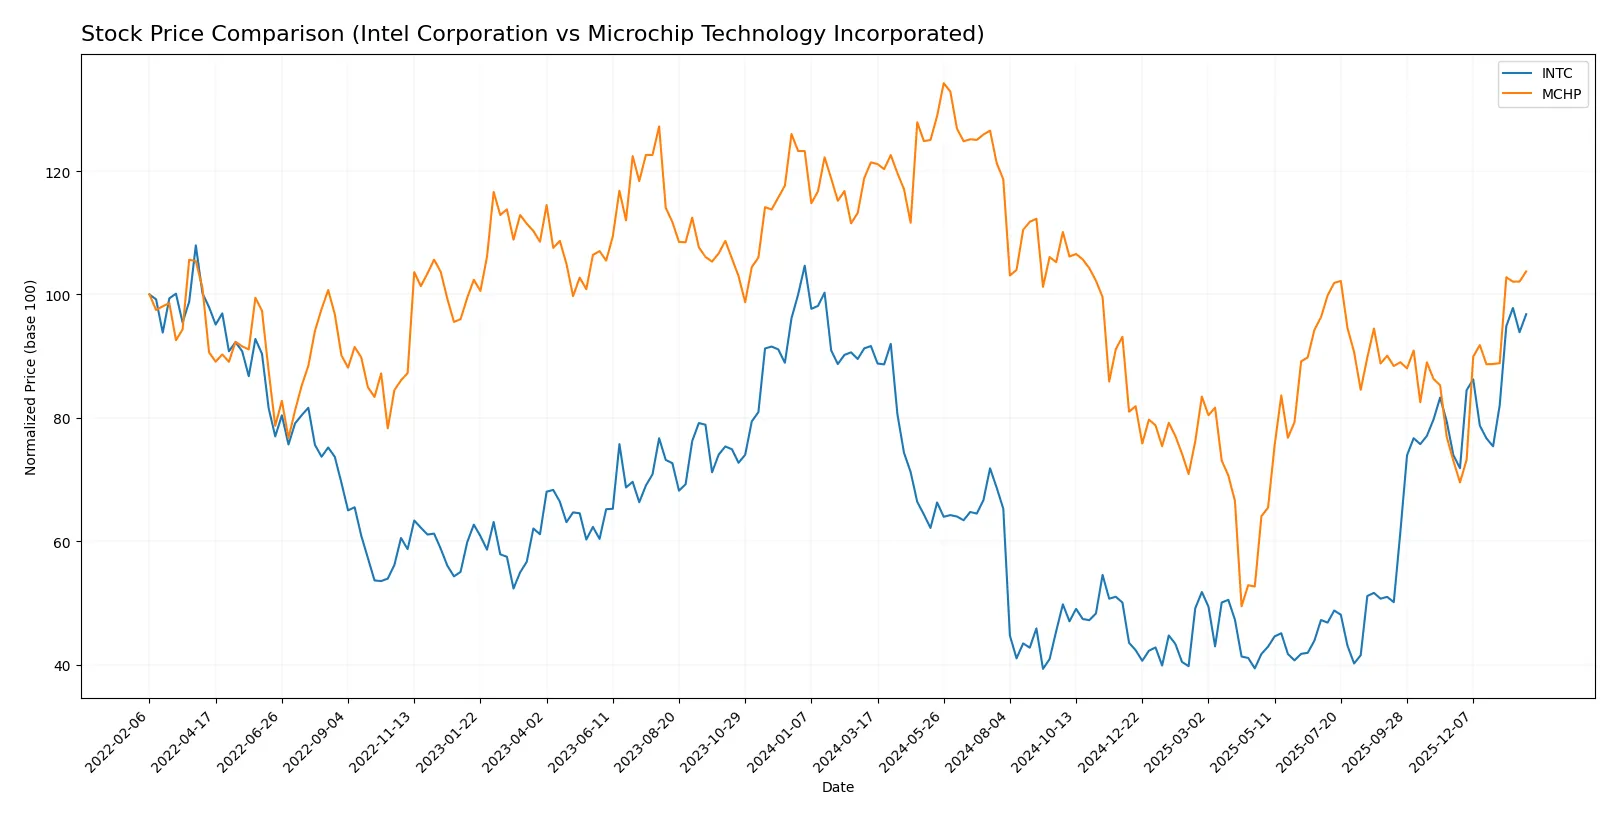
Trend Comparison
Intel’s stock shows a bullish trend with a 5.61% increase over 12 months, marked by accelerating momentum and a high of 46.96. Volatility remains moderate with an 8.11% standard deviation.
Microchip’s stock declined 14.54% over the year, reflecting a bearish trend despite acceleration. It reached a 12-month low of 36.22, with higher volatility at 14.24% standard deviation.
Comparing trends, Intel delivered the highest market performance over 12 months, outperforming Microchip’s significant overall loss despite both showing recent positive momentum.
Target Prices
Analysts present a broad but constructive target consensus for Intel Corporation and Microchip Technology.
| Company | Target Low | Target High | Consensus |
|---|---|---|---|
| Intel Corporation | 20 | 66 | 46.95 |
| Microchip Technology Incorporated | 60 | 95 | 81 |
Intel’s consensus target of 46.95 closely aligns with its current price of 46.47, signaling limited near-term upside. Microchip’s consensus of 81 exceeds its 75.92 price, suggesting moderate analyst optimism.

Don’t Let Luck Decide Your Entry Point
Optimize your entry points with our advanced ProRealTime indicators. You’ll get efficient buy signals with precise price targets for maximum performance. Start outperforming now!
How do institutions grade them?
This section compares recent grades assigned to Intel Corporation and Microchip Technology Incorporated by reputable grading firms:
Intel Corporation Grades
Below are Intel’s most recent ratings from well-known financial institutions.
| Grading Company | Action | New Grade | Date |
|---|---|---|---|
| RBC Capital | Maintain | Sector Perform | 2026-01-23 |
| Keybanc | Maintain | Overweight | 2026-01-23 |
| Evercore ISI Group | Maintain | In Line | 2026-01-23 |
| Needham | Maintain | Hold | 2026-01-23 |
| Benchmark | Maintain | Buy | 2026-01-23 |
| Rosenblatt | Maintain | Sell | 2026-01-23 |
| UBS | Maintain | Neutral | 2026-01-23 |
| Citigroup | Maintain | Neutral | 2026-01-23 |
| Stifel | Maintain | Hold | 2026-01-23 |
| Wedbush | Maintain | Neutral | 2026-01-23 |
Microchip Technology Incorporated Grades
The following table lists Microchip’s current grades from recognized financial analysts.
| Grading Company | Action | New Grade | Date |
|---|---|---|---|
| UBS | Maintain | Buy | 2026-01-26 |
| Susquehanna | Maintain | Positive | 2026-01-22 |
| B of A Securities | Maintain | Neutral | 2026-01-21 |
| Citigroup | Maintain | Buy | 2026-01-15 |
| Piper Sandler | Maintain | Overweight | 2026-01-15 |
| B. Riley Securities | Maintain | Buy | 2026-01-12 |
| Mizuho | Maintain | Outperform | 2026-01-09 |
| Wells Fargo | Maintain | Equal Weight | 2026-01-07 |
| JP Morgan | Maintain | Overweight | 2026-01-06 |
| Rosenblatt | Maintain | Buy | 2026-01-06 |
Which company has the best grades?
Microchip holds consistently higher ratings, including multiple Buy, Overweight, and Outperform grades. Intel’s grades are mixed, ranging from Buy to Sell. This suggests Microchip may enjoy stronger analyst confidence, potentially influencing investor sentiment positively.
Risks specific to each company
The following categories identify the critical pressure points and systemic threats facing both firms in the 2026 market environment:
1. Market & Competition
Intel Corporation
- Faces intense competition from AMD, Nvidia, and TSMC, pressuring margins.
Microchip Technology Incorporated
- Competes in niche microcontroller markets but faces threats from larger semiconductor firms.
2. Capital Structure & Debt
Intel Corporation
- Moderate debt-to-equity ratio at 0.41; interest coverage is adequate but not robust (2.63x).
Microchip Technology Incorporated
- Higher leverage with debt-to-equity near 0.8; weak interest coverage at 1.15x raises financial risk.
3. Stock Volatility
Intel Corporation
- Beta at 1.35 indicates above-market volatility; share price range $17.67-$54.6.
Microchip Technology Incorporated
- Higher beta of 1.45 suggests more sensitivity to market swings; price range $34.13-$81.43.
4. Regulatory & Legal
Intel Corporation
- Subject to antitrust scrutiny and export controls linked to US-China tensions.
Microchip Technology Incorporated
- Faces regulatory challenges in automotive and industrial sectors; less exposed to geopolitical export controls.
5. Supply Chain & Operations
Intel Corporation
- Complex global supply chain vulnerable to geopolitical disruption and chip shortages.
Microchip Technology Incorporated
- Smaller scale supply chain but still exposed to raw material and foundry capacity constraints.
6. ESG & Climate Transition
Intel Corporation
- Increasing pressure to reduce carbon footprint; investing in green manufacturing.
Microchip Technology Incorporated
- ESG initiatives less prominent; climate transition risk moderate due to smaller footprint.
7. Geopolitical Exposure
Intel Corporation
- High exposure to US-China trade tensions impacting manufacturing and sales.
Microchip Technology Incorporated
- Less global manufacturing reliance, but still vulnerable to supply chain disruptions from geopolitical events.
Which company shows a better risk-adjusted profile?
Intel’s most impactful risk is fierce market competition eroding profitability, as reflected by its negative margins and average Altman Z-Score in the grey zone. Microchip’s highest risk lies in its elevated leverage and weak interest coverage, despite a safe-zone Altman Z-Score. Overall, Intel presents a slightly better risk-adjusted profile supported by stronger liquidity and moderate debt. Microchip’s higher financial risk signals caution despite niche market focus.
Final Verdict: Which stock to choose?
Intel Corporation’s superpower lies in its robust liquidity and operational scale, enabling resilience amid sector headwinds. Its value destruction reflected in declining profitability is a point of vigilance. Intel fits portfolios seeking cyclical rebound potential and established industry presence.
Microchip Technology’s moat centers on specialized embedded control solutions and consistent free cash flow generation, providing a safety cushion. Relative to Intel, it offers better stability in financial distress metrics but trades at a premium. Microchip suits investors favoring niche market leadership and moderate growth.
If you prioritize strategic scale and turnaround potential, Intel is the compelling choice due to its entrenched market position and improving operational metrics. However, if you seek financial stability with a focused business model, Microchip offers better risk containment despite its valuation premium. Both remain analytical scenarios requiring close monitoring of profitability trends.
Disclaimer: Investment carries a risk of loss of initial capital. The past performance is not a reliable indicator of future results. Be sure to understand risks before making an investment decision.
Go Further
I encourage you to read the complete analyses of Intel Corporation and Microchip Technology Incorporated to enhance your investment decisions: