Home > Comparison > Technology > INTC vs MXL
The strategic rivalry between Intel Corporation and MaxLinear, Inc. shapes the trajectory of the semiconductor industry. Intel, a capital-intensive semiconductor powerhouse, contrasts with MaxLinear’s agile focus on high-performance analog and mixed-signal SoCs. This head-to-head highlights a battle between scale-driven platform dominance and specialized innovation. This analysis aims to determine which company’s business model offers superior risk-adjusted returns for a diversified technology portfolio.
Table of contents
Companies Overview
Intel Corporation and MaxLinear, Inc. stand as pivotal players in the semiconductor market, each with distinct scale and focus.
Intel Corporation: Semiconductor Giant with Diverse Platforms
Intel dominates as a leading semiconductor designer and manufacturer. Its revenue stems from platform products like CPUs and chipsets, alongside adjacent offerings such as accelerators and connectivity solutions. In 2026, Intel sharpens its strategic focus on high-performance compute for cloud, enterprise, and autonomous driving sectors, leveraging AI partnerships to enhance innovation.
MaxLinear, Inc.: Specialist in Integrated Communications SoCs
MaxLinear operates as a high-performance analog and mixed-signal SoC provider. It generates revenue by delivering integrated RF and digital communication solutions for broadband, home networking, and infrastructure markets. The company’s 2026 strategy centers on expanding end-to-end platform solutions for 4G/5G infrastructure and data center connectivity, emphasizing highly integrated system design.
Strategic Collision: Similarities & Divergences
Intel pursues a broad platform ecosystem with vertical integration, whereas MaxLinear focuses on specialized, modular SoCs for communications infrastructure. Their primary battleground lies in high-speed data transmission and networking hardware. Intel’s massive scale contrasts with MaxLinear’s niche agility, presenting distinct investment profiles shaped by size, diversification, and market reach.
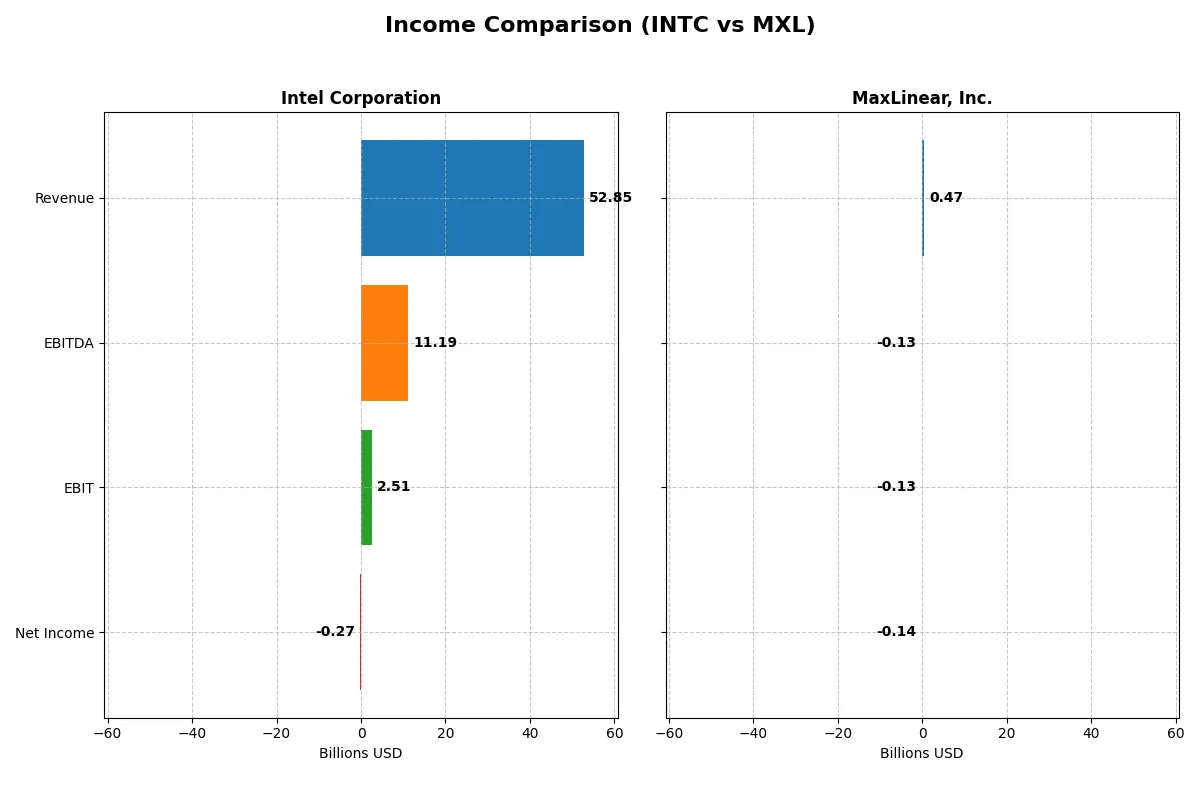
Income Statement Comparison
This table dissects the core profitability and scalability of both corporate engines to reveal who dominates the bottom line:
| Metric | Intel Corporation (INTC) | MaxLinear, Inc. (MXL) |
|---|---|---|
| Revenue | 52.9B | 468M |
| Cost of Revenue | 34.4B | 202M |
| Operating Expenses | 20.6B | 393M |
| Gross Profit | 18.5B | 266M |
| EBITDA | 11.2B | -131M |
| EBIT | 2.5B | -131M |
| Interest Expense | 953M | 10M |
| Net Income | -267M | -137M |
| EPS | -0.08 | -1.58 |
| Fiscal Year | 2025 | 2025 |
Income Statement Analysis: The Bottom-Line Duel
The following income statement comparison reveals each company’s operational efficiency and profitability momentum across recent fiscal years.
Intel Corporation Analysis
Intel’s revenue declined modestly from 79B in 2021 to 53B in 2025, signaling top-line pressure. Gross margin remains solid near 35%, reflecting cost control despite falling sales. However, net income swung from a strong 19.9B profit in 2021 to a slight 267M loss in 2025, exposing challenges in bottom-line sustainability. The 2025 EBIT margin at 4.75% shows tentative operational recovery after steep prior losses.
MaxLinear, Inc. Analysis
MaxLinear’s revenue dropped sharply from 892M in 2021 to 468M in 2025 but rebounded 30% year-over-year in 2025, signaling regained traction. The company sustains a robust 57% gross margin, indicating strong product profitability. Yet, negative EBIT and net margins near -28% and -29% respectively in 2025 highlight persistent operating inefficiencies and losses. Still, the company improved EBIT and net margins significantly over the past year.
Margin Resilience vs. Scale and Recovery
Intel dominates in scale and maintains a stable gross margin but struggles with net losses and shrinking revenue over five years. MaxLinear shows impressive margin resilience and sharp recent growth but remains deeply unprofitable. Intel’s size and partial margin recovery offer stability; MaxLinear’s high-margin profile with improving momentum suits risk-tolerant investors seeking turnaround potential.
Financial Ratios Comparison
These vital ratios act as a diagnostic tool to expose the underlying fiscal health, valuation premiums, and capital efficiency of the companies compared below:
| Ratios | Intel Corporation (INTC) | MaxLinear, Inc. (MXL) |
|---|---|---|
| ROE | -0.23% | -47.49% |
| ROIC | -0.02% | -24.31% |
| P/E | -658.38 | -6.74 |
| P/B | 1.54 | 3.20 |
| Current Ratio | 2.02 | 1.77 |
| Quick Ratio | 1.65 | 1.28 |
| D/E | 0.41 | 0.29 |
| Debt-to-Assets | 22.03% | 17.23% |
| Interest Coverage | -2.23 | -15.52 |
| Asset Turnover | 0.25 | 0.42 |
| Fixed Asset Turnover | 0.50 | 4.65 |
| Payout ratio | 0 | 0 |
| Dividend yield | 0 | 0 |
| Fiscal Year | 2025 | 2024 |
Efficiency & Valuation Duel: The Vital Signs
Financial ratios serve as the company’s DNA, uncovering hidden risks and revealing operational excellence critical for investment decisions.
Intel Corporation
Intel’s profitability metrics show weakness, with negative ROE and net margin signaling operational challenges. The stock trades at a favorable P/E despite struggles. Intel maintains a strong current ratio and moderate leverage. It offers no dividends, instead reinvesting heavily in R&D, which accounts for over 26% of revenue, aiming to fuel future growth.
MaxLinear, Inc.
MaxLinear exhibits deep profitability issues with severely negative ROE and net margin. Its P/E ratio is favorable but paired with a stretched price-to-book multiple. The company keeps a solid current ratio and low debt levels but suffers poor interest coverage. Like Intel, MaxLinear pays no dividend, channeling resources into high R&D spending of over 62% of revenue.
Operational Stability vs. Growth Ambitions
Intel balances slightly unfavorable profitability with strong liquidity and disciplined leverage, reflecting operational caution. MaxLinear shows worse profitability and coverage but commits aggressively to innovation. Intel suits investors prioritizing stability and reinvestment discipline; MaxLinear fits those favoring high-risk growth profiles.
Which one offers the Superior Shareholder Reward?
Intel Corporation (INTC) pays a modest dividend yield of 1.8% in 2025 but shows negative free cash flow (-$1.02/share), raising sustainability concerns. Its buybacks have slowed amid profitability pressures. MaxLinear, Inc. (MXL) pays no dividends, reinvesting heavily with negative net margins and free cash flow losses. MXL’s aggressive growth stance contrasts with INTC’s cautious distribution. I find Intel’s yield and share repurchase potential more tangible for shareholder reward in 2026 despite its margin challenges. Thus, INTC offers a superior total return profile, balancing income and capital return more sustainably than MXL’s high-risk growth model.
Comparative Score Analysis: The Strategic Profile
The radar chart reveals the fundamental DNA and trade-offs of Intel Corporation and MaxLinear, Inc.:
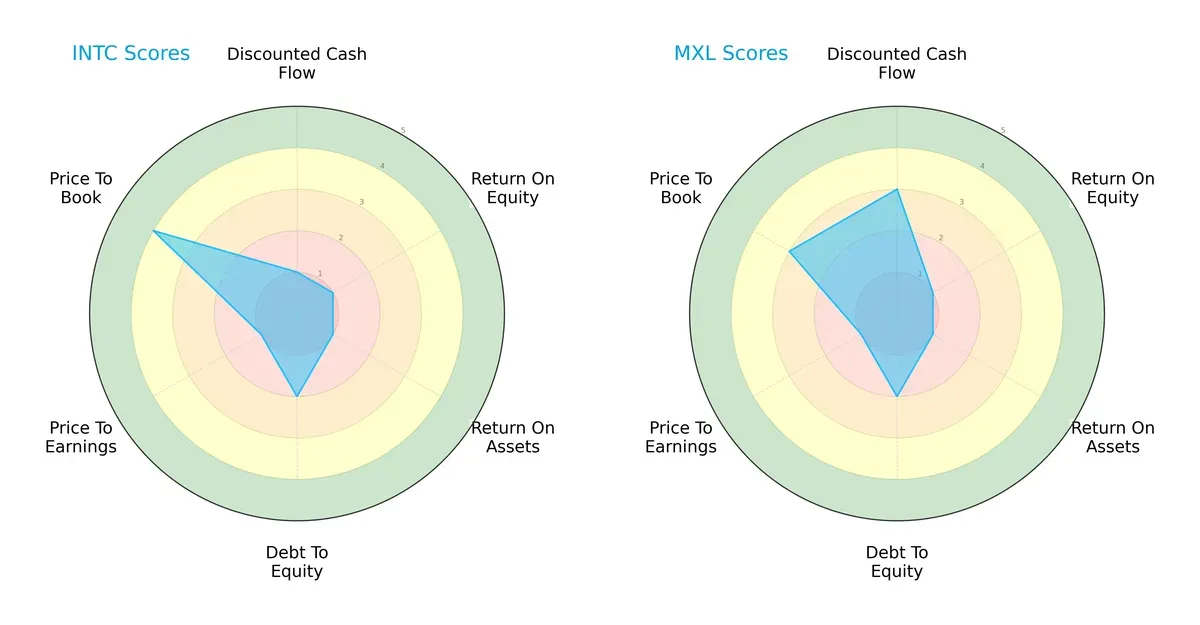
Intel and MaxLinear share moderate overall scores but diverge in key areas. MaxLinear leads on discounted cash flow (3 vs. 1), signaling better future cash flow prospects. Both show weak return on equity and assets (1 each), indicating operational challenges. Debt-to-equity scores are moderate and identical (2), suggesting similar financial risk. Intel’s price-to-book score (4) outshines MaxLinear’s (3), reflecting relative valuation strength. Intel’s profile is less balanced, relying more on valuation appeal, while MaxLinear leverages a stronger DCF outlook.
Bankruptcy Risk: Solvency Showdown
Intel’s Altman Z-Score of 2.49 slightly surpasses MaxLinear’s 2.13, placing both firms in the grey zone:
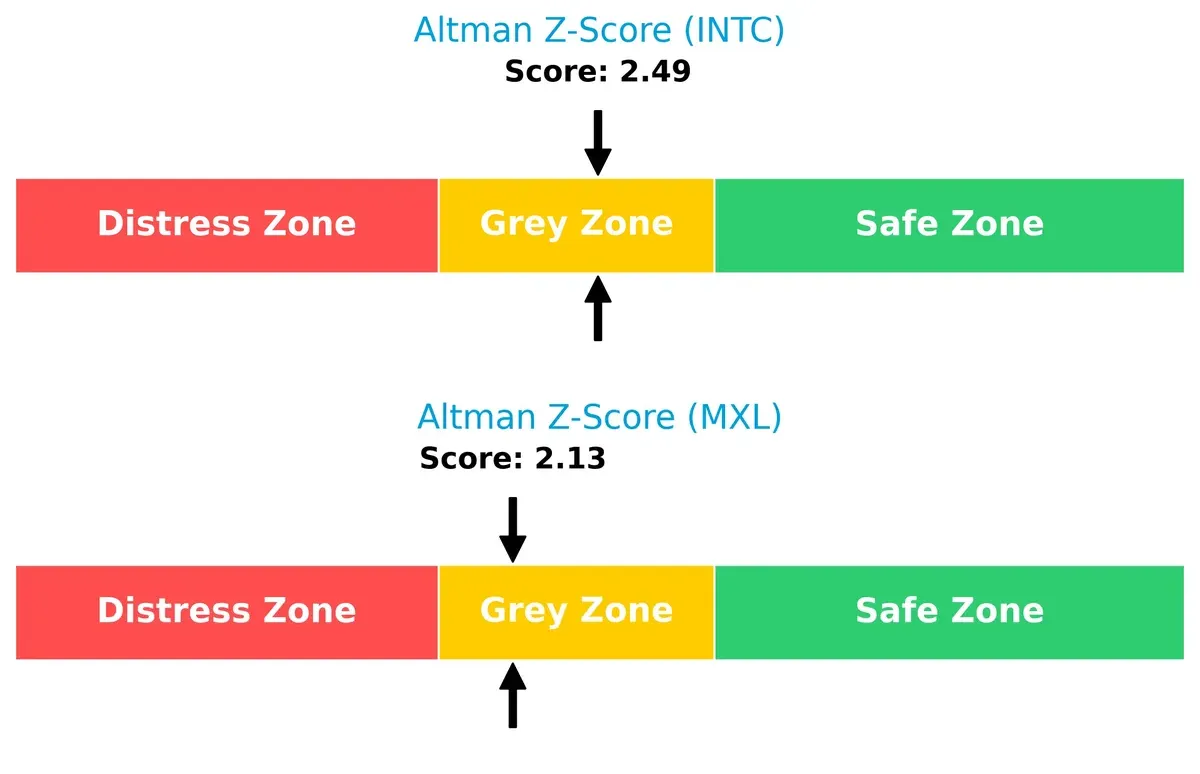
Both companies face moderate bankruptcy risk amid current market pressures. Intel’s marginally higher score implies a somewhat stronger solvency position, but neither is clearly safe. Investors should monitor leverage and liquidity closely to avoid distress.
Financial Health: Quality of Operations
Intel scores a 4 on the Piotroski F-Score, edging out MaxLinear’s weaker 3:
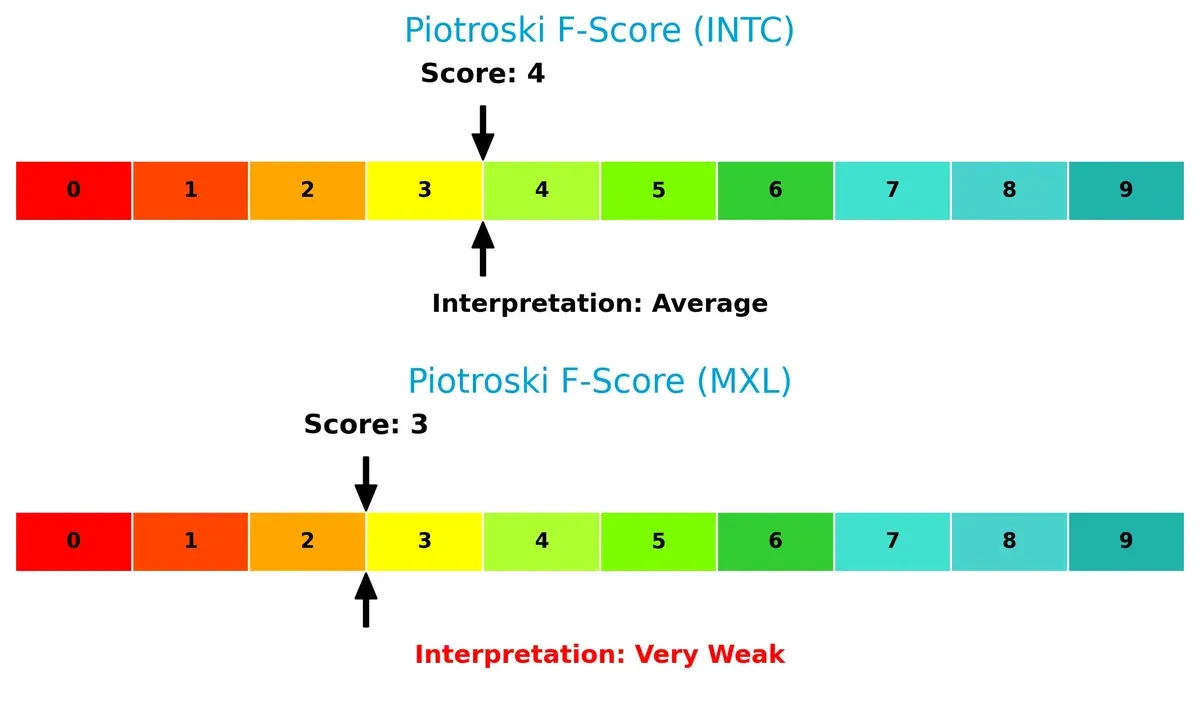
Intel’s average financial health contrasts with MaxLinear’s very weak internal metrics. This gap suggests Intel manages profitability and efficiency better, while MaxLinear may harbor hidden operational red flags. I advise caution with MaxLinear until improvements materialize.
How are the two companies positioned?
This section dissects Intel and MaxLinear’s operational DNA by comparing their revenue distribution and internal dynamics. The goal is to confront their economic moats and reveal which model offers the most resilient competitive advantage today.
Revenue Segmentation: The Strategic Mix
This visual comparison dissects how Intel Corporation and MaxLinear, Inc. diversify their income streams and highlights their primary sector bets:
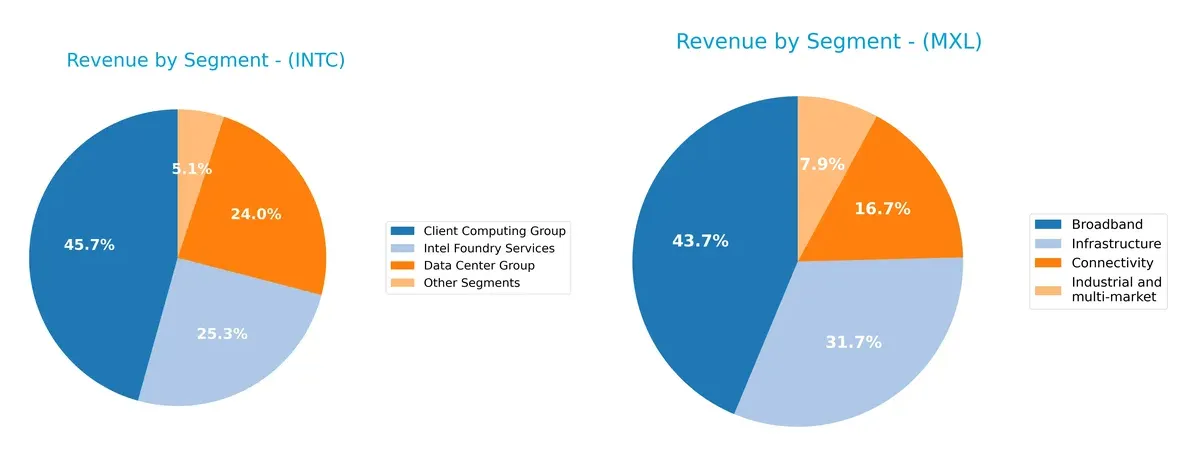
Intel anchors its revenue in the Client Computing Group with $32.2B, supported by Data Center ($16.9B) and Foundry Services ($17.8B). This mix shows a strong ecosystem lock-in but some concentration risk in client computing. MaxLinear leans heavily on Broadband ($204M) and Infrastructure ($148M), yet balances with Connectivity ($78M) and Industrial ($37M), reflecting a more diversified approach for a smaller scale. Intel’s scale dwarfs MaxLinear’s, emphasizing infrastructure dominance versus MaxLinear’s balanced niche play.
Strengths and Weaknesses Comparison
This table compares the strengths and weaknesses of Intel Corporation and MaxLinear, Inc. based on diversification, profitability, financial statements, innovation, global presence, and market share:
Intel Corporation Strengths
- Diversified revenue streams from computing, data centers, foundry services, and IoT
- Solid liquidity ratios with current ratio 2.02 and quick ratio 1.65
- Moderate leverage with debt-to-assets at 22%
- Broad global presence including US, Singapore, Taiwan, and China
MaxLinear, Inc. Strengths
- Favorable fixed asset turnover of 4.65 indicates efficient asset use
- Good liquidity with current ratio 1.77 and quick ratio 1.28
- Low debt-to-assets at 17% implies conservative capital structure
- Revenue diversification across broadband, connectivity, industrial, and infrastructure
Intel Corporation Weaknesses
- Negative profitability metrics: net margin -0.51%, ROE -0.23%, ROIC -0.02%
- Low asset turnover ratios suggest underutilized assets
- No dividend yield raises questions on shareholder returns
MaxLinear, Inc. Weaknesses
- Deeply negative profitability with net margin -68%, ROE -47%, ROIC -24%
- Unfavorable WACC of 11.7% increases capital costs
- Negative interest coverage signals financial stress
- Higher price-to-book ratio at 3.2 may imply overvaluation concerns
Intel’s strengths lie in its diversified business model and strong liquidity supporting global operations. However, its profitability challenges and asset inefficiencies remain critical concerns. MaxLinear shows efficient asset use and a conservative debt profile but struggles with severe profitability deficits and financial risk. These contrasting profiles highlight differing strategic and financial health priorities.
The Moat Duel: Analyzing Competitive Defensibility
A structural moat alone shields long-term profits from relentless competitive erosion. Its depth defines survival and growth prospects:
Intel Corporation: Scale and Integration Moat
Intel relies on its vast manufacturing scale and integrated product ecosystem. This manifests in stable gross margins (~35%) despite margin pressures. Emerging AI and automotive chips could deepen its moat if execution improves by 2026.
MaxLinear, Inc.: Niche Innovation Moat
MaxLinear’s moat stems from specialized RF and mixed-signal SoCs for communications infrastructure. Unlike Intel’s broadscale dominance, MaxLinear leverages focused innovation but struggles with profitability and negative EBIT margins. Expansion into 5G and data centers offers growth paths.
Scale Dominance vs. Niche Specialization
Intel’s wider moat benefits from scale and integration, yet declining ROIC signals value erosion. MaxLinear’s niche tech shows promise but faces profitability challenges. Intel remains better positioned to defend market share amid intensifying competition.
Which stock offers better returns?
The stock price dynamics over the past year reveal Intel’s steady 5.61% rise with accelerating momentum, while MaxLinear’s price declined sharply by 17.26%, despite recent gains. Trading volumes show growing buyer interest for both.
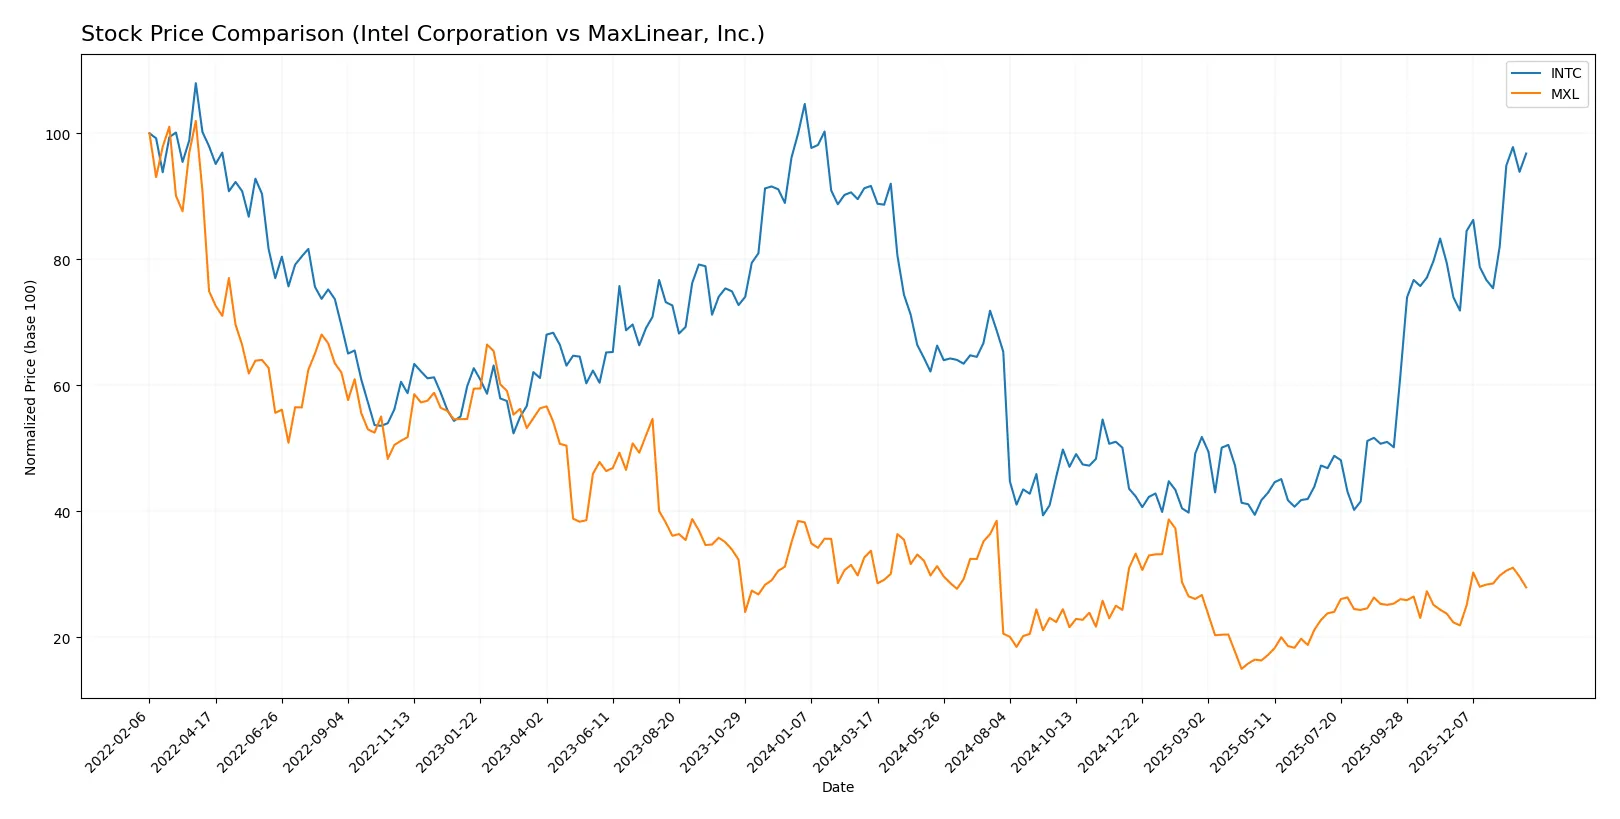
Trend Comparison
Intel Corporation’s stock shows a bullish trend over the past 12 months, gaining 5.61%. The price accelerated upward, reaching a high of 46.96, supported by notable volatility (8.11 std deviation).
MaxLinear, Inc. experienced a bearish trend over the same period with a 17.26% decline. The price trend accelerated downward, hitting a low of 9.31, with lower volatility (3.37 std deviation).
Intel’s positive 5.61% return outperforms MaxLinear’s 17.26% loss over the past year, delivering the stronger market performance in this comparison.
Target Prices
Analysts present a wide but clear consensus on fair value for Intel Corporation and MaxLinear, Inc.
| Company | Target Low | Target High | Consensus |
|---|---|---|---|
| Intel Corporation | 20 | 66 | 46.95 |
| MaxLinear, Inc. | 15 | 25 | 21 |
Intel’s consensus target of $46.95 closely aligns with its current price of $46.47, indicating limited upside. MaxLinear’s consensus target of $21 suggests roughly 21% upside from its current $17.35 price.

Don’t Let Luck Decide Your Entry Point
Optimize your entry points with our advanced ProRealTime indicators. You’ll get efficient buy signals with precise price targets for maximum performance. Start outperforming now!
How do institutions grade them?
Intel Corporation Grades
The table below summarizes recent analyst grades for Intel Corporation:
| Grading Company | Action | New Grade | Date |
|---|---|---|---|
| RBC Capital | maintain | Sector Perform | 2026-01-23 |
| Keybanc | maintain | Overweight | 2026-01-23 |
| Evercore ISI Group | maintain | In Line | 2026-01-23 |
| Needham | maintain | Hold | 2026-01-23 |
| Benchmark | maintain | Buy | 2026-01-23 |
| Rosenblatt | maintain | Sell | 2026-01-23 |
| UBS | maintain | Neutral | 2026-01-23 |
| Citigroup | maintain | Neutral | 2026-01-23 |
| Stifel | maintain | Hold | 2026-01-23 |
| Wedbush | maintain | Neutral | 2026-01-23 |
MaxLinear, Inc. Grades
The following table lists recent analyst grades for MaxLinear, Inc.:
| Grading Company | Action | New Grade | Date |
|---|---|---|---|
| Wells Fargo | maintain | Equal Weight | 2026-01-30 |
| Benchmark | maintain | Buy | 2026-01-16 |
| Benchmark | maintain | Buy | 2025-10-24 |
| Benchmark | maintain | Buy | 2025-10-17 |
| Benchmark | maintain | Buy | 2025-09-02 |
| Loop Capital | maintain | Hold | 2025-08-04 |
| Wells Fargo | maintain | Equal Weight | 2025-07-24 |
| Benchmark | maintain | Buy | 2025-07-24 |
| Susquehanna | maintain | Neutral | 2025-07-24 |
| Susquehanna | maintain | Neutral | 2025-07-22 |
Which company has the best grades?
MaxLinear consistently receives “Buy” ratings from Benchmark, signaling stronger analyst conviction. Intel’s ratings vary widely from “Buy” to “Sell,” indicating mixed sentiment. This divergence may affect investor confidence and perceived risk.
Risks specific to each company
The following categories identify critical pressure points and systemic threats facing both firms in the 2026 market environment:
1. Market & Competition
Intel Corporation
- Faces intense competition from industry giants with slower innovation cycles impacting market share.
MaxLinear, Inc.
- Operates in niche RF and mixed-signal SoCs but competes with larger players, risking margin pressure.
2. Capital Structure & Debt
Intel Corporation
- Maintains moderate debt with a debt-to-equity ratio of 0.41 and stable interest coverage of 2.63.
MaxLinear, Inc.
- Lower debt ratio at 0.29 but negative interest coverage (-13.01) signals financial strain on debt servicing.
3. Stock Volatility
Intel Corporation
- Beta of 1.35 indicates moderate volatility compared to the tech sector benchmark.
MaxLinear, Inc.
- Higher beta at 1.77 reflects greater stock price swings and risk in volatile market conditions.
4. Regulatory & Legal
Intel Corporation
- Subject to heightened antitrust scrutiny and export restrictions on advanced chips.
MaxLinear, Inc.
- Faces regulatory risks in communications compliance but less exposure to broad antitrust issues.
5. Supply Chain & Operations
Intel Corporation
- Complex global supply chain vulnerable to geopolitical disruptions and component shortages.
MaxLinear, Inc.
- Smaller scale supply chain more agile but dependent on key suppliers, increasing operational risk.
6. ESG & Climate Transition
Intel Corporation
- Significant pressure to reduce emissions and improve sustainability in manufacturing processes.
MaxLinear, Inc.
- Emerging ESG initiatives but limited resources may slow climate transition efforts.
7. Geopolitical Exposure
Intel Corporation
- High exposure to US-China tensions affecting production and sales strategies.
MaxLinear, Inc.
- Moderate exposure with less direct reliance on China but vulnerable to global trade disruptions.
Which company shows a better risk-adjusted profile?
Intel’s most impactful risk is operational complexity amid geopolitical tensions, while MaxLinear struggles with financial distress marked by negative interest coverage. Intel’s moderate leverage and stable liquidity provide a better risk-adjusted profile despite market challenges. MaxLinear’s higher stock volatility and weaker financial health raise caution. Recent data show Intel’s stronger current and quick ratios, reinforcing its superior ability to weather short-term shocks.
Final Verdict: Which stock to choose?
Intel Corporation’s superpower lies in its resilient cash position and operational scale, which supports steady innovation despite recent profitability challenges. Its declining return on invested capital signals a need for cautious monitoring. Intel fits portfolios targeting turnaround potential within established tech giants.
MaxLinear, Inc. stands out with a strategic moat in niche semiconductor solutions and a strong R&D commitment fueling revenue growth. Compared to Intel, it carries higher operational risks but offers more dynamic growth prospects. MaxLinear suits growth-at-a-reasonable-price (GARP) investors willing to embrace volatility.
If you prioritize stability and scale, Intel is the compelling choice due to its robust cash flow and market presence despite current margin pressures. However, if you seek higher growth potential with acceptance of financial volatility, MaxLinear offers superior revenue momentum and innovation leverage. Both present analytical scenarios requiring prudent risk tolerance aligned with investment goals.
Disclaimer: Investment carries a risk of loss of initial capital. The past performance is not a reliable indicator of future results. Be sure to understand risks before making an investment decision.
Go Further
I encourage you to read the complete analyses of Intel Corporation and MaxLinear, Inc. to enhance your investment decisions: