Home > Comparison > Technology > INTC vs MRVL
The strategic rivalry between Intel Corporation and Marvell Technology, Inc. shapes the semiconductor industry’s evolution. Intel operates as a capital-intensive giant with a broad product portfolio spanning CPUs and system-on-chip solutions. Marvell focuses on high-margin analog and mixed-signal integrated circuits, emphasizing storage and networking. This head-to-head contrasts scale with specialization, offering distinct risk-return profiles. This analysis will identify which company’s trajectory presents superior risk-adjusted potential for a diversified technology portfolio.
Table of contents
Companies Overview
Intel Corporation and Marvell Technology, Inc. are pivotal players shaping the semiconductor industry’s future landscape.
Intel Corporation: Semiconductor Giant with Diverse Platforms
Intel commands the semiconductor sector with a broad product suite including CPUs, chipsets, and high-performance compute solutions. Its revenue stems from platform products and adjacent technologies like accelerators and connectivity. In 2026, Intel sharpens its focus on AI-driven platforms and autonomous driving technologies, leveraging its scale and innovation to serve OEMs and cloud providers globally.
Marvell Technology, Inc.: Specialist in Integrated Circuits
Marvell thrives by designing and selling mixed-signal and digital integrated circuits, excelling in Ethernet and storage solutions. Its core income comes from network adapters, ASICs, and storage controllers supporting advanced protocols like NVMe. Marvell’s 2026 strategy centers on expanding its footprint in cloud infrastructure and data-centric markets, capitalizing on agility and specialized product offerings.
Strategic Collision: Similarities & Divergences
Both firms operate in semiconductors but diverge in scope—Intel pursues a broad platform approach, while Marvell targets niche, high-performance components. Their primary battleground is cloud infrastructure, where Intel’s scale competes with Marvell’s specialized solutions. This contrast creates distinct investment profiles: Intel offers diversified exposure with scale advantages, Marvell provides focused growth tied to cutting-edge connectivity and storage technologies.
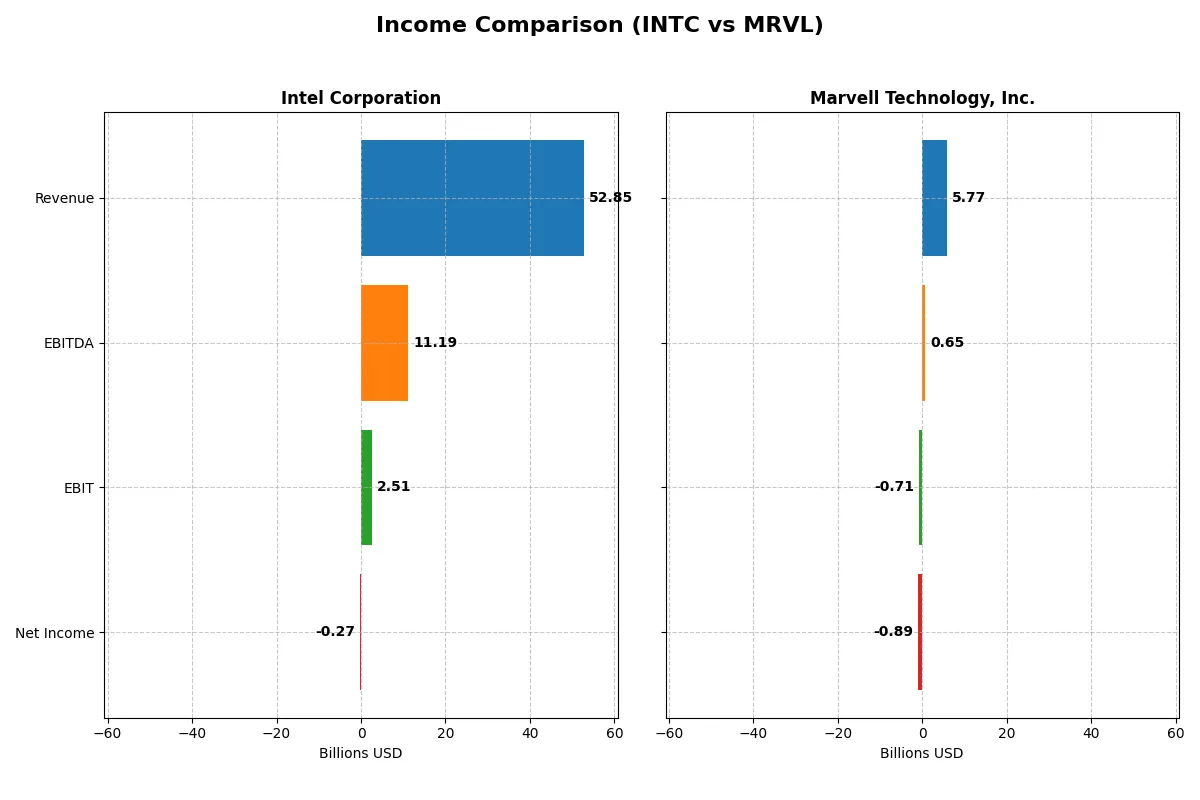
Income Statement Comparison
This data dissects the core profitability and scalability of both corporate engines to reveal who dominates the bottom line:
| Metric | Intel Corporation (INTC) | Marvell Technology, Inc. (MRVL) |
|---|---|---|
| Revenue | 52.9B | 5.77B |
| Cost of Revenue | 34.4B | 3.39B |
| Operating Expenses | 20.6B | 3.10B |
| Gross Profit | 18.5B | 2.38B |
| EBITDA | 11.2B | 652M |
| EBIT | 2.51B | -705M |
| Interest Expense | 953M | 189M |
| Net Income | -267M | -885M |
| EPS | -0.08 | -1.02 |
| Fiscal Year | 2025 | 2025 |
Income Statement Analysis: The Bottom-Line Duel
This income statement comparison reveals which company drives superior operational efficiency and profit generation over recent years.
Intel Corporation Analysis
Intel’s revenue declined from 79B in 2021 to 53B in 2025, reflecting a 33% drop overall. Net income plunged from 20B profit to a 267M loss, signaling severe bottom-line pressure. Despite this, Intel’s gross margin steadied near 35%, indicating resilient core profitability. The 2025 rebound in EBIT margin to 4.75% shows improving operating efficiency after steep losses in 2024.
Marvell Technology, Inc. Analysis
Marvell’s revenue expanded from 3B in 2021 to 5.8B in 2025, nearly doubling over five years. However, the company struggles with consistent profitability, posting net losses each year, including an 885M loss in 2025. Its 41% gross margin remains solid, but an unfavorable EBIT margin of -12.2% highlights ongoing operating inefficiencies. Recent revenue growth slowed to 4.7%, while net margins remain deeply negative.
Margin Stability vs. Revenue Growth Struggles
Intel exhibits greater scale and improved operating margins in 2025, despite a steep revenue contraction over five years. Marvell shows stronger top-line growth but fails to translate this into profitability. Intel’s slight net income recovery contrasts sharply with Marvell’s persistent losses. For investors prioritizing margin stability and a path to earnings, Intel’s profile currently holds more appeal.
Financial Ratios Comparison
These vital ratios act as a diagnostic tool to expose the underlying fiscal health, valuation premiums, and capital efficiency of the companies compared below:
| Ratios | Intel Corporation (INTC) | Marvell Technology, Inc. (MRVL) |
|---|---|---|
| ROE | -0.23% | -6.59% |
| ROIC | -0.02% | -3.88% |
| P/E | -658.4 | -110.4 |
| P/B | 1.54 | 7.27 |
| Current Ratio | 2.02 | 1.54 |
| Quick Ratio | 1.65 | 1.03 |
| D/E | 0.41 | 0.32 |
| Debt-to-Assets | 22.0% | 21.5% |
| Interest Coverage | -2.23 | -3.80 |
| Asset Turnover | 0.25 | 0.29 |
| Fixed Asset Turnover | 0.50 | 5.56 |
| Payout ratio | 0% | -23.4% |
| Dividend yield | 0% | 0.21% |
| Fiscal Year | 2025 | 2025 |
Efficiency & Valuation Duel: The Vital Signs
Financial ratios act as a company’s DNA, revealing hidden risks and operational strengths that raw numbers often obscure.
Intel Corporation
Intel’s profitability metrics paint a weak picture with negative ROE and net margin, signaling operational struggles. Its P/E ratio is notably negative but marked favorable, suggesting valuation complexities. Intel’s stable current ratio and manageable debt profile enhance financial safety. The absence of dividends indicates reinvestment into R&D, emphasizing a growth-oriented strategy over immediate shareholder payouts.
Marvell Technology, Inc.
Marvell shows deeper profitability issues with steeper negative ROE and net margin, reflecting operational inefficiencies. Its P/E ratio is also negative yet labeled favorable, pointing to valuation distortions amid losses. Marvell’s quick ratio and debt levels remain acceptable, but interest coverage is poor, raising caution. A small dividend yield exists, but reinvestment heavily favors R&D, underpinning future growth potential.
Valuation Complexities Amid Profitability Challenges
Both firms suffer from negative returns, but Intel’s stronger balance sheet offers more operational stability. Marvell’s higher valuation multiples and weak interest coverage increase risk. Intel suits investors prioritizing financial resilience, while Marvell fits those seeking aggressive growth despite elevated uncertainty.
Which one offers the Superior Shareholder Reward?
I compare Intel Corporation (INTC) and Marvell Technology, Inc. (MRVL) on dividends, payout ratios, and buybacks to judge shareholder reward. Intel yields 1.84% in 2025, with no dividend payout ratio reported, signaling irregularity, and negative free cash flow of -1B, raising sustainability concerns. Intel lacks buybacks amid weak profitability and cash flow. Marvell offers a minimal 0.21% dividend yield with a negative payout ratio, reflecting a reinvestment focus. It delivers positive free cash flow of 1.6B and maintains steady buyback programs, signaling capital return alongside growth investments. Marvell’s model better balances growth and shareholder return sustainably. I find Marvell’s total return profile more attractive for 2026 investors.
Comparative Score Analysis: The Strategic Profile
The radar chart reveals the fundamental DNA and trade-offs of Intel Corporation and Marvell Technology, Inc.:
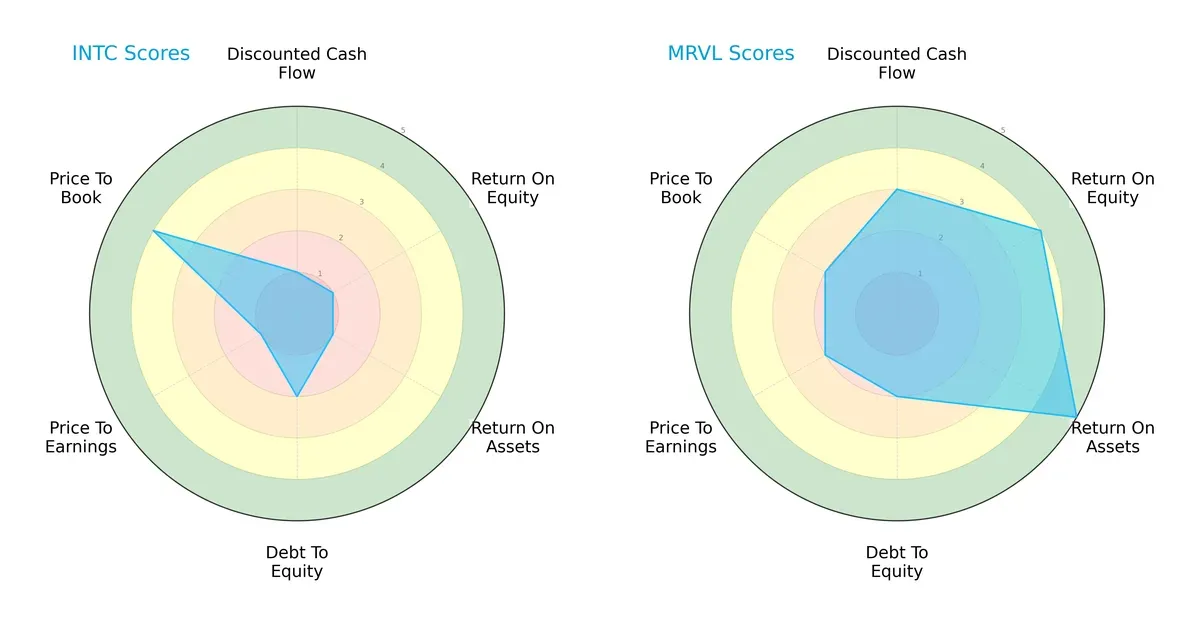
Marvell outperforms Intel across most metrics, boasting a solid DCF score of 3 versus Intel’s 1, indicating better cash flow prospects. Marvell’s ROE (4) and ROA (5) scores are significantly stronger, reflecting superior capital efficiency. Both have moderate debt-to-equity scores (2), but Intel’s valuation metrics show mixed signals with a favorable price-to-book score (4) contrasting a weak price-to-earnings score (1). Marvell maintains a more balanced profile, while Intel depends heavily on its book value advantage.
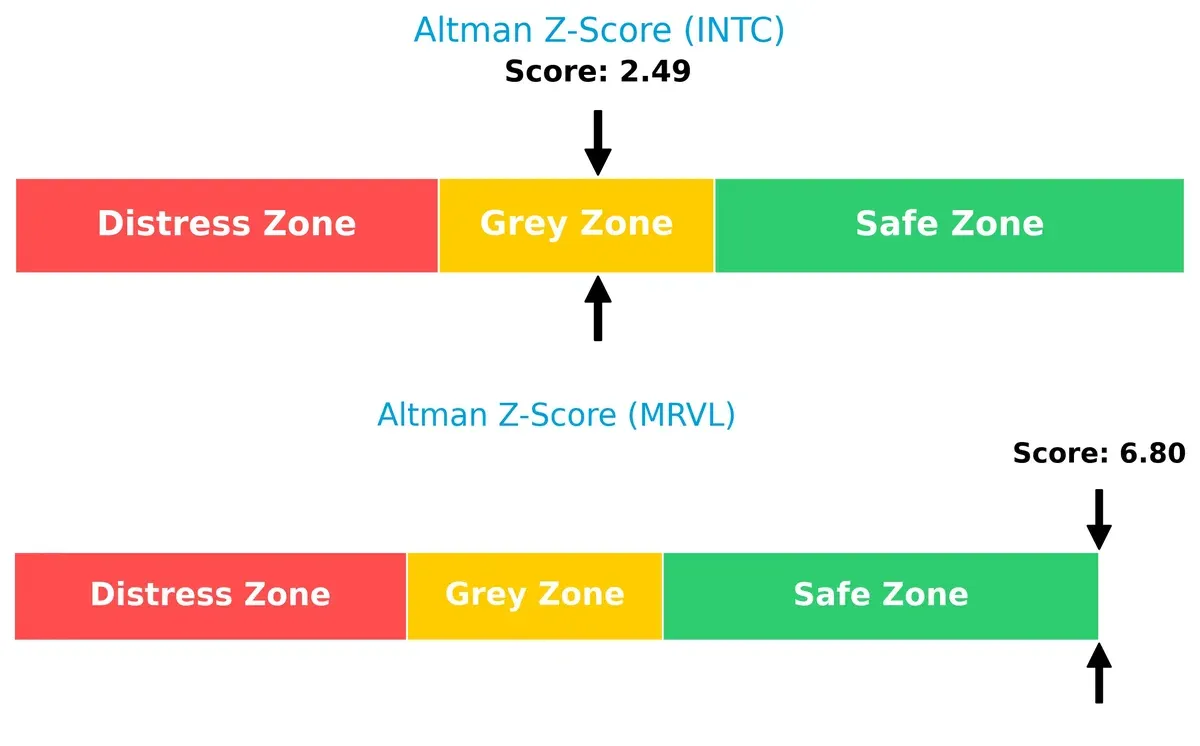
Bankruptcy Risk: Solvency Showdown
Marvell’s Altman Z-Score of 6.8 places it firmly in the safe zone, signaling robust financial stability. Intel’s 2.5 score sits in the grey zone, indicating moderate risk and caution for long-term survival in this volatile cycle:
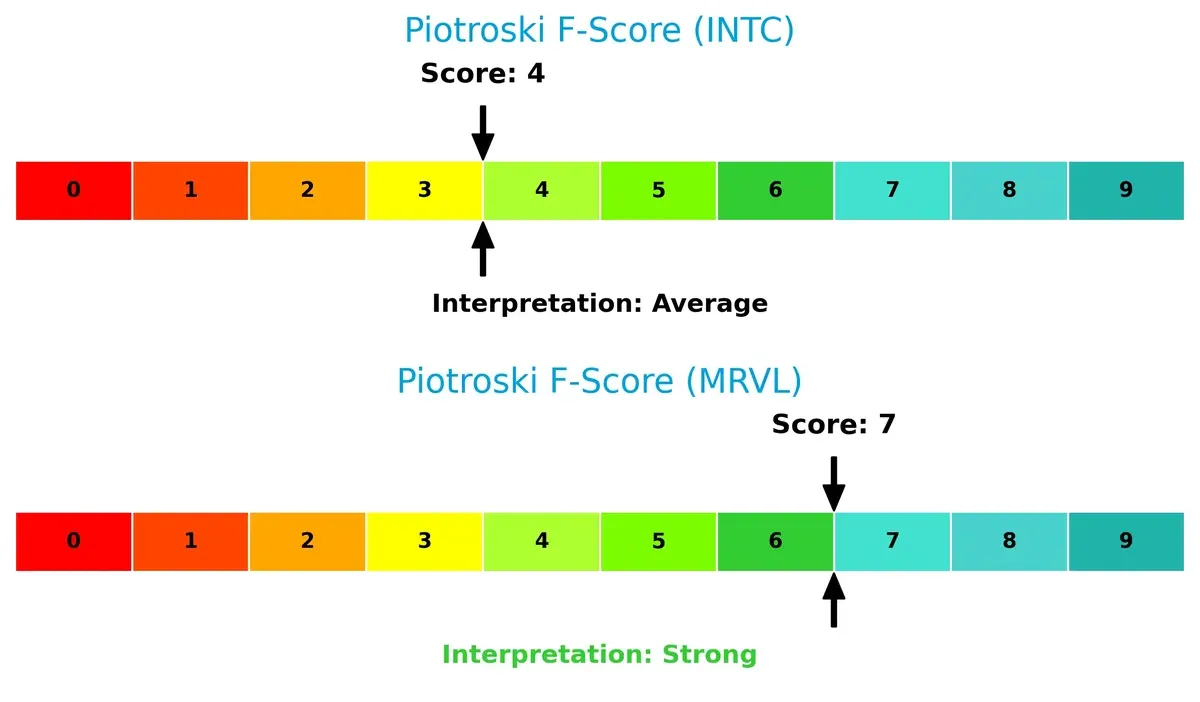
Financial Health: Quality of Operations
Marvell’s Piotroski F-Score of 7 reflects strong internal financial health and efficient operations. Intel’s score of 4 is average, signaling potential red flags in profitability or leverage management:
How are the two companies positioned?
This section dissects Intel and Marvell’s operational DNA by comparing revenue distribution and internal dynamics, including strengths and weaknesses. The goal is to confront their economic moats and identify which model offers the strongest, most sustainable advantage today.
Revenue Segmentation: The Strategic Mix
This visual comparison dissects how Intel Corporation and Marvell Technology diversify their income streams and reveals their primary sector bets:
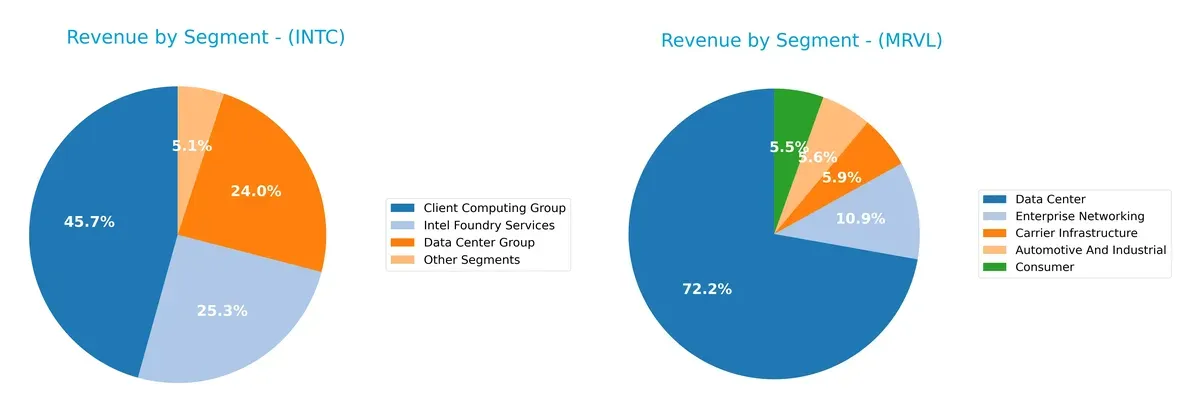
Intel’s revenue pivots heavily on its Client Computing Group, generating $32.2B in 2025, while Data Center and Foundry Services also anchor $16.9B and $17.8B respectively. Marvell shows a more balanced mix; its Data Center segment leads at $4.16B, but Automotive, Carrier Infrastructure, Consumer, and Enterprise Networking contribute meaningfully between $316M and $626M. Intel’s concentration suggests strong ecosystem lock-in but higher segment risk, while Marvell’s diversification cushions cyclical swings and positions it well across infrastructure niches.
Strengths and Weaknesses Comparison
This table compares the strengths and weaknesses of Intel Corporation and Marvell Technology, Inc.:
Intel Corporation Strengths
- Diversified revenue from computing, data center, foundry, and IoT segments
- Strong global presence with significant US and Asia-Pacific sales
- Favorable liquidity ratios indicate sound financial stability
Marvell Technology Strengths
- Focused revenue in data center and networking markets shows targeted innovation
- Favorable fixed asset turnover suggests efficient use of production assets
- Positive current and quick ratios reflect adequate short-term liquidity
Intel Corporation Weaknesses
- Negative profitability ratios including net margin and ROE indicate operational challenges
- Unfavorable asset turnover points to inefficient asset utilization
- Lack of dividend yield may deter income investors
Marvell Technology Weaknesses
- More severe negative profitability metrics reflect deeper earnings issues
- High WACC and unfavorable interest coverage signal costly capital and financial stress
- High PB ratio suggests possible overvaluation risk
Intel shows strength in diversification and global reach but struggles with profitability and asset efficiency. Marvell exhibits efficient asset use and liquidity but faces greater profitability and capital cost challenges. Both must address profitability to improve competitive positioning.
The Moat Duel: Analyzing Competitive Defensibility
A structural moat protects long-term profits from relentless competition erosion. Here’s how Intel and Marvell stack up in 2026:
Intel Corporation: Scale and Legacy Intangible Assets
Intel’s moat stems from deep intangible assets and scale economies. Its vast manufacturing footprint supports margin stability despite recent profit declines. New AI and autonomous driving platforms could either deepen this moat or accelerate disruption.
Marvell Technology, Inc.: Niche Technical Expertise and Innovation
Marvell relies on specialized mixed-signal and storage solutions, contrasting Intel’s broad scale. Its niche focus drives modest revenue growth but struggles with profitability. Expansion into cloud and 5G markets offers growth but faces intense competition.
Verdict: Scale Intangibles vs. Specialized Innovation
Both firms are value destroyers with declining ROICs, but Intel’s broader scale and diversified platform provide a wider moat. Intel is better positioned to defend market share amid semiconductor industry shifts.
Which stock offers better returns?
Over the past year, Intel Corporation’s stock showed steady bullish momentum with accelerating gains, while Marvell Technology’s price rose moderately but slowed recently with signs of deceleration.
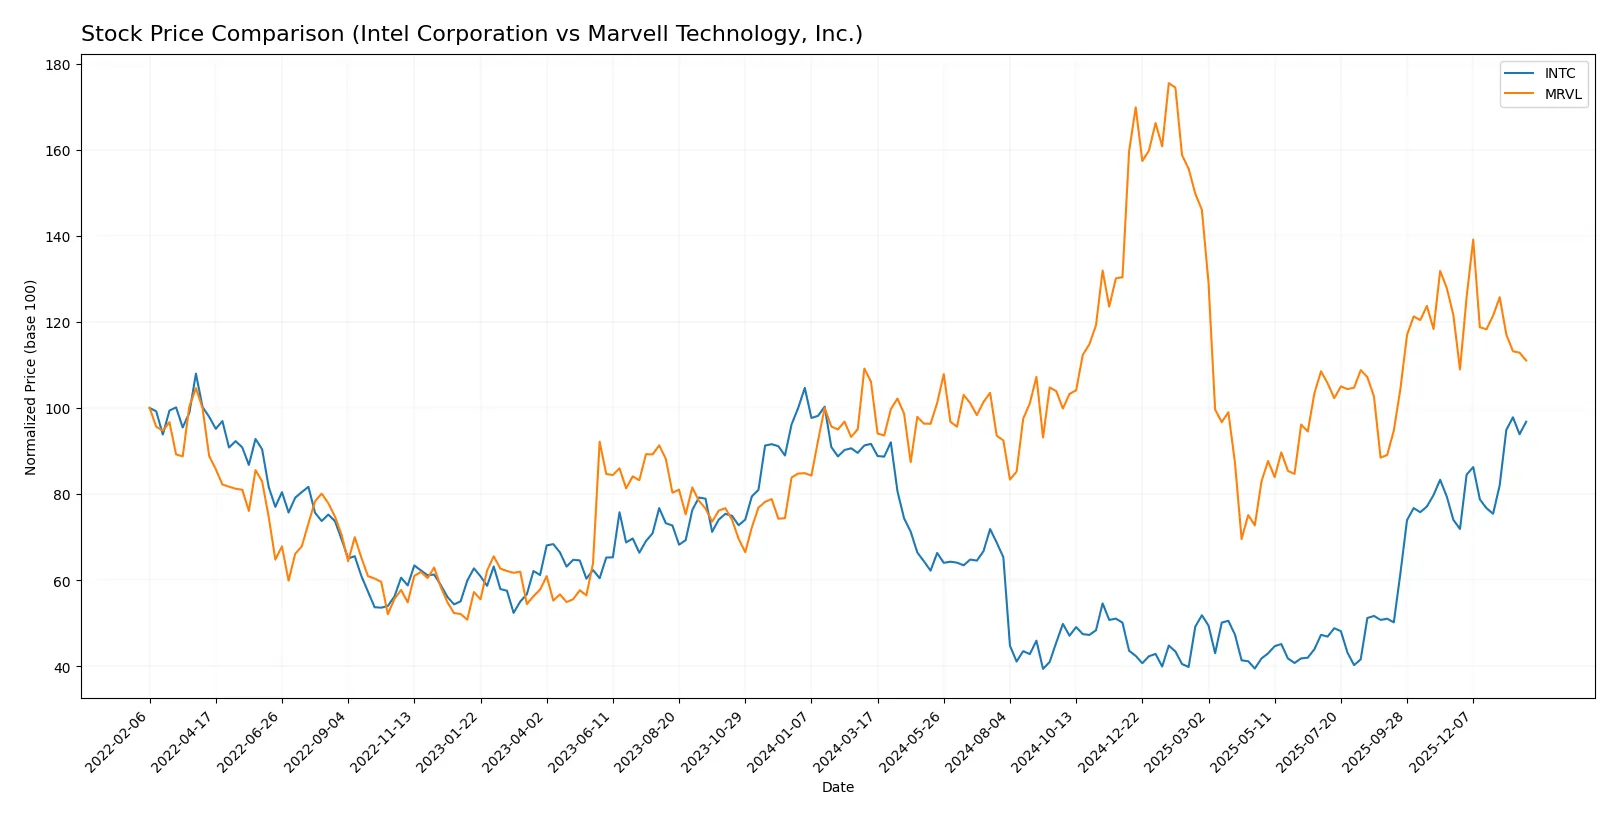
Trend Comparison
Intel’s stock increased 5.61% over the past 12 months, indicating a bullish trend with accelerating momentum and moderate volatility (8.11% std deviation).
Marvell’s stock rose 4.64% over the same period, also bullish but showing deceleration and higher volatility at 16.42% standard deviation.
Intel outperformed Marvell with a higher overall gain and recent acceleration, while Marvell’s trend weakened with a recent 8.71% decline.
Target Prices
Analysts present a mixed but optimistic consensus on Intel Corporation and Marvell Technology, Inc.
| Company | Target Low | Target High | Consensus |
|---|---|---|---|
| Intel Corporation | 20 | 66 | 46.95 |
| Marvell Technology, Inc. | 80 | 156 | 117 |
Intel’s target consensus of 46.95 aligns closely with its current price of 46.47, suggesting limited near-term upside. Marvell’s consensus target of 117 signals significant growth potential versus its current 78.92 price.

Don’t Let Luck Decide Your Entry Point
Optimize your entry points with our advanced ProRealTime indicators. You’ll get efficient buy signals with precise price targets for maximum performance. Start outperforming now!
How do institutions grade them?
Intel Corporation Grades
Here are the latest institutional grades for Intel Corporation:
| Grading Company | Action | New Grade | Date |
|---|---|---|---|
| RBC Capital | Maintain | Sector Perform | 2026-01-23 |
| Keybanc | Maintain | Overweight | 2026-01-23 |
| Evercore ISI Group | Maintain | In Line | 2026-01-23 |
| Needham | Maintain | Hold | 2026-01-23 |
| Benchmark | Maintain | Buy | 2026-01-23 |
| Rosenblatt | Maintain | Sell | 2026-01-23 |
| UBS | Maintain | Neutral | 2026-01-23 |
| Citigroup | Maintain | Neutral | 2026-01-23 |
| Stifel | Maintain | Hold | 2026-01-23 |
| Wedbush | Maintain | Neutral | 2026-01-23 |
Marvell Technology, Inc. Grades
The following table summarizes recent grades for Marvell Technology, Inc.:
| Grading Company | Action | New Grade | Date |
|---|---|---|---|
| Rosenblatt | Maintain | Buy | 2026-01-07 |
| Melius Research | Upgrade | Buy | 2026-01-05 |
| Benchmark | Downgrade | Hold | 2025-12-08 |
| JP Morgan | Maintain | Overweight | 2025-12-03 |
| Oppenheimer | Maintain | Outperform | 2025-12-03 |
| Roth Capital | Maintain | Buy | 2025-12-03 |
| Deutsche Bank | Maintain | Buy | 2025-12-03 |
| Needham | Maintain | Buy | 2025-12-03 |
| Evercore ISI Group | Maintain | Outperform | 2025-12-03 |
| Keybanc | Maintain | Overweight | 2025-12-03 |
Which company has the best grades?
Marvell Technology holds generally stronger grades, including multiple “Buy” and “Outperform” recommendations. Intel’s grades are mixed, ranging from “Sell” to “Buy,” signaling more divergent analyst views. This may affect investor confidence and portfolio positioning.
Risks specific to each company
The following categories pinpoint critical pressure points and systemic threats confronting Intel Corporation and Marvell Technology in the 2026 market environment:
1. Market & Competition
Intel Corporation
- Faces intense competition from diversified semiconductor firms; struggles with negative net margin and ROIC highlight operational pressure.
Marvell Technology, Inc.
- Competes aggressively in niche semiconductor segments; suffers from larger net margin losses and high P/B ratio, signaling valuation risks.
2. Capital Structure & Debt
Intel Corporation
- Maintains moderate debt with a favorable debt-to-assets ratio (22.03%) and decent interest coverage (2.63), suggesting manageable leverage.
Marvell Technology, Inc.
- Displays slightly lower debt-to-assets (21.5%) but poor interest coverage (-3.72), flagging potential difficulty servicing debt.
3. Stock Volatility
Intel Corporation
- Beta of 1.354 indicates moderate volatility, somewhat stable compared to broader market swings.
Marvell Technology, Inc.
- Beta of 1.945 shows significantly higher volatility, increasing investment risk in turbulent markets.
4. Regulatory & Legal
Intel Corporation
- As a US-headquartered tech giant, faces ongoing scrutiny on antitrust and export controls.
Marvell Technology, Inc.
- Also US-based but with diverse global operations, exposed to complex regulatory environments especially in Asia-Pacific markets.
5. Supply Chain & Operations
Intel Corporation
- Larger scale operations with 108,900 employees may risk supply chain inefficiencies; low asset turnover signals underutilization.
Marvell Technology, Inc.
- Smaller workforce (7,042) but higher fixed asset turnover (5.56) implies more efficient asset use, though operational scale is limited.
6. ESG & Climate Transition
Intel Corporation
- Industry leader expected to face increasing pressure on sustainable manufacturing and climate goals adherence.
Marvell Technology, Inc.
- Faces similar ESG pressures but smaller scale could ease adaptation costs; no clear ESG metrics disclosed.
7. Geopolitical Exposure
Intel Corporation
- Global footprint with production and sales vulnerable to US-China tensions and trade policy shifts.
Marvell Technology, Inc.
- Extensive operations across Asia increase exposure to geopolitical risks, especially amid supply chain disruptions in the region.
Which company shows a better risk-adjusted profile?
Intel’s primary risk lies in operational underperformance and negative profitability metrics, despite stable leverage. Marvell’s biggest threat is its poor debt servicing capability coupled with elevated stock volatility. Marvell’s stronger Altman Z-Score and Piotroski Score suggest better financial health, but its elevated beta and interest coverage raise caution. Intel’s scale and diversification provide some buffer, yet its negative returns and asset inefficiencies weigh heavily. Overall, Marvell presents a more favorable risk-adjusted profile due to stronger financial stability scores, despite higher market volatility.
Final Verdict: Which stock to choose?
Intel’s superpower lies in its strong liquidity and cost control amid challenging market conditions. Its consistent investment in R&D sustains technological relevance. A point of vigilance remains its ongoing value destruction, signaling caution for capital allocation. Intel suits investors targeting aggressive growth with a tolerance for operational headwinds.
Marvell’s strategic moat is its solid foothold in niche semiconductor markets and efficient asset utilization. Compared to Intel, it offers better financial stability signals, including a safer bankruptcy risk profile. Marvell fits investors favoring GARP strategies—seeking growth tempered with reasonable valuation discipline.
If you prioritize aggressive growth and can absorb near-term value erosion, Intel’s scale and innovation efforts make it a compelling scenario. However, if you seek a balance of growth with stronger financial stability and lower distress risk, Marvell outshines Intel by offering a safer investment landscape despite its continued margin pressures.
Disclaimer: Investment carries a risk of loss of initial capital. The past performance is not a reliable indicator of future results. Be sure to understand risks before making an investment decision.
Go Further
I encourage you to read the complete analyses of Intel Corporation and Marvell Technology, Inc. to enhance your investment decisions: