Home > Comparison > Technology > INTC vs LSCC
The strategic rivalry between Intel Corporation and Lattice Semiconductor Corporation shapes the semiconductor sector’s evolution. Intel, a capital-intensive industrial giant, contrasts sharply with Lattice’s agile, niche-focused semiconductor model. This head-to-head pits scale and diversification against specialization and innovation. This analysis aims to uncover which corporate trajectory delivers the superior risk-adjusted return for diversified portfolios in a rapidly evolving tech landscape.
Table of contents
Companies Overview
Intel Corporation and Lattice Semiconductor Corporation are pivotal players in the semiconductor industry, shaping technology markets globally.
Intel Corporation: Global Semiconductor Powerhouse
Intel dominates the semiconductor sector with a diverse product portfolio, including CPUs, chipsets, and high-performance compute solutions. Its core revenue stems from platform products and system-on-chip packages. In 2026, Intel’s strategic focus sharpens on advanced AI integration and autonomous driving platforms, leveraging partnerships to enhance innovation in emerging technologies.
Lattice Semiconductor Corporation: FPGA Specialist
Lattice Semiconductor specializes in field programmable gate arrays (FPGAs) and video connectivity products, serving communications, computing, and industrial markets. The company’s revenue engine relies on FPGA sales and IP licensing. In 2026, Lattice’s strategy centers on expanding its low-power FPGA offerings and broadening its footprint in automotive and industrial sectors with flexible, customizable semiconductor solutions.
Strategic Collision: Similarities & Divergences
Intel and Lattice both advance semiconductor technology but diverge in approach: Intel pursues a broad, integrated platform, while Lattice focuses on niche, low-power FPGAs with flexible deployment. Their primary battleground lies in specialized computing applications and embedded systems. Intel offers scale and diversity, whereas Lattice provides agility and customization, defining distinct investment profiles for different risk appetites.
Income Statement Comparison
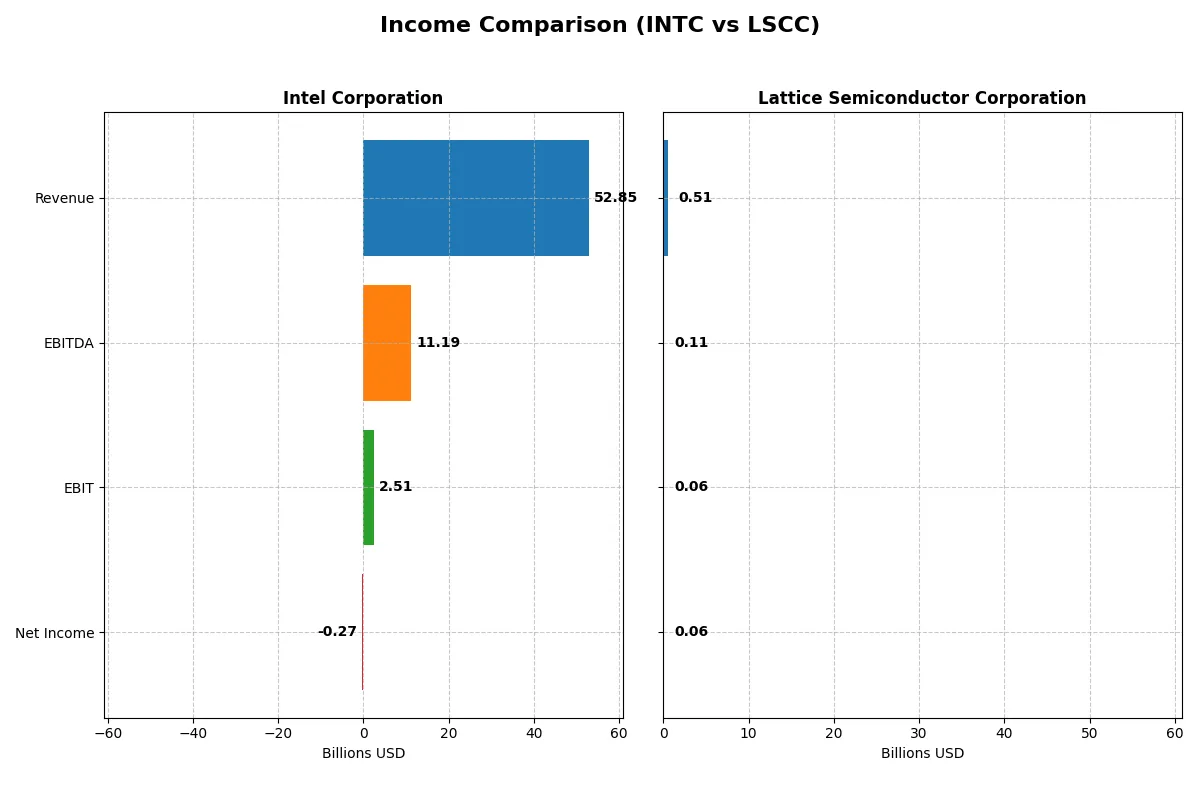
This data dissects the core profitability and scalability of both corporate engines to reveal who dominates the bottom line:
| Metric | Intel Corporation (INTC) | Lattice Semiconductor Corporation (LSCC) |
|---|---|---|
| Revenue | 52.9B | 509M |
| Cost of Revenue | 34.4B | 169M |
| Operating Expenses | 20.6B | 306M |
| Gross Profit | 18.5B | 340M |
| EBITDA | 11.2B | 107M |
| EBIT | 2.5B | 61M |
| Interest Expense | 953M | 266K |
| Net Income | -267M | 61M |
| EPS | -0.08 | 0.44 |
| Fiscal Year | 2025 | 2024 |
Income Statement Analysis: The Bottom-Line Duel
This income statement comparison reveals how efficiently Intel and Lattice Semiconductor convert revenue into profit, highlighting their operational strengths and weaknesses.
Intel Corporation Analysis
Intel’s revenue declined from 79B in 2021 to 52.85B in 2025, with net income plunging from 19.87B to a loss of 267M. Its gross margin remains moderate at 35%, while net margin turned negative at -0.51% in 2025. Despite revenue pressure, Intel improved EBIT margin to 4.75%, showing signs of operational recovery but struggling to translate this into positive net profits.
Lattice Semiconductor Corporation Analysis
Lattice’s revenue rose from 408M in 2020 to 737M in 2023 before slipping to 509M in 2024. Net income peaked at 259M in 2023 but dropped to 61M in 2024. Its gross margin is robust at 67%, and net margin held strong at 12%. Despite a recent dip in growth and profitability, Lattice maintains superior margin efficiency compared to Intel.
Scale vs. Margin Efficiency: The Profitability Showdown
Intel boasts much larger scale but faces declining revenues and negative net income in 2025, signaling structural challenges. Lattice operates smaller but delivers consistently higher margins and positive earnings. For investors, Intel’s profile reflects high risk with recovery potential, while Lattice offers steadier profitability and margin resilience.
Financial Ratios Comparison
These vital ratios act as a diagnostic tool to expose the underlying fiscal health, valuation premiums, and capital efficiency of Intel Corporation (INTC) and Lattice Semiconductor Corporation (LSCC):
| Ratios | Intel Corporation (INTC) | Lattice Semiconductor Corporation (LSCC) |
|---|---|---|
| ROE | -0.23% | 8.60% |
| ROIC | -0.02% | 4.59% |
| P/E | -658.38 | 132.74 |
| P/B | 1.54 | 11.41 |
| Current Ratio | 2.02 | 3.66 |
| Quick Ratio | 1.65 | 2.62 |
| D/E | 0.41 | 0.02 |
| Debt-to-Assets | 22.03% | 1.81% |
| Interest Coverage | -2.23 | 129.54 |
| Asset Turnover | 0.25 | 0.60 |
| Fixed Asset Turnover | 0.50 | 7.62 |
| Payout ratio | 0 | 0 |
| Dividend yield | 0 | 0 |
| Fiscal Year | 2025 | 2024 |
Efficiency & Valuation Duel: The Vital Signs
Financial ratios are the company’s DNA, revealing hidden risks and operational excellence investors must decode.
Intel Corporation
Intel’s core profitability struggles with negative ROE (-0.23%) and net margin (-0.51%), signaling operational challenges. Its valuation appears attractive with a favorable negative P/E, but a neutral PB ratio. Intel maintains a solid current ratio (2.02) and conservative leverage (D/E 0.41). Without dividends, it reinvests heavily in R&D, aiming at long-term growth despite short-term inefficiencies.
Lattice Semiconductor Corporation
Lattice shows robust net margin (12.0%) but lower ROE (8.6%) and ROIC (4.59%) relative to cost of capital (11.88%), indicating stretched profitability. Its valuation is expensive, with a high P/E (132.74) and PB (11.41). Lattice preserves liquidity with a strong quick ratio (2.62) and minimal debt. It shares no dividends, focusing on R&D investments to fuel future expansion and competitive positioning.
Premium Valuation vs. Operational Safety
Intel offers operational safety with conservative leverage and liquidity but faces profitability headwinds. Lattice commands a premium valuation justified by growth but bears stretched profitability metrics. Risk-averse investors may prefer Intel’s stability, while growth-focused investors might lean toward Lattice’s innovation-driven profile.
Which one offers the Superior Shareholder Reward?
Intel Corporation (INTC) pays a modest dividend yield around 1.8% in 2025 but struggles with negative free cash flow (-1B) and no share buybacks, signaling distribution risks. Lattice Semiconductor (LSCC) offers zero dividends but deploys robust buybacks supported by strong free cash flow (~870M) and a high operating cash flow ratio (1.41), fueling sustainable capital returns. LSCC’s aggressive buyback and reinvestment strategy, backed by superior margins and low debt, promises higher long-term shareholder value. I conclude LSCC delivers the superior total return profile in 2026.
Comparative Score Analysis: The Strategic Profile
The radar chart reveals the fundamental DNA and trade-offs of Intel Corporation and Lattice Semiconductor Corporation, highlighting their financial strengths and weaknesses:
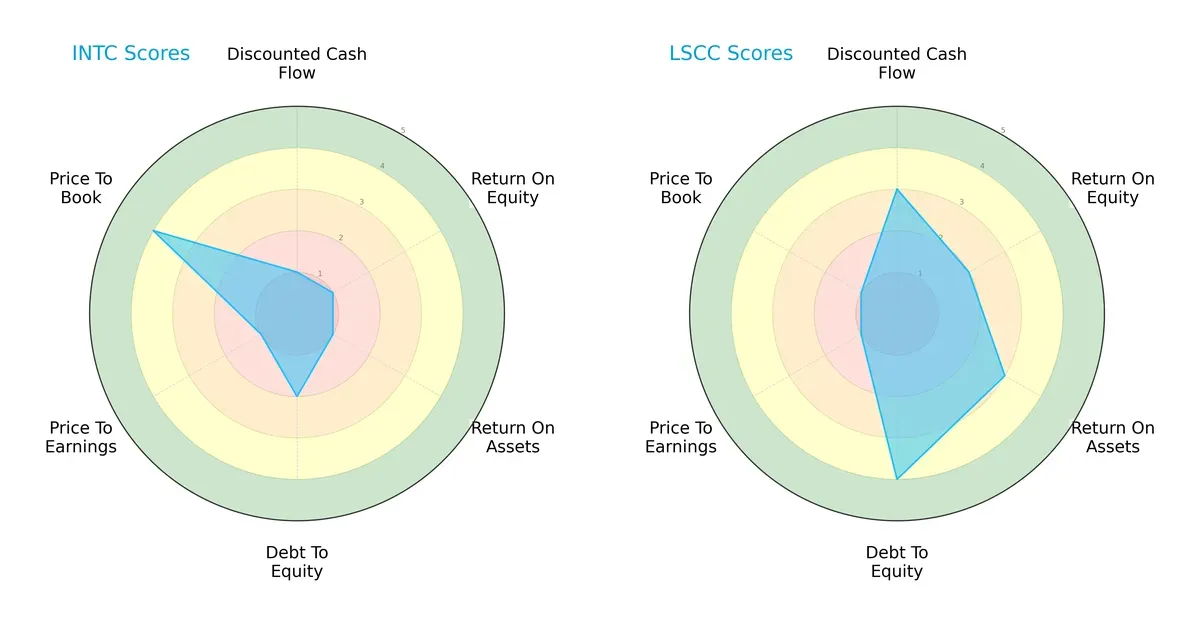
Intel shows a narrow edge in price-to-book valuation but struggles with discounted cash flow, ROE, and ROA, scoring very unfavorable in these areas. Lattice Semiconductor presents a more balanced profile with moderate scores in cash flow, returns, and a favorable debt-to-equity position. Intel relies heavily on valuation metrics, while Lattice demonstrates operational and balance sheet strength.
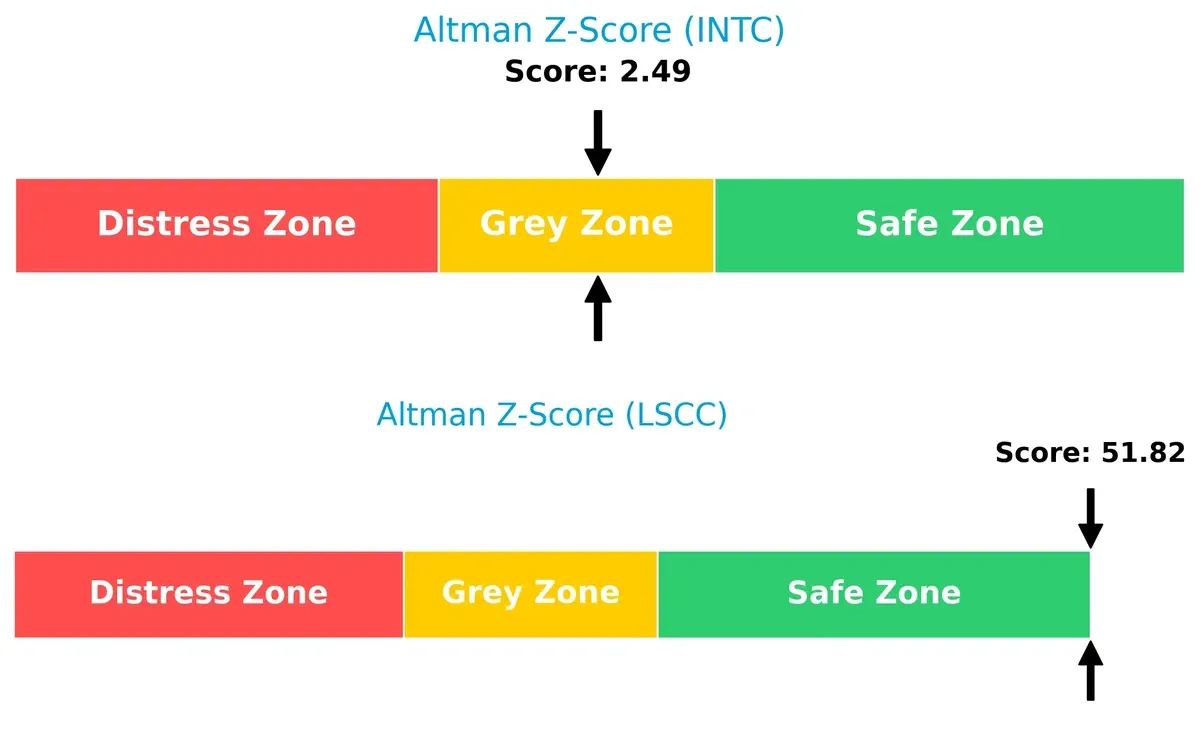
Bankruptcy Risk: Solvency Showdown
The Altman Z-Score gap shows Lattice Semiconductor in a safe zone, indicating strong financial stability, while Intel sits in the grey zone, reflecting moderate bankruptcy risk:
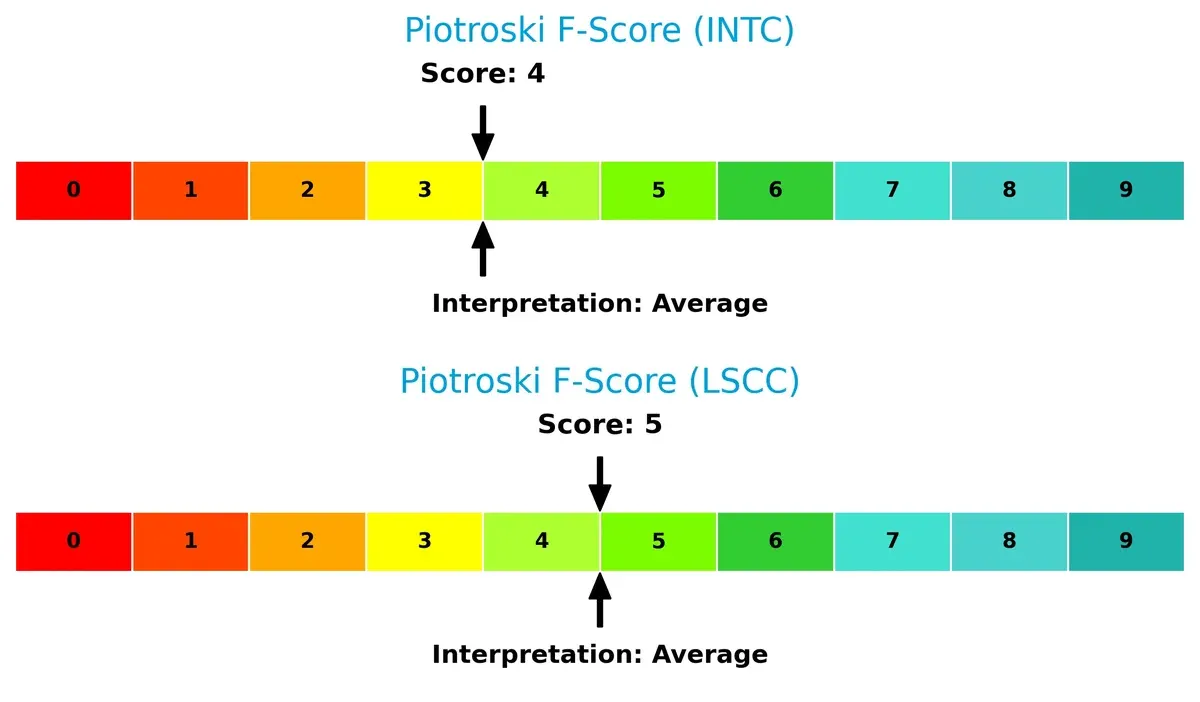
Financial Health: Quality of Operations
Piotroski F-Scores place both companies in average financial health, with Lattice slightly ahead, suggesting marginally better internal operational quality and fewer red flags than Intel:
How are the two companies positioned?
This section dissects the operational DNA of Intel and Lattice Semiconductor by comparing their revenue distribution and internal dynamics. The goal is to confront their economic moats and identify which model offers the most resilient competitive advantage today.
Revenue Segmentation: The Strategic Mix
This comparison dissects how Intel Corporation and Lattice Semiconductor diversify their income streams and reveals their primary sector bets:
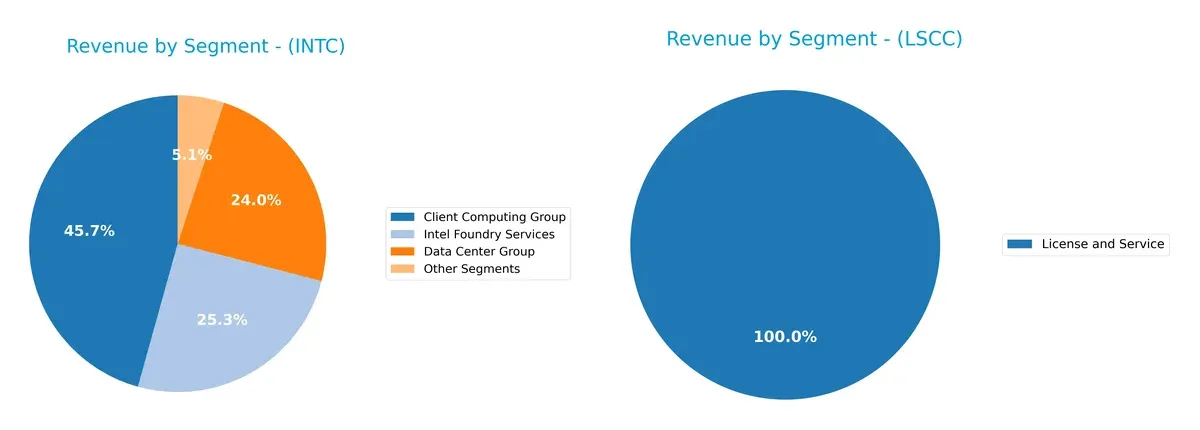
Intel’s revenue mix pivots on three large segments in 2025: Client Computing Group at $32.2B, Intel Foundry Services at $17.8B, and Data Center Group at $16.9B. This balance illustrates a diversified portfolio reducing dependence on any single stream. Conversely, Lattice Semiconductor relies predominantly on “Product Revenue, Distributors” with $331.9M in 2019, anchoring most income and exposing it to concentration risk in distribution channels. Intel’s ecosystem lock-in strategy contrasts with Lattice’s narrower revenue base.
Strengths and Weaknesses Comparison
This table compares the strengths and weaknesses of Intel Corporation and Lattice Semiconductor Corporation:
Intel Corporation Strengths
- Diversified revenue streams across computing, data centers, foundry services, and IoT
- Solid global presence with strong US and Asia sales
- Favorable liquidity ratios indicate financial stability
Lattice Semiconductor Corporation Strengths
- Strong net margin reflects operational efficiency
- Low debt to assets ratio minimizes financial risk
- High interest coverage signals strong ability to service debt
Intel Corporation Weaknesses
- Negative profitability ratios including net margin, ROE, and ROIC
- Unfavorable asset turnover ratios suggest inefficient asset use
- No dividend yield may deter income-focused investors
Lattice Semiconductor Corporation Weaknesses
- Unfavorable valuation metrics with high P/E and P/B ratios
- Current ratio is low, indicating potential liquidity concerns
- ROE and ROIC below WACC suggest weaker capital efficiency
Intel exhibits broad diversification and global reach but faces profitability and efficiency challenges. Lattice shows operational profitability and strong debt metrics but contends with high valuations and some liquidity weaknesses. Both companies reflect slightly unfavorable overall financial ratio profiles, highlighting areas for strategic focus.
The Moat Duel: Analyzing Competitive Defensibility
A structural moat remains the sole protector of long-term profits against relentless competition erosion. Let’s examine how Intel and Lattice Semiconductor defend their turf:
Intel Corporation: Intangible Assets and Scale Advantage
Intel’s moat stems from its vast R&D capabilities and manufacturing scale, which historically support high gross margins near 35%. However, its ROIC has plunged below WACC, signaling value destruction. The 2026 outlook hinges on successful innovation in AI and cloud platforms to rebuild its moat.
Lattice Semiconductor Corporation: Cost Advantage in Niche FPGA Market
Lattice leverages cost-efficient FPGA technology, yielding superior gross margins above 66% and strong net margins near 12%. Yet, like Intel, its declining ROIC below WACC warns of weakening economic profit. Growth depends on expanding its IP licensing and industrial applications globally.
Scale and Innovation vs. Niche Cost Leadership: Whose Moat Holds Deeper?
Both firms show deteriorating ROIC trends, eroding their moats. Intel’s intangible assets and scale offer broader defense, but execution risks loom. Lattice’s focused cost advantage is narrower but more stable. Intel remains better positioned to defend market share if it reverses its profitability slide.
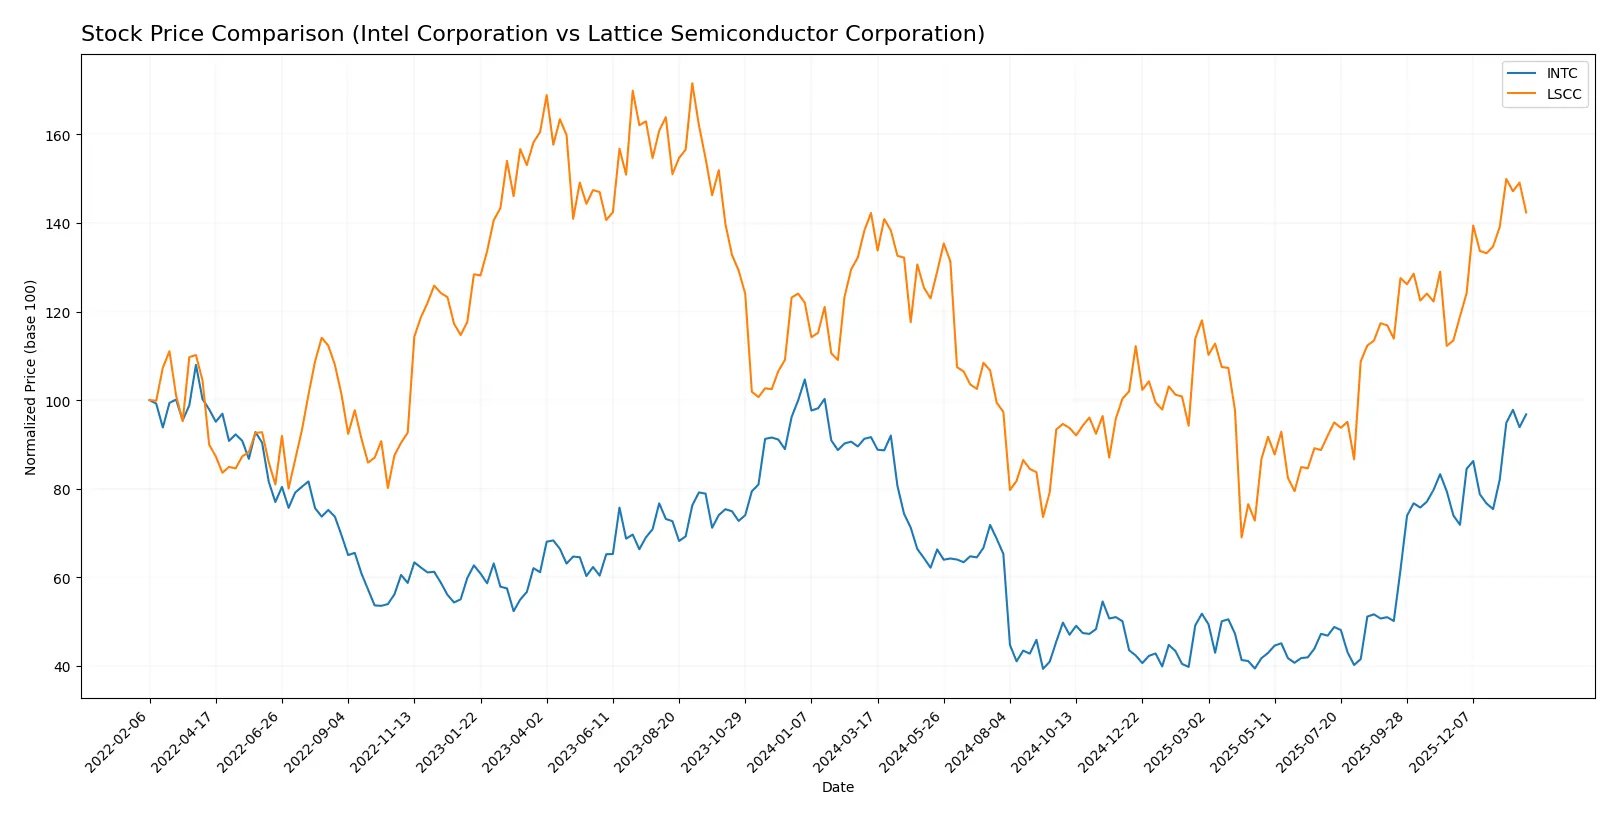
Which stock offers better returns?
The past year shows Intel’s price rising steadily with notable acceleration, while Lattice Semiconductor’s price remains nearly flat but with recent strong gains.
Trend Comparison
Intel Corporation’s stock increased 5.61% over the past 12 months, marking a bullish trend with accelerating momentum and a high price range of 18.89 to 46.96.
Lattice Semiconductor Corporation’s stock rose just 0.09% over the same period, indicating a neutral to mildly bullish trend, but recent acceleration shows promise despite higher volatility.
Intel’s overall performance leads with a stronger 12-month return, though Lattice’s recent surge narrows the gap between their market performances.
Target Prices
Analysts show a clear consensus on target prices for Intel Corporation and Lattice Semiconductor Corporation.
| Company | Target Low | Target High | Consensus |
|---|---|---|---|
| Intel Corporation | 20 | 66 | 46.95 |
| Lattice Semiconductor Corporation | 65 | 105 | 84.67 |
Intel’s target consensus aligns closely with its current price of $46.47, suggesting limited near-term upside. Lattice Semiconductor’s consensus target of $84.67 exceeds its $80.52 price, indicating moderate growth potential.

Don’t Let Luck Decide Your Entry Point
Optimize your entry points with our advanced ProRealTime indicators. You’ll get efficient buy signals with precise price targets for maximum performance. Start outperforming now!
How do institutions grade them?
Intel Corporation Grades
The following table summarizes recent institutional grades for Intel Corporation:
| Grading Company | Action | New Grade | Date |
|---|---|---|---|
| RBC Capital | Maintain | Sector Perform | 2026-01-23 |
| Keybanc | Maintain | Overweight | 2026-01-23 |
| Evercore ISI Group | Maintain | In Line | 2026-01-23 |
| Needham | Maintain | Hold | 2026-01-23 |
| Benchmark | Maintain | Buy | 2026-01-23 |
| Rosenblatt | Maintain | Sell | 2026-01-23 |
| UBS | Maintain | Neutral | 2026-01-23 |
| Citigroup | Maintain | Neutral | 2026-01-23 |
| Stifel | Maintain | Hold | 2026-01-23 |
| Wedbush | Maintain | Neutral | 2026-01-23 |
Lattice Semiconductor Corporation Grades
Here are the recent institutional grades for Lattice Semiconductor Corporation:
| Grading Company | Action | New Grade | Date |
|---|---|---|---|
| Susquehanna | Maintain | Positive | 2026-01-22 |
| Keybanc | Maintain | Overweight | 2026-01-13 |
| Needham | Maintain | Buy | 2025-11-04 |
| Benchmark | Maintain | Buy | 2025-11-04 |
| Stifel | Maintain | Buy | 2025-11-04 |
| Baird | Maintain | Outperform | 2025-11-04 |
| Rosenblatt | Maintain | Buy | 2025-11-04 |
| Susquehanna | Maintain | Positive | 2025-10-22 |
| Keybanc | Maintain | Overweight | 2025-09-30 |
| Needham | Maintain | Buy | 2025-09-22 |
Which company has the best grades?
Lattice Semiconductor consistently receives Buy and Outperform grades, indicating stronger institutional confidence. Intel’s grades vary widely from Sell to Buy, suggesting less consensus. This disparity may influence investors seeking more uniform analyst support.
Risks specific to each company
The following categories identify critical pressure points and systemic threats facing Intel Corporation and Lattice Semiconductor Corporation in the 2026 market environment:
1. Market & Competition
Intel Corporation
- Faces intense competition in semiconductors with declining net margins and asset turnover.
Lattice Semiconductor Corporation
- Competes in niche FPGA markets, showing stronger net margin but higher valuation risks.
2. Capital Structure & Debt
Intel Corporation
- Moderate debt level with favorable debt-to-assets ratio and manageable interest coverage.
Lattice Semiconductor Corporation
- Very low debt, strong interest coverage, indicating conservative financial leverage.
3. Stock Volatility
Intel Corporation
- Beta of 1.35 indicates moderately high stock volatility relative to the market.
Lattice Semiconductor Corporation
- Higher beta at 1.72 signals greater stock price volatility and risk.
4. Regulatory & Legal
Intel Corporation
- Large multinational exposure increases regulatory scrutiny risks.
Lattice Semiconductor Corporation
- Smaller scale but still exposed to semiconductor export controls and IP litigation risks.
5. Supply Chain & Operations
Intel Corporation
- Complex global supply chain vulnerable to geopolitical tensions and component shortages.
Lattice Semiconductor Corporation
- More focused operations, but reliant on third-party manufacturers and key suppliers.
6. ESG & Climate Transition
Intel Corporation
- Increasing pressure on sustainability metrics and energy-intensive manufacturing.
Lattice Semiconductor Corporation
- Growing focus on ESG, but less public data on climate transition risks.
7. Geopolitical Exposure
Intel Corporation
- Significant exposure to US-China tensions affecting supply chains and market access.
Lattice Semiconductor Corporation
- Moderate exposure, mostly through international sales and supplier networks.
Which company shows a better risk-adjusted profile?
Intel’s main risk lies in operational and competitive pressures eroding profitability. Lattice’s key risk stems from high stock volatility and valuation concerns. Despite Intel’s operational challenges, its stable capital structure and lower volatility offer a better risk-adjusted profile. The substantial difference in Altman Z-scores—Intel in the grey zone versus Lattice safely positioned—confirms this caution.
Final Verdict: Which stock to choose?
Intel Corporation’s core strength lies in its strategic scale and deep industry footprint, offering a resilient production capacity that few can match. However, its declining profitability and value destruction signal a need for caution. It suits portfolios aiming for turnaround potential amid established tech giants.
Lattice Semiconductor stands out with its specialized niche and robust free cash flow generation, supported by a lean balance sheet and a strong interest coverage ratio. Its moat is narrower but more focused, providing relatively better financial safety than Intel. It fits well in portfolios targeting GARP – growth at a reasonable price.
If you prioritize scale and market presence with a tolerance for operational headwinds, Intel offers compelling turnaround exposure despite current challenges. However, if you seek disciplined capital efficiency and cleaner financials with moderate growth, Lattice Semiconductor offers better stability and focused growth potential. Both carry risks, but your choice depends on your appetite for established legacy versus nimble innovation.
Disclaimer: Investment carries a risk of loss of initial capital. The past performance is not a reliable indicator of future results. Be sure to understand risks before making an investment decision.
Go Further
I encourage you to read the complete analyses of Intel Corporation and Lattice Semiconductor Corporation to enhance your investment decisions: