Home > Comparison > Technology > LRCX vs INTC
The strategic rivalry between Lam Research Corporation and Intel Corporation defines the current trajectory of the semiconductor industry. Lam Research operates as a specialized equipment manufacturer, focusing on precision tools for chip fabrication. Intel, by contrast, is a diversified semiconductor giant designing and producing a broad array of computing products. This analysis will clarify which company presents a superior risk-adjusted profile, guiding investors seeking optimal exposure within this highly cyclical and capital-intensive sector.
Table of contents
Companies Overview
Lam Research Corporation and Intel Corporation anchor the semiconductor industry with distinct market roles and strategic approaches.
Lam Research Corporation: Semiconductor Equipment Specialist
Lam Research dominates the semiconductor equipment market by designing and manufacturing wafer fabrication tools. Its revenue hinges on advanced etch, deposition, and cleaning systems for integrated circuits. In 2026, Lam prioritizes innovation in high-density plasma and atomic layer deposition technologies to sustain its competitive edge globally.
Intel Corporation: Integrated Chipmaker and Platform Innovator
Intel leads as a chip designer and manufacturer, generating revenue from CPUs, chipsets, and adjacent products like accelerators and memory. Its 2026 strategy focuses on expanding high-performance compute solutions and AI-driven autonomous driving platforms to diversify beyond traditional PC markets.
Strategic Collision: Similarity and Divergence
Lam Research and Intel contrast sharply: Lam operates a specialized equipment model, while Intel pursues a broad integrated product ecosystem. Both compete intensely in semiconductor innovation, but their battleground lies in equipment technology versus chip design. Their investment profiles diverge—one bets on manufacturing tools, the other on end-user computing and AI platforms.
Income Statement Comparison
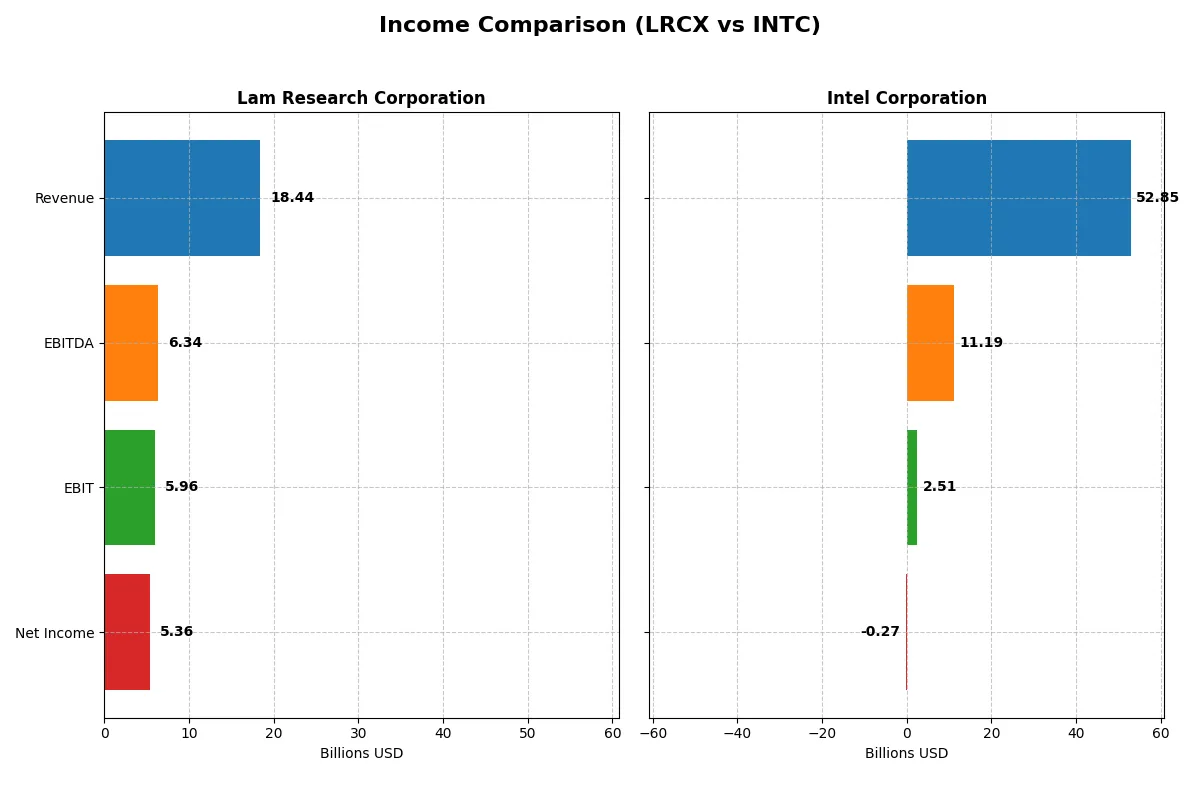
The following data dissects the core profitability and scalability of both corporate engines to reveal who dominates the bottom line:
| Metric | Lam Research Corporation (LRCX) | Intel Corporation (INTC) |
|---|---|---|
| Revenue | 18.4B | 52.9B |
| Cost of Revenue | 9.5B | 34.4B |
| Operating Expenses | 3.1B | 20.6B |
| Gross Profit | 9.0B | 18.5B |
| EBITDA | 6.3B | 11.2B |
| EBIT | 6.0B | 2.5B |
| Interest Expense | 178M | 953M |
| Net Income | 5.4B | -267M |
| EPS | 4.17 | -0.08 |
| Fiscal Year | 2025 | 2025 |
Income Statement Analysis: The Bottom-Line Duel
This income statement comparison uncovers the true operational efficiency and profitability momentum of two semiconductor giants.
Lam Research Corporation Analysis
Lam Research displays a strong upward trajectory, with 2025 revenue at $18.4B, up 24% from 2024. Net income surged 40% to $5.36B, driving a robust net margin of 29.1%. Lam’s gross margin holds favorably near 49%, and its EBIT margin improved to 32.3%, signaling excellent cost control and operational leverage in the latest fiscal year.
Intel Corporation Analysis
Intel’s 2025 revenue declined slightly to $52.9B, down 0.5% from 2024, while net income swung to a loss of $267M from a positive $1.69B in 2023. Its gross margin remains moderate at 35%, but the negative net margin of -0.5% reveals ongoing profit struggles. Despite a 125% EBIT growth from 2024 to 2025, Intel’s profitability remains volatile and under pressure.
Growth and Margin Dominance: Lam’s Consistency vs. Intel’s Volatility
Lam Research outperforms Intel clearly in margin quality and sustained net income growth over 2021–2025. Lam’s consistently favorable gross and net margins contrast with Intel’s shrinking revenue and negative net margin in 2025. For investors prioritizing stable profitability and margin expansion, Lam’s profile offers a more attractive, reliable growth engine.
Financial Ratios Comparison
These vital ratios act as a diagnostic tool to expose the underlying fiscal health, valuation premiums, and capital efficiency of the companies compared:
| Ratios | Lam Research (LRCX) | Intel Corporation (INTC) |
|---|---|---|
| ROE | 54.3% | -0.23% |
| ROIC | 34.0% | -0.02% |
| P/E | 23.4 | -658.4 |
| P/B | 12.7 | 1.54 |
| Current Ratio | 2.21 | 2.02 |
| Quick Ratio | 1.55 | 1.65 |
| D/E | 0.48 | 0.41 |
| Debt-to-Assets | 22.3% | 22.0% |
| Interest Coverage | 33.1 | -2.23 |
| Asset Turnover | 0.86 | 0.25 |
| Fixed Asset Turnover | 7.59 | 0.50 |
| Payout Ratio | 21.5% | 0.0% |
| Dividend Yield | 0.92% | 0.00% |
| Fiscal Year | 2025 | 2025 |
Efficiency & Valuation Duel: The Vital Signs
Financial ratios serve as a company’s DNA, exposing hidden operational strengths and potential risks that drive investor decisions.
Lam Research Corporation
Lam Research demonstrates formidable profitability with a 54.33% ROE and a 29.06% net margin, signaling operational excellence. Its valuation remains neutral at a 23.36 P/E, but a high 12.69 P/B ratio suggests some premium pricing. Shareholders receive a modest 0.92% dividend, complemented by solid reinvestment in R&D, fueling future growth.
Intel Corporation
Intel struggles with negative returns, posting a -0.23% ROE and a -0.51% net margin, reflecting operational challenges. The exceptionally low P/E of -658.38 is skewed by losses, while a 1.54 P/B ratio is fairly valued. Intel offers no dividend, directing resources into aggressive R&D to reverse its profitability slide.
Robust Profitability vs. Recovery Play
Lam Research offers a superior balance of profitability and valuation discipline, backed by consistent shareholder returns and investment in innovation. Intel’s profile fits risk-tolerant investors seeking turnaround potential amid operational headwinds and absent dividends.
Which one offers the Superior Shareholder Reward?
I observe Lam Research (LRCX) delivers a balanced shareholder reward with a 0.9% dividend yield and a prudent 21% payout ratio, well-covered by strong free cash flow of 4.2B. Its consistent buybacks enhance total returns sustainably. Intel (INTC) pays no dividend currently and reports negative free cash flow in 2025, reflecting ongoing reinvestment struggles. Intel’s weak operating margins and lack of buyback activity signal riskier returns. I conclude Lam Research offers the more attractive, sustainable total return profile for 2026 investors.
Comparative Score Analysis: The Strategic Profile
The radar chart reveals the fundamental DNA and trade-offs of Lam Research Corporation and Intel Corporation, highlighting their core financial strengths and vulnerabilities:
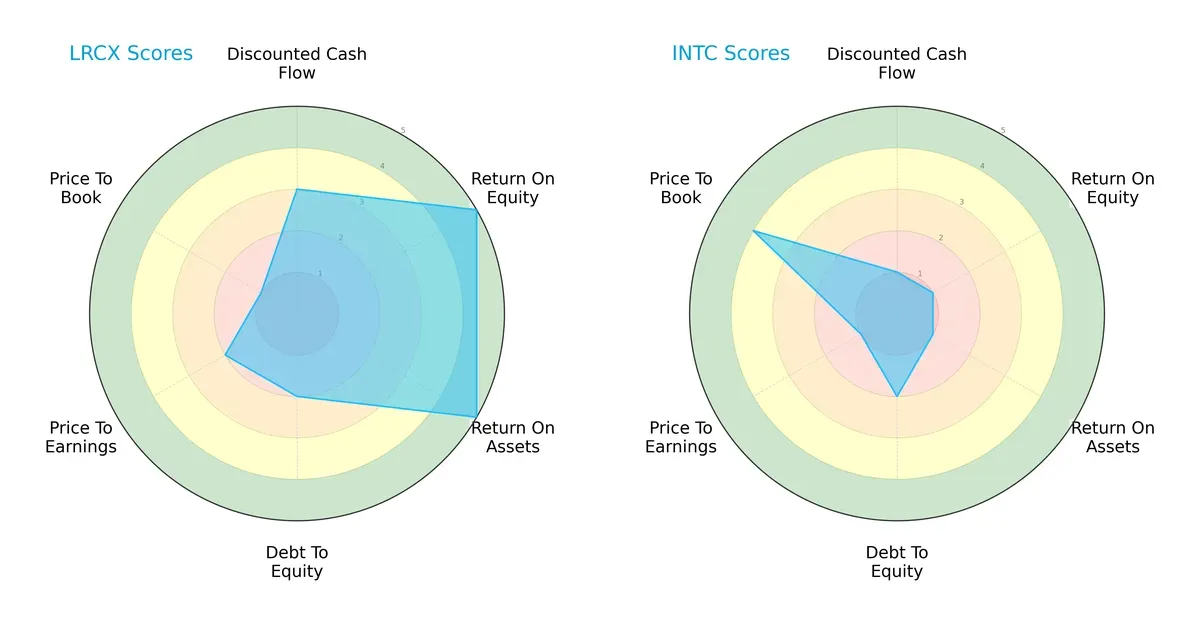
Lam Research boasts very favorable returns on equity (5) and assets (5), signaling efficient profit generation and asset use. Intel lags with scores of 1 in both metrics, reflecting operational challenges. Both share moderate debt-to-equity risk (2), but Lam Research’s valuation metrics appear stretched (P/B score 1 vs. Intel’s favorable 4). Lam Research presents a more balanced financial profile, while Intel relies on a valuation bargain potential amid weaker profitability.
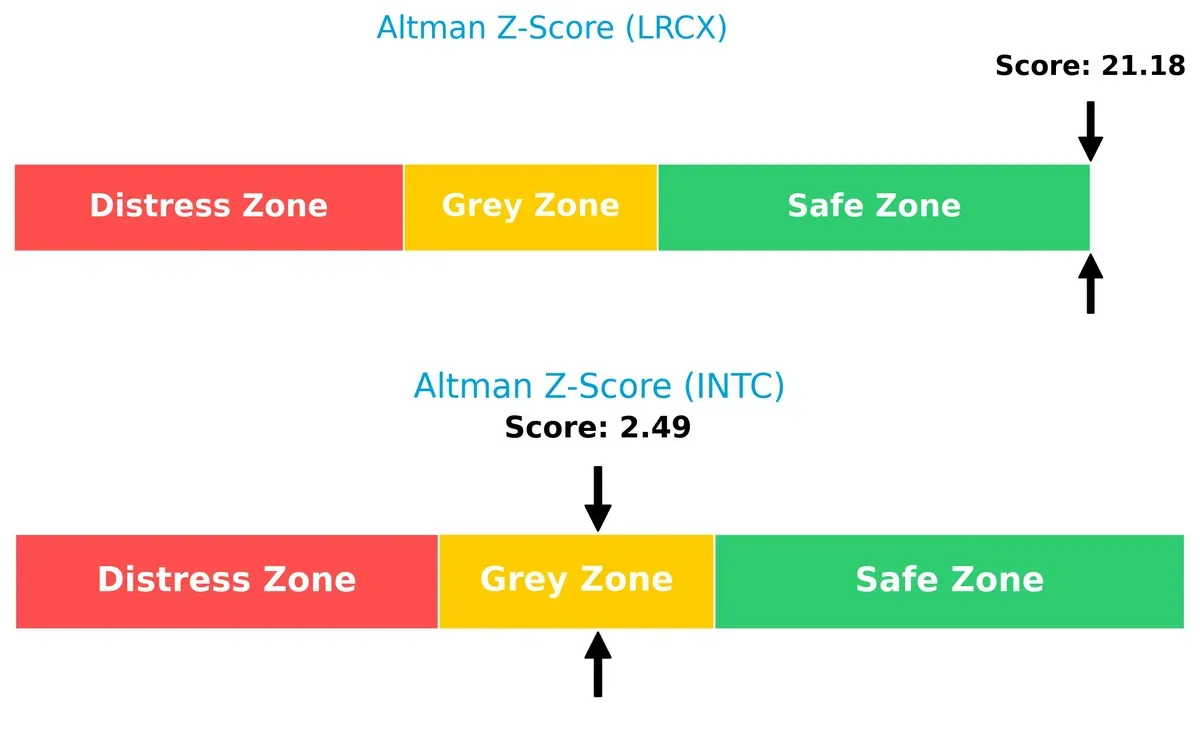
Bankruptcy Risk: Solvency Showdown
Lam Research’s Altman Z-Score of 21.2 firmly places it in the safe zone, while Intel’s 2.5 situates it in the grey zone, indicating a moderate bankruptcy risk in this economic cycle:
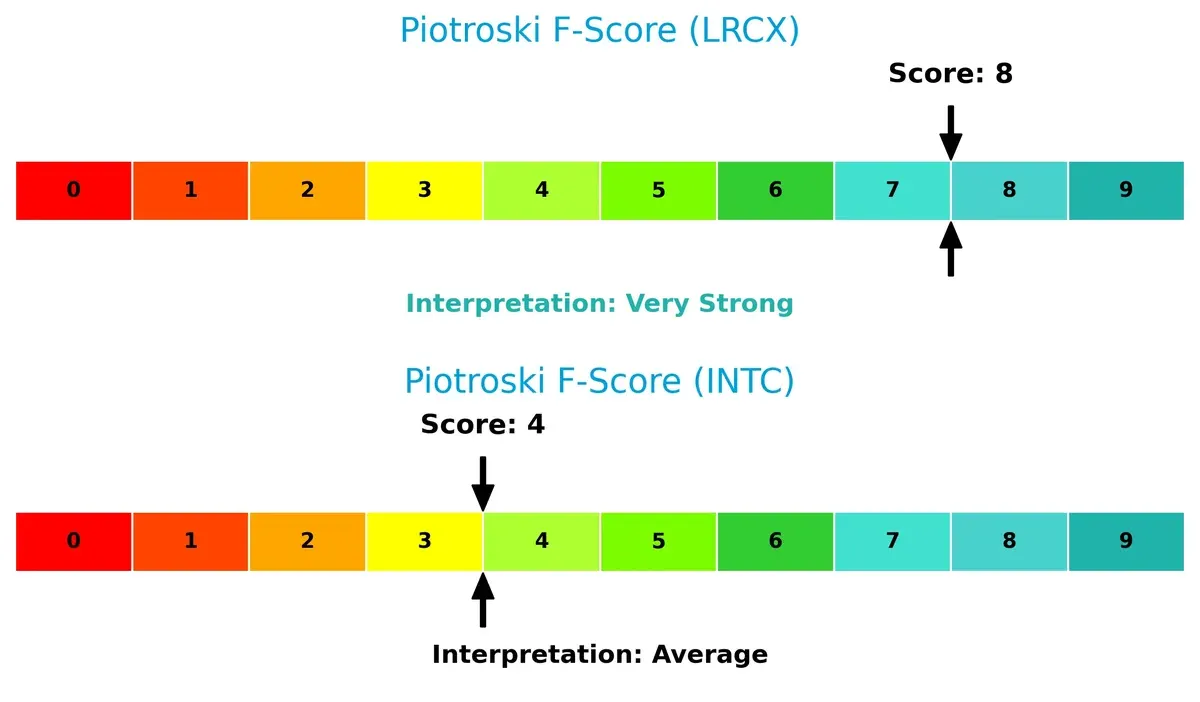
Financial Health: Quality of Operations
Lam Research scores an 8 on the Piotroski F-Score, indicating very strong financial health. Intel’s score of 4 signals average operational quality and internal red flags in profitability or efficiency:
How are the two companies positioned?
This section dissects the operational DNA of Lam Research and Intel by comparing their revenue distribution and internal strengths and weaknesses. The objective is to confront their economic moats to identify which model offers the most resilient, sustainable competitive advantage today.
Revenue Segmentation: The Strategic Mix
This visual comparison dissects how Lam Research Corporation and Intel Corporation diversify their income streams and where their primary sector bets lie:
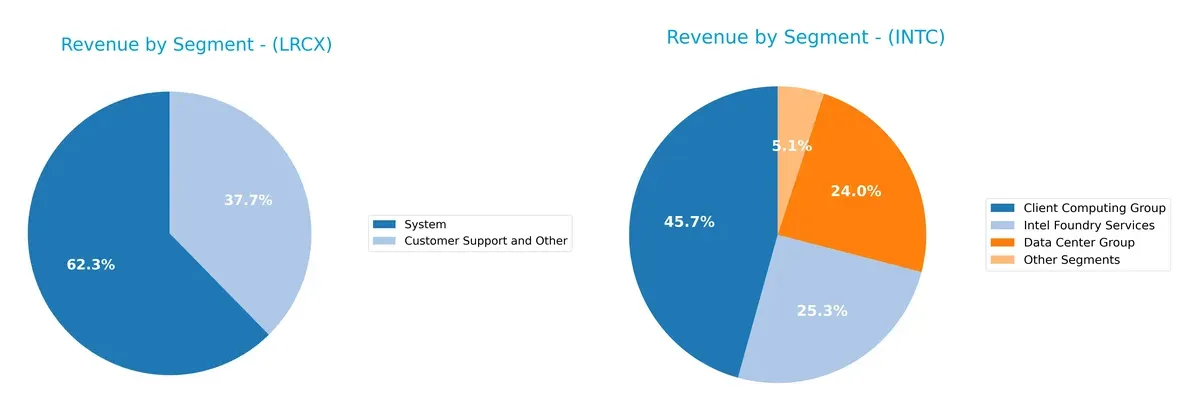
Lam Research anchors revenue in two segments: Systems at $11.5B and Customer Support at $6.9B, showing moderate diversification. Intel dwarfs Lam with a broader scope, generating $32.2B from Client Computing, $17B from Data Center, and $17.8B from Foundry Services. Intel’s mix pivots on a multi-pronged strategy, reducing concentration risk but increasing complexity. Lam’s focused approach signals infrastructure dominance, while Intel leverages ecosystem lock-in across diverse tech domains.
Strengths and Weaknesses Comparison
This table compares the Strengths and Weaknesses of Lam Research Corporation and Intel Corporation:
LRCX Strengths
- High profitability with 29.06% net margin and 54.33% ROE
- Solid liquidity with a 2.21 current ratio
- Low debt-to-assets at 22.28%
- Strong fixed asset turnover at 7.59
- Global presence in China, Korea, Taiwan, and Japan
INTC Strengths
- Large revenue diversification across Client Computing, Data Center, and Foundry Services
- Favorable P/E ratio despite losses
- Healthy liquidity ratios above 2.0
- Moderate debt levels with 22.03% debt-to-assets
- Strong U.S. and Asia-Pacific market presence
LRCX Weaknesses
- Unfavorable WACC at 12.05% exceeding ROIC
- High price-to-book ratio at 12.69
- Low dividend yield below 1%
- Neutral asset turnover at 0.86
INTC Weaknesses
- Negative profitability metrics: -0.51% net margin, negative ROE and ROIC
- Low asset turnover at 0.25 and fixed asset turnover at 0.5
- No dividend yield
- Interest coverage ratio weak at 2.63
Lam Research shows strong profitability and efficient asset use but faces cost of capital challenges. Intel benefits from broad revenue streams but struggles with profitability and asset efficiency, impacting its financial resilience.
The Moat Duel: Analyzing Competitive Defensibility
A structural moat is the only reliable defense against competition eroding long-term profits. Let’s dissect how these two semiconductor giants protect their turf:
Lam Research Corporation: Precision Engineering Moat
Lam Research commands a cost advantage through specialized semiconductor equipment with a 22% ROIC premium over WACC. Its high 32% EBIT margin reflects durable pricing power. In 2026, expanding into advanced wafer cleaning and deposition technologies should deepen this moat.
Intel Corporation: Legacy Scale Moat Under Pressure
Intel relies on scale and platform integration but faces a shrinking moat as ROIC lags WACC by nearly 9%. Margins hover near break-even, signaling weak capital efficiency. Upcoming moves into AI chips and foundry services offer growth, but execution risks loom large.
Capital Efficiency vs. Scale Resilience: The Semiconductor Moat Battle
Lam Research’s high and rising ROIC signals a wider, more durable moat than Intel’s declining returns. I see Lam better positioned to defend and grow market share amid industry shifts.
Which stock offers better returns?
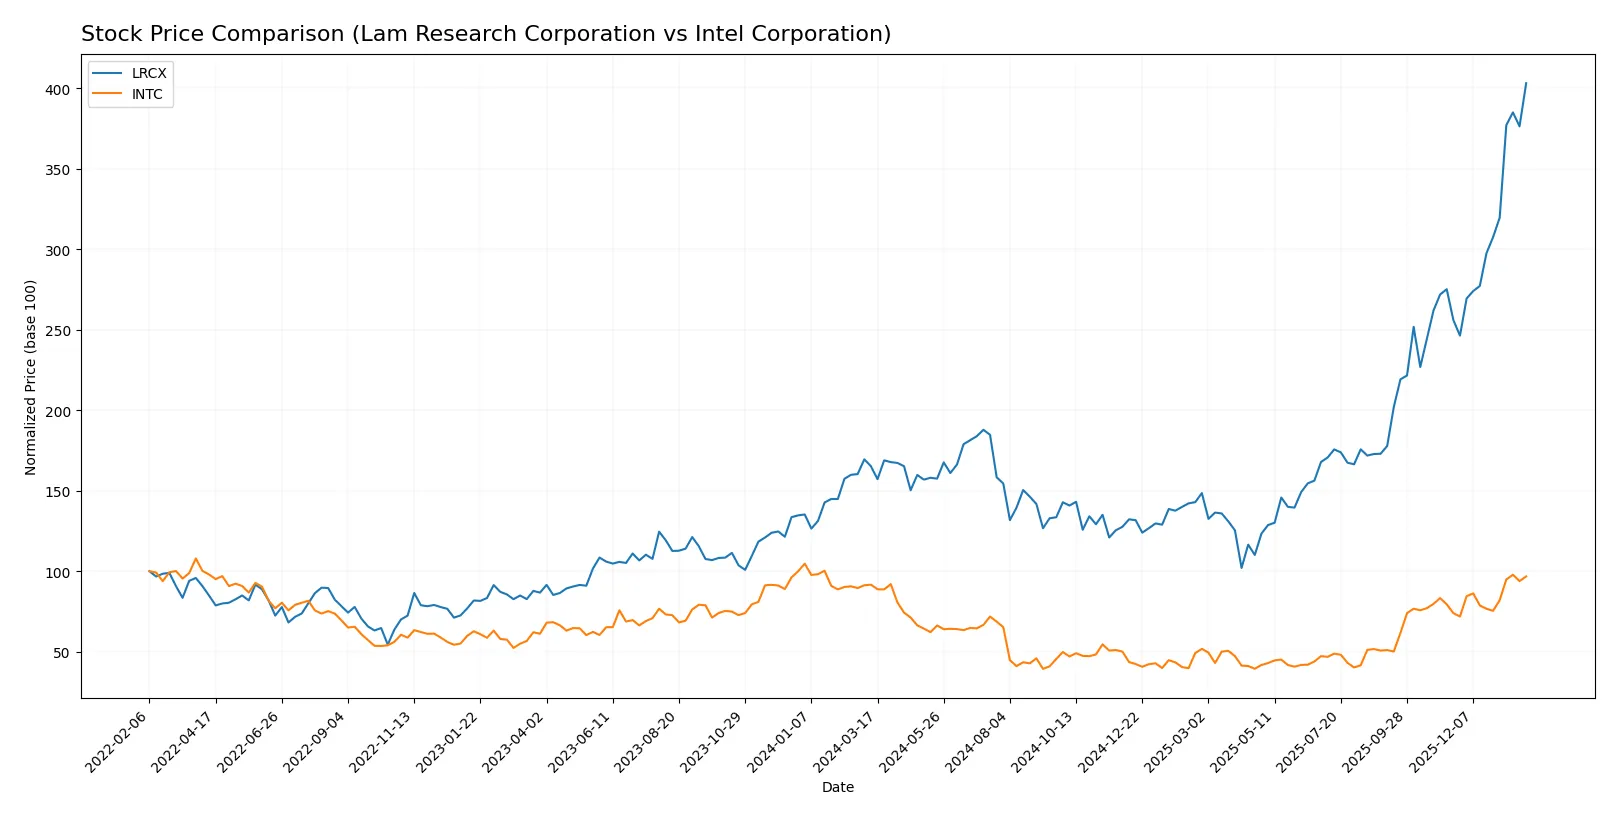
The past year reveals marked price gains and distinct trading dynamics for both stocks, highlighting Lam Research’s pronounced growth versus Intel’s modest advance.
Trend Comparison
Lam Research’s stock surged 144.03% over 12 months, showing a bullish trend with accelerating momentum and notable volatility. It reached a high of 233.46 and a low of 59.09.
Intel’s stock rose 5.61% over the same period, maintaining a bullish but modest trend with acceleration. Its price fluctuated less, peaking at 46.96 and bottoming at 18.89.
Lam Research delivered substantially stronger market performance than Intel, reflecting higher returns and more dynamic price movement during the past year.
Target Prices
Analyst consensus shows a wide range of expectations for Lam Research and Intel, reflecting sector volatility and growth prospects.
| Company | Target Low | Target High | Consensus |
|---|---|---|---|
| Lam Research Corporation | 127 | 325 | 266.76 |
| Intel Corporation | 20 | 66 | 46.95 |
Lam Research’s target consensus at 267 exceeds its current price of 233, indicating upside potential. Intel’s consensus near 47 aligns closely with its current 46.47, suggesting a stable outlook.

Don’t Let Luck Decide Your Entry Point
Optimize your entry points with our advanced ProRealTime indicators. You’ll get efficient buy signals with precise price targets for maximum performance. Start outperforming now!
How do institutions grade them?
Lam Research Corporation Grades
Here are the latest institutional grades for Lam Research Corporation:
| Grading Company | Action | New Grade | Date |
|---|---|---|---|
| UBS | Maintain | Buy | 2026-01-29 |
| Wells Fargo | Maintain | Overweight | 2026-01-29 |
| JP Morgan | Maintain | Overweight | 2026-01-29 |
| RBC Capital | Maintain | Outperform | 2026-01-29 |
| Citigroup | Maintain | Buy | 2026-01-29 |
| Stifel | Maintain | Buy | 2026-01-29 |
| Morgan Stanley | Maintain | Equal Weight | 2026-01-29 |
| Needham | Maintain | Buy | 2026-01-29 |
| Susquehanna | Maintain | Positive | 2026-01-29 |
| Goldman Sachs | Maintain | Buy | 2026-01-29 |
Intel Corporation Grades
Here are the latest institutional grades for Intel Corporation:
| Grading Company | Action | New Grade | Date |
|---|---|---|---|
| RBC Capital | Maintain | Sector Perform | 2026-01-23 |
| Keybanc | Maintain | Overweight | 2026-01-23 |
| Evercore ISI Group | Maintain | In Line | 2026-01-23 |
| Needham | Maintain | Hold | 2026-01-23 |
| Benchmark | Maintain | Buy | 2026-01-23 |
| Rosenblatt | Maintain | Sell | 2026-01-23 |
| UBS | Maintain | Neutral | 2026-01-23 |
| Citigroup | Maintain | Neutral | 2026-01-23 |
| Stifel | Maintain | Hold | 2026-01-23 |
| Wedbush | Maintain | Neutral | 2026-01-23 |
Which company has the best grades?
Lam Research consistently receives stronger and more positive grades, including multiple “Buy,” “Overweight,” and “Outperform” ratings. Intel’s grades are more mixed, with several “Hold,” “Neutral,” and even a “Sell.” This divergence suggests investors may perceive Lam Research as better positioned for growth or stability.
Risks specific to each company
The following categories identify the critical pressure points and systemic threats facing both firms in the 2026 market environment:
1. Market & Competition
Lam Research Corporation
- Operates in a highly specialized semiconductor equipment niche with strong technological moats.
Intel Corporation
- Faces intense competition in CPUs and adjacent markets, struggling with market share erosion.
2. Capital Structure & Debt
Lam Research Corporation
- Maintains a conservative debt-to-equity ratio (0.48) with strong interest coverage (33.43x).
Intel Corporation
- Also moderate leverage (0.41) but weaker interest coverage (2.63x), increasing financial risk.
3. Stock Volatility
Lam Research Corporation
- Higher beta at 1.779 signals greater sensitivity to market swings and cyclical risks.
Intel Corporation
- Lower beta of 1.354 implies less volatility but still exposed to tech sector fluctuations.
4. Regulatory & Legal
Lam Research Corporation
- Global semiconductor equipment sales expose it to export controls and trade restrictions.
Intel Corporation
- Global operations face stricter antitrust scrutiny and potential IP litigation risks.
5. Supply Chain & Operations
Lam Research Corporation
- Complex supply chains sensitive to raw material shortages and geopolitical tensions.
Intel Corporation
- Large-scale chip manufacturing dependent on capital-intensive fabs vulnerable to disruptions.
6. ESG & Climate Transition
Lam Research Corporation
- Industry pressure to reduce energy use and emissions in manufacturing processes.
Intel Corporation
- Faces scrutiny on energy consumption and waste in high-volume chip fabrication.
7. Geopolitical Exposure
Lam Research Corporation
- Significant revenue from China and Asia increases risk from US-China tensions.
Intel Corporation
- Also exposed to geopolitical risks due to reliance on global manufacturing and sales.
Which company shows a better risk-adjusted profile?
Lam Research’s superior profitability, robust balance sheet, and strong financial health offset its higher market volatility. Intel’s losses, weaker returns, and operational challenges elevate its risk profile despite moderate leverage. Lam Research commands a safer investment stance in 2026. Intel’s grey zone Altman Z-score and average Piotroski score highlight financial strain. Lam Research’s very strong Piotroski score and safe zone Altman Z-score reflect resilience amid semiconductor sector cyclicality.
Final Verdict: Which stock to choose?
Lam Research’s superpower lies in its robust value creation and operational excellence. Its consistently growing ROIC well above WACC signals a durable competitive edge. The key point of vigilance is its elevated price-to-book ratio, which suggests a premium valuation. It suits investors targeting aggressive growth in a high-quality semiconductor equipment leader.
Intel commands a strategic moat through its scale and diversified revenue streams, underpinning a defensive posture. Its balance sheet shows more financial risk, and profitability metrics remain challenged, though the valuation appears more attractive. This stock fits investors seeking GARP exposure with a focus on turnaround potential and income stability.
If you prioritize strong capital efficiency and growth durability, Lam Research outshines due to its superior profitability and financial health. However, if you seek value with a margin of safety amid operational rebuilding, Intel offers better stability and a more conservative entry point. Each scenario caters to distinct risk tolerances and time horizons.
Disclaimer: Investment carries a risk of loss of initial capital. The past performance is not a reliable indicator of future results. Be sure to understand risks before making an investment decision.
Go Further
I encourage you to read the complete analyses of Lam Research Corporation and Intel Corporation to enhance your investment decisions: